154 lines
7.8 KiB
Markdown
154 lines
7.8 KiB
Markdown

|
|
||
|
|
> Name
|
||
|
|
|
||
|
|
多重均线云层趋势交易策略-Multi-EMA-Cloud-Trend-Trading-Strategy
|
||
|
|
|
||
|
|
> Author
|
||
|
|
|
||
|
|
ianzeng123
|
||
|
|
|
||
|
|
> Strategy Description
|
||
|
|
|
||
|
|
|
||
|
|
|
||
|
|
|
||
|
|
|
||
|
|
[trans]
|
||
|
|
#### 概述
|
||
|
|
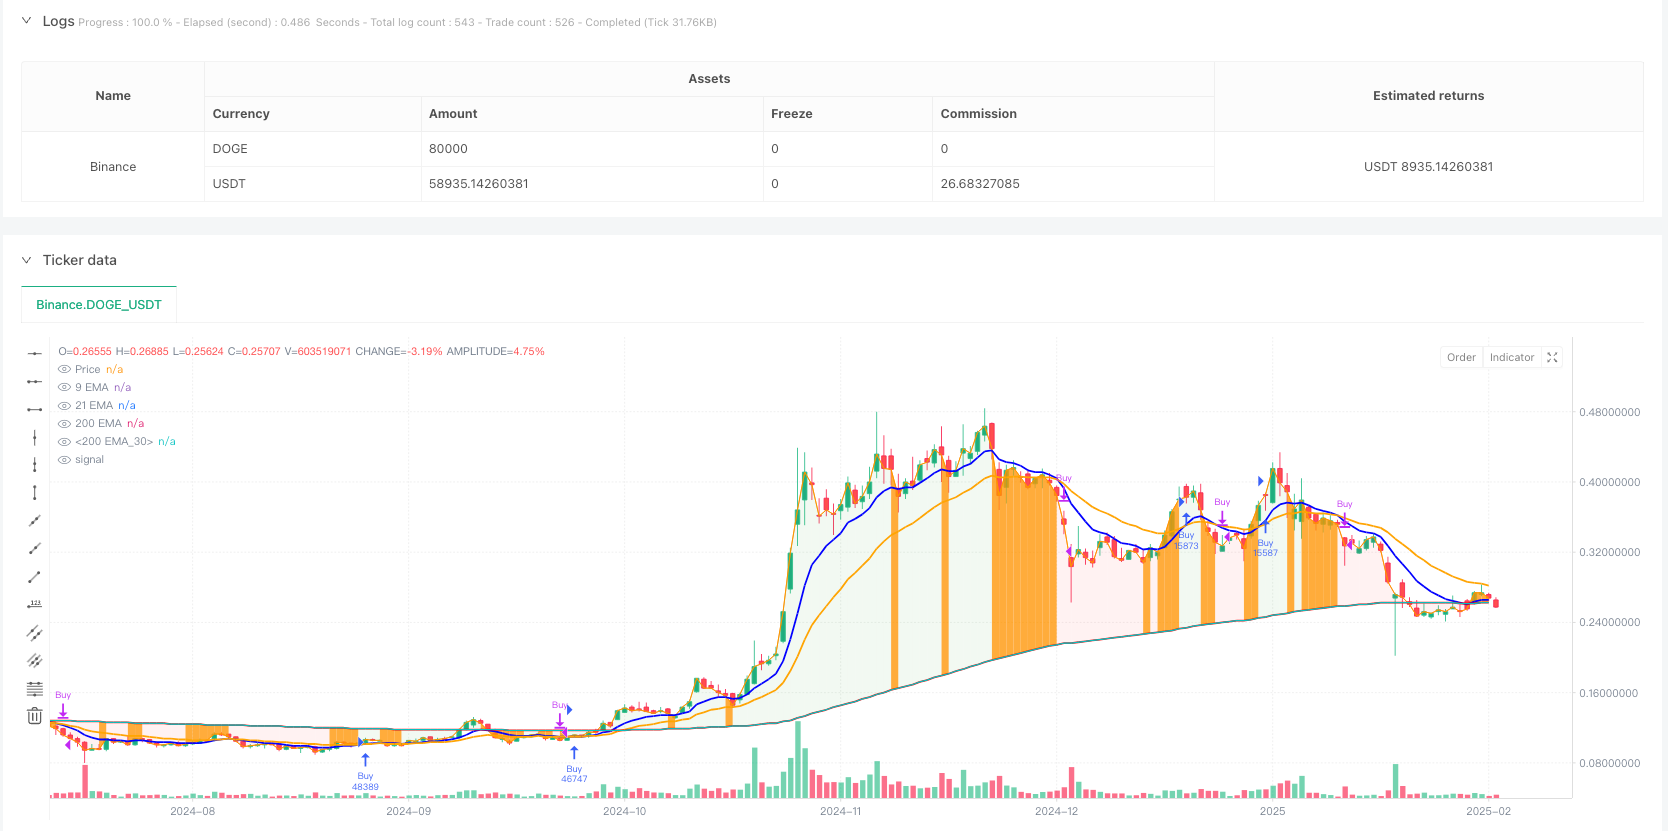
该策略是一个基于多重指数移动平均线(EMA)和云层可视化的趋势跟踪交易系统。策略使用9周期、21周期和200周期三重EMA,通过价格与均线的位置关系以及均线间的交叉来判断市场趋势,并在趋势确认时发出交易信号。系统通过云层的颜色变化直观地展示了市场的趋势状态。
|
||
|
|
|
||
|
|
#### 策略原理
|
||
|
|
策略的核心逻辑基于以下几个关键要素:
|
||
|
|
1. 使用三重EMA(9/21/200)构建趋势框架
|
||
|
|
2. 通过价格与9日EMA的关系以及9日EMA与21日EMA的关系判断短期趋势
|
||
|
|
3. 使用200日EMA作为长期趋势参考线
|
||
|
|
4. 当价格上穿9日EMA且9日EMA上穿21日EMA时,形成绿色云层,表示看涨信号
|
||
|
|
5. 当价格下穿9日EMA且9日EMA下穿21日EMA时,形成红色云层,表示看跌信号
|
||
|
|
6. 交易信号的生成基于云层颜色的变化,绿云开仓做多,红云平仓出场
|
||
|
|
|
||
|
|
#### 策略优势
|
||
|
|
1. 多重时间框架分析:通过不同周期的EMA组合,全面把握市场趋势
|
||
|
|
2. 视觉直观:云层的颜色变化清晰展示市场状态,便于交易决策
|
||
|
|
3. 趋势确认:使用多重确认机制,降低假突破风险
|
||
|
|
4. 自适应性:EMA对最新价格给予较大权重,能较快适应市场变化
|
||
|
|
5. 风险控制:系统自带趋势反转退出机制,有效控制亏损
|
||
|
|
|
||
|
|
#### 策略风险
|
||
|
|
1. 震荡市场风险:在横盘整理阶段可能产生频繁假信号
|
||
|
|
2. 滞后性风险:均线系统具有一定滞后性,可能错过最佳入场点
|
||
|
|
3. 趋势反转风险:在强势趋势突然反转时可能造成较大回撤
|
||
|
|
4. 参数敏感性:不同市场环境下最优参数可能存在差异
|
||
|
|
5. 云层判断风险:仅依赖云层颜色可能忽视其他重要市场信号
|
||
|
|
|
||
|
|
#### 策略优化方向
|
||
|
|
1. 增加成交量确认:引入成交量指标,提高趋势判断准确性
|
||
|
|
2. 优化参数自适应:根据市场波动率动态调整EMA参数
|
||
|
|
3. 引入止损机制:设置移动止损或固定止损,更好地控制风险
|
||
|
|
4. 增加过滤器:添加ATR或RSI等指标过滤假信号
|
||
|
|
5. 完善退出机制:设计更灵活的获利了结机制
|
||
|
|
6. 优化仓位管理:根据趋势强度动态调整持仓比例
|
||
|
|
|
||
|
|
#### 总结
|
||
|
|
多重均线云层趋势交易策略是一个结合技术分析和视觉反馈的完整交易系统。通过多重EMA的配合使用,不仅能够有效捕捉市场趋势,还能通过云层的形式直观展示市场状态。虽然存在一定的滞后性和假信号风险,但通过适当的优化和风险控制措施,该策略能够在趋势市场中获得稳定收益。建议交易者在实盘使用前,充分测试参数组合并根据具体市场特点进行优化。 ||
|
||
|
|
|
||
|
|
#### Overview
|
||
|
|
This strategy is a trend-following trading system based on multiple Exponential Moving Averages (EMAs) and cloud visualization. It utilizes 9-period, 21-period, and 200-period EMAs to determine market trends through price-EMA relationships and crossovers, generating trading signals upon trend confirmation. The system visually represents market trends through cloud color changes.
|
||
|
|
|
||
|
|
#### Strategy Principles
|
||
|
|
The core logic is based on the following key elements:
|
||
|
|
1. Uses triple EMAs (9/21/200) to build a trend framework
|
||
|
|
2. Determines short-term trends through price relation to 9 EMA and 9 EMA relation to 21 EMA
|
||
|
|
3. Uses 200 EMA as a long-term trend reference
|
||
|
|
4. Forms green cloud when price crosses above 9 EMA and 9 EMA crosses above 21 EMA, indicating bullish signal
|
||
|
|
5. Forms red cloud when price crosses below 9 EMA and 9 EMA crosses below 21 EMA, indicating bearish signal
|
||
|
|
6. Generates trading signals based on cloud color changes, entering long positions with green cloud and exiting with red cloud
|
||
|
|
|
||
|
|
#### Strategy Advantages
|
||
|
|
1. Multiple timeframe analysis: Comprehensive trend capture through EMA combinations
|
||
|
|
2. Visual clarity: Clear market state representation through cloud color changes
|
||
|
|
3. Trend confirmation: Multiple confirmation mechanisms reduce false breakout risks
|
||
|
|
4. Adaptability: EMAs give higher weight to recent prices for quick market adaptation
|
||
|
|
5. Risk control: Built-in trend reversal exit mechanism effectively controls losses
|
||
|
|
|
||
|
|
#### Strategy Risks
|
||
|
|
1. Choppy market risk: Frequent false signals during consolidation phases
|
||
|
|
2. Lag risk: Moving average systems have inherent lag, may miss optimal entry points
|
||
|
|
3. Trend reversal risk: Significant drawdowns possible during sudden trend reversals
|
||
|
|
4. Parameter sensitivity: Optimal parameters may vary across market conditions
|
||
|
|
5. Cloud judgment risk: Relying solely on cloud color may overlook other important market signals
|
||
|
|
|
||
|
|
#### Strategy Optimization Directions
|
||
|
|
1. Add volume confirmation: Incorporate volume indicators to improve trend identification accuracy
|
||
|
|
2. Optimize parameter adaptation: Dynamically adjust EMA parameters based on market volatility
|
||
|
|
3. Implement stop-loss mechanisms: Set trailing or fixed stops for better risk control
|
||
|
|
4. Add filters: Include ATR or RSI indicators to filter false signals
|
||
|
|
5. Enhance exit mechanisms: Design more flexible profit-taking strategies
|
||
|
|
6. Optimize position management: Dynamically adjust position sizes based on trend strength
|
||
|
|
|
||
|
|
#### Summary
|
||
|
|
The Multi-EMA Cloud Trend Trading Strategy is a comprehensive trading system combining technical analysis and visual feedback. Through the coordinated use of multiple EMAs, it effectively captures market trends while visually displaying market conditions through cloud formation. While it has inherent lag and false signal risks, appropriate optimization and risk control measures can help achieve stable returns in trending markets. Traders are advised to thoroughly test parameter combinations and optimize according to specific market characteristics before live implementation.[/trans]
|
||
|
|
|
||
|
|
|
||
|
|
|
||
|
|
> Source (PineScript)
|
||
|
|
|
||
|
|
``` pinescript
|
||
|
|
/*backtest
|
||
|
|
start: 2024-02-21 00:00:00
|
||
|
|
end: 2025-02-18 08:00:00
|
||
|
|
period: 1d
|
||
|
|
basePeriod: 1d
|
||
|
|
exchanges: [{"eid":"Binance","currency":"DOGE_USDT"}]
|
||
|
|
*/
|
||
|
|
|
||
|
|
//@version=5
|
||
|
|
strategy("EMA Cloud Strategy", overlay=true, default_qty_type=strategy.percent_of_equity, default_qty_value=10)
|
||
|
|
|
||
|
|
// Inputs for EMA periods
|
||
|
|
ema9_length = input.int(9, title="9 EMA Length", minval=1)
|
||
|
|
ema21_length = input.int(21, title="21 EMA Length", minval=1)
|
||
|
|
ema200_length = input.int(200, title="200 EMA Length", minval=1)
|
||
|
|
|
||
|
|
// Inputs for EMA colors
|
||
|
|
ema9_color = input.color(color.new(color.blue, 0), title="9 EMA Color")
|
||
|
|
ema21_color = input.color(color.new(color.orange, 0), title="21 EMA Color")
|
||
|
|
ema200_color = input.color(color.new(color.red, 0), title="200 EMA Color")
|
||
|
|
|
||
|
|
// Calculate EMAs
|
||
|
|
ema9 = ta.ema(close, ema9_length)
|
||
|
|
ema21 = ta.ema(close, ema21_length)
|
||
|
|
ema200 = ta.ema(close, ema200_length)
|
||
|
|
|
||
|
|
// Plot EMAs
|
||
|
|
plot(ema9, color=ema9_color, title="9 EMA", linewidth=2)
|
||
|
|
plot(ema21, color=ema21_color, title="21 EMA", linewidth=2)
|
||
|
|
plot(ema200, color=ema200_color, title="200 EMA", linewidth=2)
|
||
|
|
|
||
|
|
// Conditions for clouds
|
||
|
|
is_bullish = close > ema9 and ema9 > ema21
|
||
|
|
is_bearish = close < ema9 and ema9 < ema21
|
||
|
|
|
||
|
|
// Plot clouds
|
||
|
|
fill_color = is_bullish ? color.new(color.green, 90) : is_bearish ? color.new(color.red, 90) : na
|
||
|
|
fill(plot(close, title="Price", display=display.none), plot(ema200, title="200 EMA", display=display.none), color=fill_color, title="Cloud")
|
||
|
|
|
||
|
|
// Strategy logic
|
||
|
|
if (is_bullish)
|
||
|
|
strategy.entry("Buy", strategy.long) // Enter long position when green cloud starts
|
||
|
|
|
||
|
|
if (is_bearish)
|
||
|
|
strategy.close("Buy") // Close long position when red cloud starts
|
||
|
|
|
||
|
|
// Optional: Add alerts for strategy conditions
|
||
|
|
alertcondition(is_bullish, title="Bullish Condition", message="Price is above 9 EMA and 9 EMA is above 21 EMA")
|
||
|
|
alertcondition(is_bearish, title="Bearish Condition", message="Price is below 9 EMA and 9 EMA is below 21 EMA")
|
||
|
|
```
|
||
|
|
|
||
|
|
> Detail
|
||
|
|
|
||
|
|
https://www.fmz.com/strategy/482843
|
||
|
|
|
||
|
|
> Last Modified
|
||
|
|
|
||
|
|
2025-02-20 14:48:05
|