256 lines
19 KiB
Markdown
256 lines
19 KiB
Markdown

|
|
|||
|
|
> Name
|
|||
|
|
|
|||
|
|
多维图表模式量化策略融合头肩顶底与双顶底形态的技术分析交易系统-Multi-Dimensional-Chart-Pattern-Quantitative-Strategy-A-Technical-Analysis-Trading-System-Integrating-Head-and-Shoulders-and-Double-Top-Bottom-Formations
|
|||
|
|
|
|||
|
|
> Author
|
|||
|
|
|
|||
|
|
ianzeng123
|
|||
|
|
|
|||
|
|
> Strategy Description
|
|||
|
|
|
|||
|
|
|
|||
|
|
|
|||
|
|
|
|||
|
|
|
|||
|
|
[trans]
|
|||
|
|
|
|||
|
|
#### 概述
|
|||
|
|
|
|||
|
|
多维图表模式量化策略是一种基于技术分析中经典图表形态识别的交易系统,主要聚焦于头肩顶/底和双顶/底等反转形态的识别与交易。该策略通过程序化方式定义并识别市场中出现的这些关键形态,结合ATR(平均真实范围)指标来设置止损和止盈水平,从而构建一个完整的交易框架。该策略核心在于捕捉市场趋势变化的关键转折点,尤其是当价格形成特定的结构性形态时,这些形态往往预示着市场即将从上升转为下降或从下降转为上升。
|
|||
|
|
|
|||
|
|
#### 策略原理
|
|||
|
|
|
|||
|
|
该策略的核心原理围绕着识别三种主要的图表形态:
|
|||
|
|
|
|||
|
|
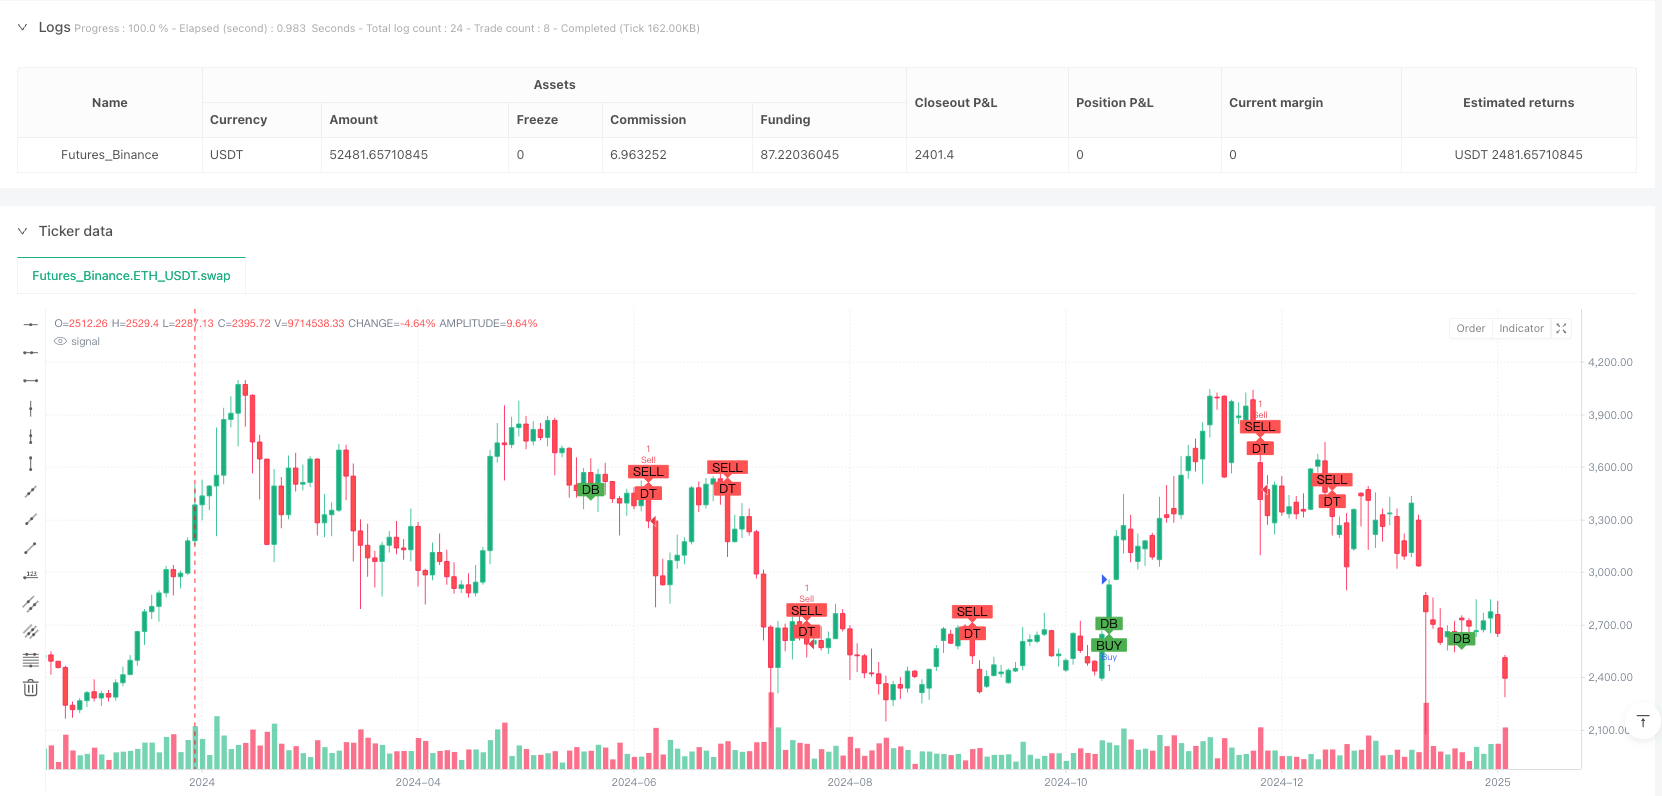
1. **头肩顶形态识别**:通过对价格高点的连续比较来识别。策略检测一个中心高点(头部)是否高于其两侧的高点(肩部),满足`high[1] > high[2] && high[1] > high[0] && high[1] > high[3] && high[1] > high[4] && high[0] < high[2] && high[0] < high[3]`的条件时,判定为头肩顶形态。这种形态通常预示着上升趋势的结束和可能的下降趋势的开始。
|
|||
|
|
|
|||
|
|
2. **双顶形态识别**:使用与头肩顶相似的逻辑,但更聚焦于两个相近的高点。当形成两个接近的价格高点,且中间有一个明显的低点时,被视为双顶形态,这也是一个看跌的反转信号。
|
|||
|
|
|
|||
|
|
3. **双底形态识别**:与双顶相反,通过识别两个接近的价格低点和中间的一个高点来确定。满足`low[1] < low[2] && low[1] < low[0] && low[1] < low[3] && low[1] < low[4] && low[0] > low[2] && low[0] > low[3]`的条件时,判定为双底形态,这通常是一个看涨的反转信号。
|
|||
|
|
|
|||
|
|
交易信号生成基于形态识别结合价格行为:
|
|||
|
|
- 买入信号:当识别到双底形态且当前收盘价高于开盘价时(`doubleBottomPattern && close > open`)
|
|||
|
|
- 卖出信号:当识别到双顶形态且当前收盘价低于开盘价时(`doubleTopPattern && close < open`)
|
|||
|
|
|
|||
|
|
风险管理通过ATR(平均真实范围)指标实现:
|
|||
|
|
- 止损设置为1.5倍ATR值(`stopLoss = atrValue * 1.5`)
|
|||
|
|
- 止盈设置为3倍ATR值(`takeProfit = atrValue * 3`)
|
|||
|
|
|
|||
|
|
这种设计使得策略能够适应不同市场的波动性,在高波动市场提供更宽的止损,而在低波动市场则提供相对较窄的止损。
|
|||
|
|
|
|||
|
|
#### 策略优势
|
|||
|
|
|
|||
|
|
1. **基于经典技术分析**:该策略基于被广泛认可和应用的图表形态分析,这些形态在各种市场环境中都显示出一定的有效性,拥有大量的历史验证数据。
|
|||
|
|
|
|||
|
|
2. **自适应风险管理**:通过使用ATR指标来设置止损和止盈水平,策略能够根据市场的实际波动性自动调整风险管理参数,避免了固定点数止损可能带来的过度风险或过度保守。
|
|||
|
|
|
|||
|
|
3. **明确的进出场规则**:策略提供了清晰的进场(形态确认+价格确认)和出场(基于ATR的止损/止盈)条件,有助于交易者保持纪律性,减少情绪化交易。
|
|||
|
|
|
|||
|
|
4. **可视化交易信号**:通过`plotshape`函数将形态识别和交易信号直观地显示在图表上,便于交易者实时监控和分析策略表现。
|
|||
|
|
|
|||
|
|
5. **灵活的适应性**:虽然当前实现主要聚焦于几种特定的图表形态,但策略框架允许轻松扩展以包含更多不同类型的形态识别,如三角形、旗形、楔形等。
|
|||
|
|
|
|||
|
|
#### 策略风险
|
|||
|
|
|
|||
|
|
1. **形态识别的简化处理**:当前的形态识别逻辑相对简化,仅基于几个价格点的比较,可能无法捕捉到更复杂的市场结构,导致一些误判。例如,头肩顶和双顶的判定逻辑相同,可能导致错误分类。
|
|||
|
|
|
|||
|
|
2. **缺乏成交量确认**:传统技术分析中,图表形态往往需要成交量的配合确认,而当前策略未纳入成交量因素,可能导致形态有效性的判断不够全面。
|
|||
|
|
|
|||
|
|
3. **固定ATR倍数的风险**:虽然使用ATR使得止损/止盈能够适应波动性,但固定的1.5倍和3倍参数可能不适用于所有市场环境,特别是在极端行情或突发事件中。
|
|||
|
|
|
|||
|
|
4. **无时间框架考虑**:策略未考虑不同时间框架的形态识别差异,可能导致在较短时间框架上产生过多的虚假信号,或在较长时间框架上错过重要的交易机会。
|
|||
|
|
|
|||
|
|
5. **缺乏趋势过滤**:策略未设置趋势过滤机制,这可能导致在强趋势市场中频繁触发反向交易信号,进而产生一系列的亏损交易。
|
|||
|
|
|
|||
|
|
#### 策略优化方向
|
|||
|
|
|
|||
|
|
1. **改进形态识别算法**:
|
|||
|
|
- 区分头肩顶和双顶的识别逻辑,增加更多参数来提高识别的准确性
|
|||
|
|
- 增加对形态比例和对称性的判断,例如头部应显著高于肩部,两个肩部高度应相近
|
|||
|
|
- 引入形态完整度评分,根据形态的标准度来调整交易信号的可信度
|
|||
|
|
|
|||
|
|
2. **整合成交量分析**:
|
|||
|
|
- 在形态识别中加入成交量确认条件,例如头肩顶形态中,头部的成交量应高于右肩
|
|||
|
|
- 在形态突破时,成交量应显著放大,可将此作为交易信号的强化条件
|
|||
|
|
|
|||
|
|
3. **优化风险管理策略**:
|
|||
|
|
- 引入动态的ATR倍数,根据市场波动性的变化、形态的大小或市场环境来调整止损/止盈比例
|
|||
|
|
- 实现阶梯式止损,随着交易向有利方向发展逐步调整止损位置
|
|||
|
|
- 增加部分盈利了结机制,以锁定已获利润并降低整体风险
|
|||
|
|
|
|||
|
|
4. **增加趋势过滤器**:
|
|||
|
|
- 加入移动平均线或其他趋势指标来过滤交易信号,仅在顺应主趋势的方向上入场
|
|||
|
|
- 在不同周期上确认趋势一致性,避免在较大趋势的逆向上频繁交易
|
|||
|
|
|
|||
|
|
5. **多时间框架分析**:
|
|||
|
|
- 将策略扩展为多时间框架分析,使用较长周期确定主趋势方向,较短周期寻找精确入场点
|
|||
|
|
- 引入时间框架一致性评分,提高交易信号的质量
|
|||
|
|
|
|||
|
|
6. **增加补充确认指标**:
|
|||
|
|
- 整合RSI、MACD等指标作为辅助确认工具,提高交易信号的可靠性
|
|||
|
|
- 考虑市场波动周期和季节性因素,在高胜率时段增加交易频率或仓位
|
|||
|
|
|
|||
|
|
#### 总结
|
|||
|
|
|
|||
|
|
多维图表模式量化策略是一种基于经典技术分析图表形态的交易系统,通过程序化识别头肩顶/底和双顶/底等市场结构来捕捉潜在的趋势转折点。该策略结合ATR指标进行风险管理,提供了一个相对完整的交易框架。策略的主要优势在于其基于被广泛验证的技术分析理论,具有清晰的交易规则和自适应的风险管理机制。然而,当前实现的简化形态识别逻辑、缺乏成交量确认和趋势过滤是主要的风险点。
|
|||
|
|
|
|||
|
|
为了提升策略的稳健性和性能,建议从完善形态识别算法、整合成交量分析、优化风险管理策略、增加趋势过滤器、实现多时间框架分析以及增加辅助确认指标等方面进行优化。通过这些改进,策略有望在保持其基于经典图表形态分析优势的同时,显著提高交易信号的质量和整体盈利能力。
|
|||
|
|
|
|||
|
|
最终,任何交易策略都需要经过充分的回测和实盘验证,在实际应用中还应结合市场环境的变化、交易品种的特性以及个人的风险承受能力进行适当的参数调整,以达到最优的交易效果。 ||
|
|||
|
|
|
|||
|
|
#### Overview
|
|||
|
|
|
|||
|
|
The Multi-Dimensional Chart Pattern Quantitative Strategy is a trading system based on the identification of classic chart formations in technical analysis, focusing mainly on reversal patterns such as Head and Shoulders and Double Tops/Bottoms. This strategy programmatically defines and identifies these key formations in the market, combining the ATR (Average True Range) indicator to set stop-loss and take-profit levels, thus building a complete trading framework. The core of this strategy lies in capturing critical turning points in market trends, especially when prices form specific structural patterns that often indicate an imminent shift from uptrend to downtrend or vice versa.
|
|||
|
|
|
|||
|
|
#### Strategy Principles
|
|||
|
|
|
|||
|
|
The core principles of this strategy revolve around identifying three main chart patterns:
|
|||
|
|
|
|||
|
|
1. **Head and Shoulders Pattern Recognition**: Identified through sequential comparison of price highs. The strategy detects whether a central high point (head) is higher than the highs on either side (shoulders), confirming a pattern when `high[1] > high[2] && high[1] > high[0] && high[1] > high[3] && high[1] > high[4] && high[0] < high[2] && high[0] < high[3]`. This pattern typically signals the end of an uptrend and the potential beginning of a downtrend.
|
|||
|
|
|
|||
|
|
2. **Double Top Pattern Recognition**: Using logic similar to the Head and Shoulders, but focusing more on two nearby highs. When two close price peaks form with a significant low between them, it's considered a Double Top pattern, which is also a bearish reversal signal.
|
|||
|
|
|
|||
|
|
3. **Double Bottom Pattern Recognition**: Opposite to the Double Top, identified by recognizing two close price lows with a high between them. When `low[1] < low[2] && low[1] < low[0] && low[1] < low[3] && low[1] < low[4] && low[0] > low[2] && low[0] > low[3]`, it's identified as a Double Bottom pattern, typically a bullish reversal signal.
|
|||
|
|
|
|||
|
|
Trade signal generation is based on pattern recognition combined with price action:
|
|||
|
|
- Buy signal: When a Double Bottom pattern is identified and the current closing price is higher than the opening price (`doubleBottomPattern && close > open`)
|
|||
|
|
- Sell signal: When a Double Top pattern is identified and the current closing price is lower than the opening price (`doubleTopPattern && close < open`)
|
|||
|
|
|
|||
|
|
Risk management is implemented through the ATR (Average True Range) indicator:
|
|||
|
|
- Stop-loss is set at 1.5 times the ATR value (`stopLoss = atrValue * 1.5`)
|
|||
|
|
- Take-profit is set at 3 times the ATR value (`takeProfit = atrValue * 3`)
|
|||
|
|
|
|||
|
|
This design allows the strategy to adapt to different market volatilities, providing wider stops in high-volatility markets and relatively narrower stops in low-volatility markets.
|
|||
|
|
|
|||
|
|
#### Strategy Advantages
|
|||
|
|
|
|||
|
|
1. **Based on Classical Technical Analysis**: The strategy is based on widely recognized and applied chart pattern analysis, which has shown a certain degree of effectiveness in various market environments and has a large amount of historical validation data.
|
|||
|
|
|
|||
|
|
2. **Adaptive Risk Management**: By using the ATR indicator to set stop-loss and take-profit levels, the strategy can automatically adjust risk management parameters according to actual market volatility, avoiding excessive risk or excessive conservatism that might come with fixed-point stops.
|
|||
|
|
|
|||
|
|
3. **Clear Entry and Exit Rules**: The strategy provides clear entry (pattern confirmation + price confirmation) and exit (ATR-based stop-loss/take-profit) conditions, helping traders maintain discipline and reduce emotional trading.
|
|||
|
|
|
|||
|
|
4. **Visualized Trading Signals**: Through the `plotshape` function, pattern recognition and trading signals are intuitively displayed on the chart, facilitating real-time monitoring and analysis of strategy performance.
|
|||
|
|
|
|||
|
|
5. **Flexible Adaptability**: While the current implementation mainly focuses on several specific chart patterns, the strategy framework allows for easy expansion to include more different types of pattern recognition, such as triangles, flags, wedges, etc.
|
|||
|
|
|
|||
|
|
#### Strategy Risks
|
|||
|
|
|
|||
|
|
1. **Simplified Pattern Recognition**: The current pattern recognition logic is relatively simplified, based only on the comparison of a few price points, and may not capture more complex market structures, leading to some misjudgments. For example, the identification logic for Head and Shoulders and Double Top is the same, which may lead to misclassification.
|
|||
|
|
|
|||
|
|
2. **Lack of Volume Confirmation**: In traditional technical analysis, chart patterns often need to be confirmed by volume, but the current strategy does not incorporate volume factors, which may lead to incomplete judgment of pattern validity.
|
|||
|
|
|
|||
|
|
3. **Fixed ATR Multiple Risk**: Although using ATR allows stop-loss/take-profit to adapt to volatility, the fixed parameters of 1.5 and 3 times may not be applicable to all market environments, especially in extreme market conditions or sudden events.
|
|||
|
|
|
|||
|
|
4. **No Timeframe Consideration**: The strategy does not consider the differences in pattern recognition across different timeframes, which may result in too many false signals on shorter timeframes or missed important trading opportunities on longer timeframes.
|
|||
|
|
|
|||
|
|
5. **Lack of Trend Filtering**: The strategy has no trend filtering mechanism, which may lead to frequent triggering of reverse trading signals in strong trend markets, resulting in a series of losing trades.
|
|||
|
|
|
|||
|
|
#### Strategy Optimization Directions
|
|||
|
|
|
|||
|
|
1. **Improve Pattern Recognition Algorithms**:
|
|||
|
|
- Differentiate the recognition logic between Head and Shoulders and Double Top, and add more parameters to improve recognition accuracy
|
|||
|
|
- Add judgment of pattern proportion and symmetry, for example, the head should be significantly higher than the shoulders, and the heights of the two shoulders should be similar
|
|||
|
|
- Introduce pattern completeness scoring, adjusting the credibility of trading signals based on how standard the pattern is
|
|||
|
|
|
|||
|
|
2. **Integrate Volume Analysis**:
|
|||
|
|
- Add volume confirmation conditions in pattern recognition, for example, in a Head and Shoulders pattern, the volume at the head should be higher than at the right shoulder
|
|||
|
|
- Volume should significantly increase during pattern breakout, which can be used as a reinforcing condition for trading signals
|
|||
|
|
|
|||
|
|
3. **Optimize Risk Management Strategy**:
|
|||
|
|
- Introduce dynamic ATR multiples, adjusting stop-loss/take-profit ratios based on changes in market volatility, pattern size, or market environment
|
|||
|
|
- Implement stepped stop-loss, gradually adjusting stop-loss positions as the trade moves in a favorable direction
|
|||
|
|
- Add partial profit-taking mechanisms to lock in profits and reduce overall risk
|
|||
|
|
|
|||
|
|
4. **Add Trend Filters**:
|
|||
|
|
- Incorporate moving averages or other trend indicators to filter trading signals, entering only in the direction that aligns with the main trend
|
|||
|
|
- Confirm trend consistency across different periods to avoid frequent trading against larger trends
|
|||
|
|
|
|||
|
|
5. **Multi-Timeframe Analysis**:
|
|||
|
|
- Extend the strategy to multi-timeframe analysis, using longer periods to determine the main trend direction and shorter periods to find precise entry points
|
|||
|
|
- Introduce timeframe consistency scoring to improve the quality of trading signals
|
|||
|
|
|
|||
|
|
6. **Add Supplementary Confirmation Indicators**:
|
|||
|
|
- Integrate indicators such as RSI, MACD as auxiliary confirmation tools to improve the reliability of trading signals
|
|||
|
|
- Consider market cycle and seasonality factors, increasing trading frequency or position size during high win-rate periods
|
|||
|
|
|
|||
|
|
#### Summary
|
|||
|
|
|
|||
|
|
The Multi-Dimensional Chart Pattern Quantitative Strategy is a trading system based on classical technical analysis chart patterns, programmatically identifying market structures such as Head and Shoulders and Double Tops/Bottoms to capture potential trend turning points. This strategy combines the ATR indicator for risk management, providing a relatively complete trading framework. The main advantages of the strategy lie in its basis in widely validated technical analysis theory, clear trading rules, and adaptive risk management mechanisms. However, the simplified pattern recognition logic, lack of volume confirmation, and trend filtering in the current implementation are the main risk points.
|
|||
|
|
|
|||
|
|
To enhance the robustness and performance of the strategy, it is recommended to improve it in aspects such as perfecting pattern recognition algorithms, integrating volume analysis, optimizing risk management strategies, adding trend filters, implementing multi-timeframe analysis, and increasing auxiliary confirmation indicators. Through these improvements, the strategy is expected to significantly improve the quality of trading signals and overall profitability while maintaining its advantages based on classical chart pattern analysis.
|
|||
|
|
|
|||
|
|
Ultimately, any trading strategy needs to undergo thorough backtesting and live market validation. In practical application, appropriate parameter adjustments should be made in conjunction with changes in market environment, characteristics of trading instruments, and individual risk tolerance to achieve optimal trading results.[/trans]
|
|||
|
|
|
|||
|
|
|
|||
|
|
|
|||
|
|
> Source (PineScript)
|
|||
|
|
|
|||
|
|
``` pinescript
|
|||
|
|
/*backtest
|
|||
|
|
start: 2024-02-28 00:00:00
|
|||
|
|
end: 2025-02-26 08:00:00
|
|||
|
|
period: 2d
|
|||
|
|
basePeriod: 2d
|
|||
|
|
exchanges: [{"eid":"Futures_Binance","currency":"ETH_USDT"}]
|
|||
|
|
*/
|
|||
|
|
|
|||
|
|
//@version=5
|
|||
|
|
strategy("Chart Pattern Strategy - Head and Shoulders / Double Top/Bottom", overlay=true)
|
|||
|
|
|
|||
|
|
// Function to detect a simple Head and Shoulders pattern
|
|||
|
|
isHeadAndShoulders() =>
|
|||
|
|
high[1] > high[2] and high[1] > high[0] and high[1] > high[3] and high[1] > high[4] and high[0] < high[2] and high[0] < high[3]
|
|||
|
|
|
|||
|
|
// Function to detect a Double Top pattern
|
|||
|
|
isDoubleTop() =>
|
|||
|
|
high[1] > high[2] and high[1] > high[0] and high[1] > high[3] and high[1] > high[4] and high[0] < high[2] and high[0] < high[3]
|
|||
|
|
|
|||
|
|
// Function to detect a Double Bottom pattern
|
|||
|
|
isDoubleBottom() =>
|
|||
|
|
low[1] < low[2] and low[1] < low[0] and low[1] < low[3] and low[1] < low[4] and low[0] > low[2] and low[0] > low[3]
|
|||
|
|
|
|||
|
|
// Detecting Head and Shoulders, Double Top, and Double Bottom Patterns
|
|||
|
|
headAndShouldersPattern = isHeadAndShoulders()
|
|||
|
|
doubleTopPattern = isDoubleTop()
|
|||
|
|
doubleBottomPattern = isDoubleBottom()
|
|||
|
|
|
|||
|
|
// Plotting Head and Shoulders, Double Top, and Double Bottom detections
|
|||
|
|
plotshape(headAndShouldersPattern, title="Head and Shoulders", location=location.abovebar, color=color.red, style=shape.labelup, text="HS")
|
|||
|
|
plotshape(doubleTopPattern, title="Double Top", location=location.abovebar, color=color.red, style=shape.labelup, text="DT")
|
|||
|
|
plotshape(doubleBottomPattern, title="Double Bottom", location=location.belowbar, color=color.green, style=shape.labeldown, text="DB")
|
|||
|
|
|
|||
|
|
// Entry logic for Buy and Sell signals
|
|||
|
|
longSignal = doubleBottomPattern and close > open
|
|||
|
|
shortSignal = doubleTopPattern and close < open
|
|||
|
|
|
|||
|
|
// Take profit and stop loss based on ATR for simplicity
|
|||
|
|
atrLength = input.int(14, title="ATR Length")
|
|||
|
|
atrValue = ta.atr(atrLength)
|
|||
|
|
stopLoss = atrValue * 1.5 // Stop loss 1.5 ATR
|
|||
|
|
takeProfit = atrValue * 3 // Take profit 3 ATR
|
|||
|
|
|
|||
|
|
// Plot buy and sell signals
|
|||
|
|
plotshape(longSignal, title="Buy Signal", location=location.belowbar, color=color.green, style=shape.labelup, text="BUY")
|
|||
|
|
plotshape(shortSignal, title="Sell Signal", location=location.abovebar, color=color.red, style=shape.labeldown, text="SELL")
|
|||
|
|
|
|||
|
|
// Executing trades based on conditions
|
|||
|
|
if (longSignal)
|
|||
|
|
strategy.entry("Buy", strategy.long)
|
|||
|
|
strategy.exit("Take Profit/Stop Loss", from_entry="Buy", stop=close - stopLoss, limit=close + takeProfit)
|
|||
|
|
|
|||
|
|
if (shortSignal)
|
|||
|
|
strategy.entry("Sell", strategy.short)
|
|||
|
|
strategy.exit("Take Profit/Stop Loss", from_entry="Sell", stop=close + stopLoss, limit=close - takeProfit)
|
|||
|
|
|
|||
|
|
```
|
|||
|
|
|
|||
|
|
> Detail
|
|||
|
|
|
|||
|
|
https://www.fmz.com/strategy/484101
|
|||
|
|
|
|||
|
|
> Last Modified
|
|||
|
|
|
|||
|
|
2025-02-28 10:19:51
|