242 lines
18 KiB
Markdown
242 lines
18 KiB
Markdown

|
|
|||
|
|
> Name
|
|||
|
|
|
|||
|
|
多时间框架趋势跟踪与超级趋势动量优化策略-Multi-Timeframe-Trend-Following-with-Supertrend-Momentum-Optimization-Strategy
|
|||
|
|
|
|||
|
|
> Author
|
|||
|
|
|
|||
|
|
ianzeng123
|
|||
|
|
|
|||
|
|
> Strategy Description
|
|||
|
|
|
|||
|
|
|
|||
|
|
|
|||
|
|
|
|||
|
|
|
|||
|
|
|
|||
|
|
[trans]
|
|||
|
|
|
|||
|
|
#### 概述
|
|||
|
|
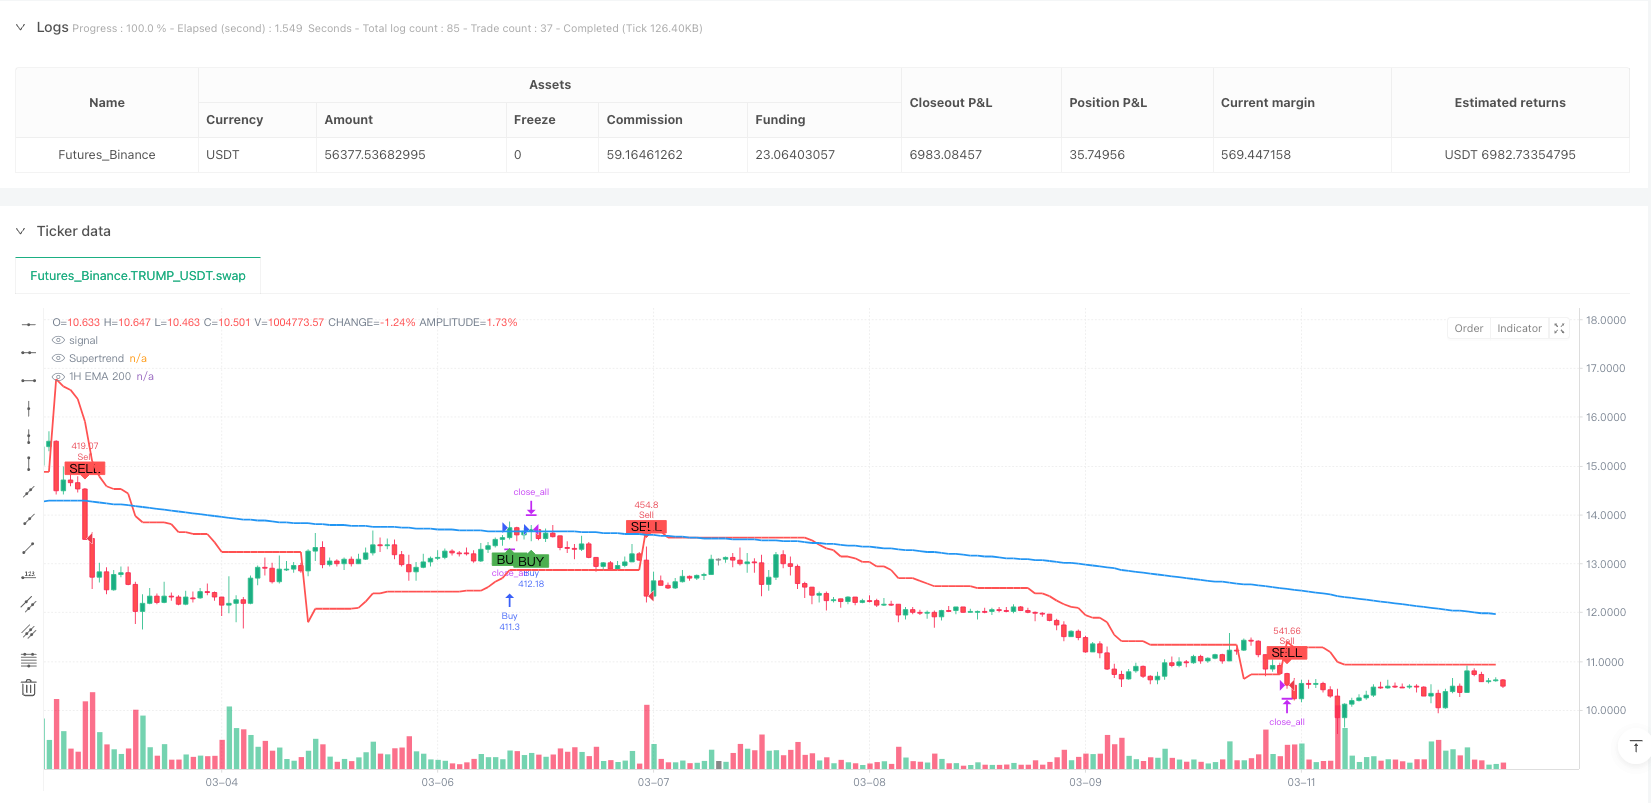
该策略是一种多时间框架的趋势跟踪交易系统,结合了1小时图表上的200均线(EMA)作为趋势确认指标和15分钟图表上的超级趋势(Supertrend)指标作为入场信号。这种组合利用了更高时间框架的趋势方向指引与较低时间框架的精确入场点,形成了一个既能把握大趋势又能优化入场时机的完整交易系统。策略还包含了基于超级趋势指标值的止损设置和基于风险比例的获利目标,为每笔交易提供了清晰的风险管理框架。
|
|||
|
|
|
|||
|
|
#### 策略原理
|
|||
|
|
该策略的核心原理是通过多时间框架分析来过滤交易信号,确保交易方向与主要趋势保持一致。具体实现方式如下:
|
|||
|
|
|
|||
|
|
1. **趋势确认机制(1小时图表)**:
|
|||
|
|
- 使用200期指数移动平均线(EMA 200)判断整体市场趋势
|
|||
|
|
- 当价格位于EMA 200上方时,确认为上升趋势
|
|||
|
|
- 当价格位于EMA 200下方时,确认为下降趋势
|
|||
|
|
|
|||
|
|
2. **入场信号(15分钟图表)**:
|
|||
|
|
- 采用超级趋势指标(Supertrend)生成精确入场信号
|
|||
|
|
- 当超级趋势呈绿色(向上)时,生成买入信号
|
|||
|
|
- 当超级趋势呈红色(向下)时,生成卖出信号
|
|||
|
|
|
|||
|
|
3. **风险管理**:
|
|||
|
|
- 止损设置:固定在入场时的超级趋势指标值位置
|
|||
|
|
- 获利目标:入场价格与止损之间距离的1.5倍(代码中实际为2倍)
|
|||
|
|
- 交易管理:当新信号产生时,会关闭之前的交易,确保任何时候只有一个交易活跃
|
|||
|
|
|
|||
|
|
通过代码分析可以看出,策略使用request.security函数从1小时时间框架获取EMA 200数据,并将其与当前价格比较确定趋势方向。同时,在当前的15分钟图表上计算超级趋势指标值及其方向。只有当两个时间框架的信号一致时(例如,1小时上升趋势+15分钟超级趋势向上),才会触发交易信号。
|
|||
|
|
|
|||
|
|
#### 策略优势
|
|||
|
|
深入分析代码后,该策略展现出以下显著优势:
|
|||
|
|
|
|||
|
|
1. **趋势筛选更加可靠**:通过结合两个时间框架的趋势确认,显著减少了假突破和逆势交易的可能性。更高时间框架(1小时)的EMA 200提供了更稳定的趋势判断,而不仅仅依赖于波动较大的短期时间框架。
|
|||
|
|
|
|||
|
|
2. **入场时机精确**:超级趋势指标在短期时间框架(15分钟)上提供了精确的入场点,使交易者能够在确认趋势的同时优化入场价格,提高交易的性价比。
|
|||
|
|
|
|||
|
|
3. **风险管理自动化**:策略内置了基于市场波动性的动态止损机制,超级趋势指标本身就考虑了市场波动性(通过ATR计算),因此止损位置会根据市场条件自动调整。
|
|||
|
|
|
|||
|
|
4. **获利目标比例设计**:通过设置固定风险回报比(2:1)的获利目标,策略确保了长期盈利的可能性,即使胜率不是特别高,系统也可能实现正期望值。
|
|||
|
|
|
|||
|
|
5. **避免交易重叠**:策略确保在生成新信号时关闭现有交易,避免了持仓叠加风险,简化了资金管理和风险控制。
|
|||
|
|
|
|||
|
|
#### 策略风险
|
|||
|
|
尽管该策略设计合理,但仍存在以下几点需要注意的风险:
|
|||
|
|
|
|||
|
|
1. **趋势转折点反应滞后**:由于使用较长周期(200期)的移动平均线,策略在趋势转折点的反应会相对滞后,可能导致在市场反转初期仍继续按原趋势方向交易,造成一定损失。
|
|||
|
|
|
|||
|
|
2. **震荡市场假信号增多**:在横盘整理或震荡市场中,价格可能频繁穿越EMA 200线,同时超级趋势指标也会频繁变向,产生多次假信号,导致连续止损。
|
|||
|
|
|
|||
|
|
3. **固定风险回报比的局限性**:虽然策略设置了固定的2:1风险回报比,但不同市场和不同时期的最优风险回报比可能有所不同,固定设置可能不总是最优选择。
|
|||
|
|
|
|||
|
|
4. **参数敏感性**:超级趋势指标的参数(ATR周期和因子)对策略性能有显著影响,不同市场可能需要不同的参数组合,这增加了策略优化的复杂性。
|
|||
|
|
|
|||
|
|
5. **流动性风险**:在低流动性市场或极端市场条件下,实际止损可能发生滑点,导致实际损失超过预期。
|
|||
|
|
|
|||
|
|
解决方法包括:增加趋势过滤条件(如趋势强度指标),调整超级趋势参数以适应不同市场条件,设置最大连续亏损次数限制,以及根据市场波动性动态调整风险回报比。
|
|||
|
|
|
|||
|
|
#### 策略优化方向
|
|||
|
|
通过深入分析代码,可以识别以下几个可能的优化方向:
|
|||
|
|
|
|||
|
|
1. **引入趋势强度过滤**:当前策略仅使用价格相对于EMA 200的位置判断趋势,可以考虑增加趋势强度指标(如ADX或MACD),只在趋势足够强时才进行交易,避免震荡市场的假信号。
|
|||
|
|
|
|||
|
|
2. **动态风险回报比**:将固定的风险回报比替换为基于市场波动性或支撑阻力位的动态计算方法。例如,在波动性较大时设置更保守的风险回报比,在强趋势中则可以使用更激进的设置。
|
|||
|
|
|
|||
|
|
3. **增加部分获利机制**:目前策略采用全仓位进出方式,可以考虑分批获利机制,例如在达到1:1风险回报时获利一部分,剩余部分设置追踪止损以跟随趋势。
|
|||
|
|
|
|||
|
|
4. **整合交易量确认**:将交易量指标整合到入场条件中,要求信号出现时伴随明显的交易量增加,提高信号可靠性。
|
|||
|
|
|
|||
|
|
5. **时间过滤器**:添加时间过滤条件,避开已知的低流动性时段或波动较大的市场公告时段。
|
|||
|
|
|
|||
|
|
6. **参数自适应机制**:实现超级趋势参数的自适应调整,根据近期市场波动状况动态优化参数,使策略能更好地适应不同市场阶段。
|
|||
|
|
|
|||
|
|
这些优化方向的关键在于增强策略的稳健性和适应性,同时保持其核心优势——多时间框架趋势确认和精确入场。
|
|||
|
|
|
|||
|
|
#### 总结
|
|||
|
|
多时间框架趋势跟踪与超级趋势动量优化策略是一个结合了技术分析基本原则和实用风险管理的完整交易系统。通过整合1小时时间框架的趋势确认和15分钟时间框架的精确入场信号,该策略为交易者提供了一个既考虑大局又注重细节的方法论。
|
|||
|
|
|
|||
|
|
虽然这种方法并不能保证每次交易都盈利,但其设计理念——顺应主要趋势、优化入场点、固定风险回报比和明确的止损策略——体现了成熟交易系统应有的关键要素。通过前述优化方向的实施,该策略有潜力进一步提升其稳定性和适应性,使其能够在不同市场环境中保持竞争力。
|
|||
|
|
|
|||
|
|
最重要的是,该策略的核心思想反映了成功交易的基本原则:趋势确认、精确入场、风险管理和纪律执行。这些原则不仅适用于本策略,也适用于几乎所有成功的交易方法。 ||
|
|||
|
|
|
|||
|
|
#### Overview
|
|||
|
|
This strategy is a multi-timeframe trend following trading system that combines the 200 Exponential Moving Average (EMA) on the 1-hour chart for trend confirmation with the Supertrend indicator on the 15-minute chart for entry signals. This combination leverages the trend direction guidance from the higher timeframe and precise entry points from the lower timeframe, creating a complete trading system that can both capture major trends and optimize entry timing. The strategy also includes stop-loss settings based on the Supertrend indicator values and profit targets based on risk ratios, providing a clear risk management framework for each trade.
|
|||
|
|
|
|||
|
|
#### Strategy Principles
|
|||
|
|
The core principle of this strategy is to filter trading signals through multi-timeframe analysis, ensuring that trading direction aligns with the primary trend. The specific implementation is as follows:
|
|||
|
|
|
|||
|
|
1. **Trend Confirmation Mechanism (1-hour chart)**:
|
|||
|
|
- Uses the 200-period Exponential Moving Average (EMA 200) to determine overall market trend
|
|||
|
|
- When price is above EMA 200, confirms an uptrend
|
|||
|
|
- When price is below EMA 200, confirms a downtrend
|
|||
|
|
|
|||
|
|
2. **Entry Signals (15-minute chart)**:
|
|||
|
|
- Uses the Supertrend indicator to generate precise entry signals
|
|||
|
|
- When Supertrend is green (up), generates a buy signal
|
|||
|
|
- When Supertrend is red (down), generates a sell signal
|
|||
|
|
|
|||
|
|
3. **Risk Management**:
|
|||
|
|
- Stop-loss setting: Fixed at the Supertrend indicator value at entry
|
|||
|
|
- Profit target: 1.5 times the distance between entry price and stop-loss (actually 2x in the code)
|
|||
|
|
- Trade management: When a new signal is generated, the previous trade is closed, ensuring only one active trade at any time
|
|||
|
|
|
|||
|
|
Through code analysis, we can see that the strategy uses the request.security function to obtain EMA 200 data from the 1-hour timeframe and compares it with the current price to determine trend direction. At the same time, it calculates the Supertrend indicator value and its direction on the current 15-minute chart. Only when signals from both timeframes align (e.g., 1-hour uptrend + 15-minute Supertrend up) will a trade signal be triggered.
|
|||
|
|
|
|||
|
|
#### Strategy Advantages
|
|||
|
|
After in-depth code analysis, this strategy demonstrates the following significant advantages:
|
|||
|
|
|
|||
|
|
1. **More Reliable Trend Filtering**: By combining trend confirmation from two timeframes, it significantly reduces the possibility of false breakouts and counter-trend trading. The higher timeframe (1-hour) EMA 200 provides more stable trend judgment, rather than relying solely on the more volatile short-term timeframe.
|
|||
|
|
|
|||
|
|
2. **Precise Entry Timing**: The Supertrend indicator on the short-term timeframe (15-minute) provides precise entry points, allowing traders to optimize entry prices while confirming the trend, improving the cost-effectiveness of trades.
|
|||
|
|
|
|||
|
|
3. **Automated Risk Management**: The strategy incorporates a dynamic stop-loss mechanism based on market volatility; the Supertrend indicator itself considers market volatility (calculated through ATR), so the stop-loss position automatically adjusts according to market conditions.
|
|||
|
|
|
|||
|
|
4. **Proportional Profit Target Design**: By setting a fixed risk-reward ratio (2:1) profit target, the strategy ensures the possibility of long-term profitability; even with a less-than-perfect win rate, the system can potentially achieve a positive expected value.
|
|||
|
|
|
|||
|
|
5. **Avoids Trade Overlap**: The strategy ensures that existing trades are closed when generating new signals, avoiding position stacking risk and simplifying fund management and risk control.
|
|||
|
|
|
|||
|
|
#### Strategy Risks
|
|||
|
|
Despite its reasonable design, the strategy still has the following risks that need attention:
|
|||
|
|
|
|||
|
|
1. **Delayed Reaction at Trend Turning Points**: Due to the use of a long-period (200) moving average, the strategy's reaction at trend turning points will be relatively delayed, potentially leading to continued trading in the original trend direction during the early stages of market reversal, causing certain losses.
|
|||
|
|
|
|||
|
|
2. **Increased False Signals in Ranging Markets**: In sideways or oscillating markets, prices may frequently cross the EMA 200 line, while the Supertrend indicator may also frequently change direction, producing multiple false signals and leading to consecutive stop-losses.
|
|||
|
|
|
|||
|
|
3. **Limitations of Fixed Risk-Reward Ratio**: Although the strategy sets a fixed 2:1 risk-reward ratio, the optimal risk-reward ratio may vary for different markets and different periods, making a fixed setting not always the optimal choice.
|
|||
|
|
|
|||
|
|
4. **Parameter Sensitivity**: The parameters of the Supertrend indicator (ATR period and factor) have a significant impact on strategy performance; different markets may require different parameter combinations, which increases the complexity of strategy optimization.
|
|||
|
|
|
|||
|
|
5. **Liquidity Risk**: In low liquidity markets or extreme market conditions, actual stop-losses may experience slippage, resulting in actual losses exceeding expectations.
|
|||
|
|
|
|||
|
|
Solutions include: adding trend filter conditions (such as trend strength indicators), adjusting Supertrend parameters to adapt to different market conditions, setting maximum consecutive loss limits, and dynamically adjusting risk-reward ratios based on market volatility.
|
|||
|
|
|
|||
|
|
#### Strategy Optimization Directions
|
|||
|
|
Through in-depth code analysis, several potential optimization directions can be identified:
|
|||
|
|
|
|||
|
|
1. **Introduce Trend Strength Filtering**: The current strategy only uses price position relative to EMA 200 to judge trends; consider adding trend strength indicators (such as ADX or MACD), only trading when the trend is strong enough to avoid false signals in oscillating markets.
|
|||
|
|
|
|||
|
|
2. **Dynamic Risk-Reward Ratio**: Replace the fixed risk-reward ratio with a dynamic calculation method based on market volatility or support/resistance levels. For example, set a more conservative risk-reward ratio during high volatility and use more aggressive settings in strong trends.
|
|||
|
|
|
|||
|
|
3. **Add Partial Profit Mechanism**: The current strategy uses a full position entry and exit approach; consider a partial profit mechanism, such as taking profit on a portion at a 1:1 risk-reward ratio, with the remaining portion set to trailing stop-loss to follow the trend.
|
|||
|
|
|
|||
|
|
4. **Integrate Volume Confirmation**: Integrate volume indicators into entry conditions, requiring signals to be accompanied by significant volume increases to improve signal reliability.
|
|||
|
|
|
|||
|
|
5. **Time Filter**: Add time filtering conditions to avoid known low liquidity periods or highly volatile market announcement periods.
|
|||
|
|
|
|||
|
|
6. **Parameter Adaptive Mechanism**: Implement adaptive adjustment of Supertrend parameters based on recent market volatility conditions, dynamically optimizing parameters to better adapt to different market phases.
|
|||
|
|
|
|||
|
|
The key to these optimization directions is to enhance the strategy's robustness and adaptability while maintaining its core advantages—multi-timeframe trend confirmation and precise entry.
|
|||
|
|
|
|||
|
|
#### Summary
|
|||
|
|
The Multi-Timeframe Trend Following with Supertrend Momentum Optimization Strategy is a complete trading system that combines basic principles of technical analysis with practical risk management. By integrating trend confirmation from the 1-hour timeframe and precise entry signals from the 15-minute timeframe, this strategy provides traders with a methodology that considers both the big picture and details.
|
|||
|
|
|
|||
|
|
While this method cannot guarantee profit on every trade, its design philosophy—following the main trend, optimizing entry points, fixed risk-reward ratio, and clear stop-loss strategy—reflects the key elements that a mature trading system should have. Through the implementation of the aforementioned optimization directions, this strategy has the potential to further enhance its stability and adaptability, allowing it to maintain competitiveness in different market environments.
|
|||
|
|
|
|||
|
|
Most importantly, the core ideas of this strategy reflect the basic principles of successful trading: trend confirmation, precise entry, risk management, and disciplined execution. These principles apply not only to this strategy but to almost all successful trading methods.[/trans]
|
|||
|
|
|
|||
|
|
|
|||
|
|
|
|||
|
|
> Source (PineScript)
|
|||
|
|
|
|||
|
|
``` pinescript
|
|||
|
|
/*backtest
|
|||
|
|
start: 2025-01-18 19:45:00
|
|||
|
|
end: 2025-03-12 08:00:00
|
|||
|
|
period: 1h
|
|||
|
|
basePeriod: 1h
|
|||
|
|
exchanges: [{"eid":"Futures_Binance","currency":"TRUMP_USDT"}]
|
|||
|
|
*/
|
|||
|
|
|
|||
|
|
//@version=6
|
|||
|
|
strategy("1H EMA 200 + 15M Supertrend Strategy ", overlay=true, default_qty_type=strategy.percent_of_equity, default_qty_value=10)
|
|||
|
|
|
|||
|
|
// === Inputs ===
|
|||
|
|
atrPeriod = input.int(10, "ATR Length", minval=1)
|
|||
|
|
factor = input.float(3.0, "Factor", minval=0.01, step=0.01)
|
|||
|
|
|
|||
|
|
// === 1-Hour EMA (Trend Confirmation) ===
|
|||
|
|
ema200_1h = request.security(syminfo.tickerid, "60", ta.ema(close, 200), gaps=barmerge.gaps_off, lookahead=barmerge.lookahead_off)
|
|||
|
|
isAboveEMA200 = request.security(syminfo.tickerid, "60", close > ema200_1h, gaps=barmerge.gaps_off, lookahead=barmerge.lookahead_off)
|
|||
|
|
isBelowEMA200 = request.security(syminfo.tickerid, "60", close < ema200_1h, gaps=barmerge.gaps_off, lookahead=barmerge.lookahead_off)
|
|||
|
|
|
|||
|
|
// === 15-Minute Supertrend (Entry Signal) ===
|
|||
|
|
[supertrend, direction] = ta.supertrend(factor, atrPeriod)
|
|||
|
|
isUptrend = direction < 0
|
|||
|
|
isDowntrend = direction > 0
|
|||
|
|
|
|||
|
|
// === Variables to Store SL and TP ===
|
|||
|
|
var float stopLossPrice = na
|
|||
|
|
var float takeProfitPrice = na
|
|||
|
|
|
|||
|
|
// === Buy Signal ===
|
|||
|
|
buySignal = isAboveEMA200 and isUptrend
|
|||
|
|
if (buySignal and not buySignal[1]) // Ensure signal is only shown once
|
|||
|
|
if (strategy.position_size != 0) // Close previous trade if any
|
|||
|
|
strategy.close_all()
|
|||
|
|
stopLossPrice := supertrend // Set SL to Supertrend value at entry
|
|||
|
|
takeProfitPrice := close + 2 * (close - stopLossPrice) // TP = 2x SL distance
|
|||
|
|
strategy.entry("Buy", strategy.long)
|
|||
|
|
|
|||
|
|
// === Sell Signal ===
|
|||
|
|
sellSignal = isBelowEMA200 and isDowntrend
|
|||
|
|
if (sellSignal and not sellSignal[1]) // Ensure signal is only shown once
|
|||
|
|
if (strategy.position_size != 0) // Close previous trade if any
|
|||
|
|
strategy.close_all()
|
|||
|
|
stopLossPrice := supertrend // Set SL to Supertrend value at entry
|
|||
|
|
takeProfitPrice := close - 2 * (stopLossPrice - close) // TP = 2x SL distance
|
|||
|
|
strategy.entry("Sell", strategy.short)
|
|||
|
|
|
|||
|
|
// === Exit Logic ===
|
|||
|
|
if (strategy.position_size > 0) // For Buy Trades
|
|||
|
|
strategy.exit("Take Profit/Stop Loss", from_entry="Buy", stop=stopLossPrice, limit=takeProfitPrice)
|
|||
|
|
|
|||
|
|
if (strategy.position_size < 0) // For Sell Trades
|
|||
|
|
strategy.exit("Take Profit/Stop Loss", from_entry="Sell", stop=stopLossPrice, limit=takeProfitPrice)
|
|||
|
|
|
|||
|
|
// === Plotting ===
|
|||
|
|
plot(ema200_1h, title="1H EMA 200", color=color.blue, linewidth=2)
|
|||
|
|
plot(supertrend, title="Supertrend", color=color.red, linewidth=2)
|
|||
|
|
plotshape(series=buySignal and not buySignal[1], title="Buy Signal", location=location.belowbar, color=color.green, style=shape.labelup, text="BUY")
|
|||
|
|
plotshape(series=sellSignal and not sellSignal[1], title="Sell Signal", location=location.abovebar, color=color.red, style=shape.labeldown, text="SELL")
|
|||
|
|
```
|
|||
|
|
|
|||
|
|
> Detail
|
|||
|
|
|
|||
|
|
https://www.fmz.com/strategy/486561
|
|||
|
|
|
|||
|
|
> Last Modified
|
|||
|
|
|
|||
|
|
2025-03-14 09:17:57
|