172 lines
11 KiB
Markdown
172 lines
11 KiB
Markdown

|
|
||
|
|
> Name
|
||
|
|
|
||
|
|
多时间框架与200EMA过滤器的趋势跟踪策略-仅做多-Multi-Timeframe-Trend-Following-Strategy-with-200-EMA-Filter-Long-Only
|
||
|
|
|
||
|
|
> Author
|
||
|
|
|
||
|
|
ChaoZhang
|
||
|
|
|
||
|
|
> Strategy Description
|
||
|
|
|
||
|
|
|
||
|
|
|
||
|
|
[trans]
|
||
|
|
#### 概述
|
||
|
|
|
||
|
|
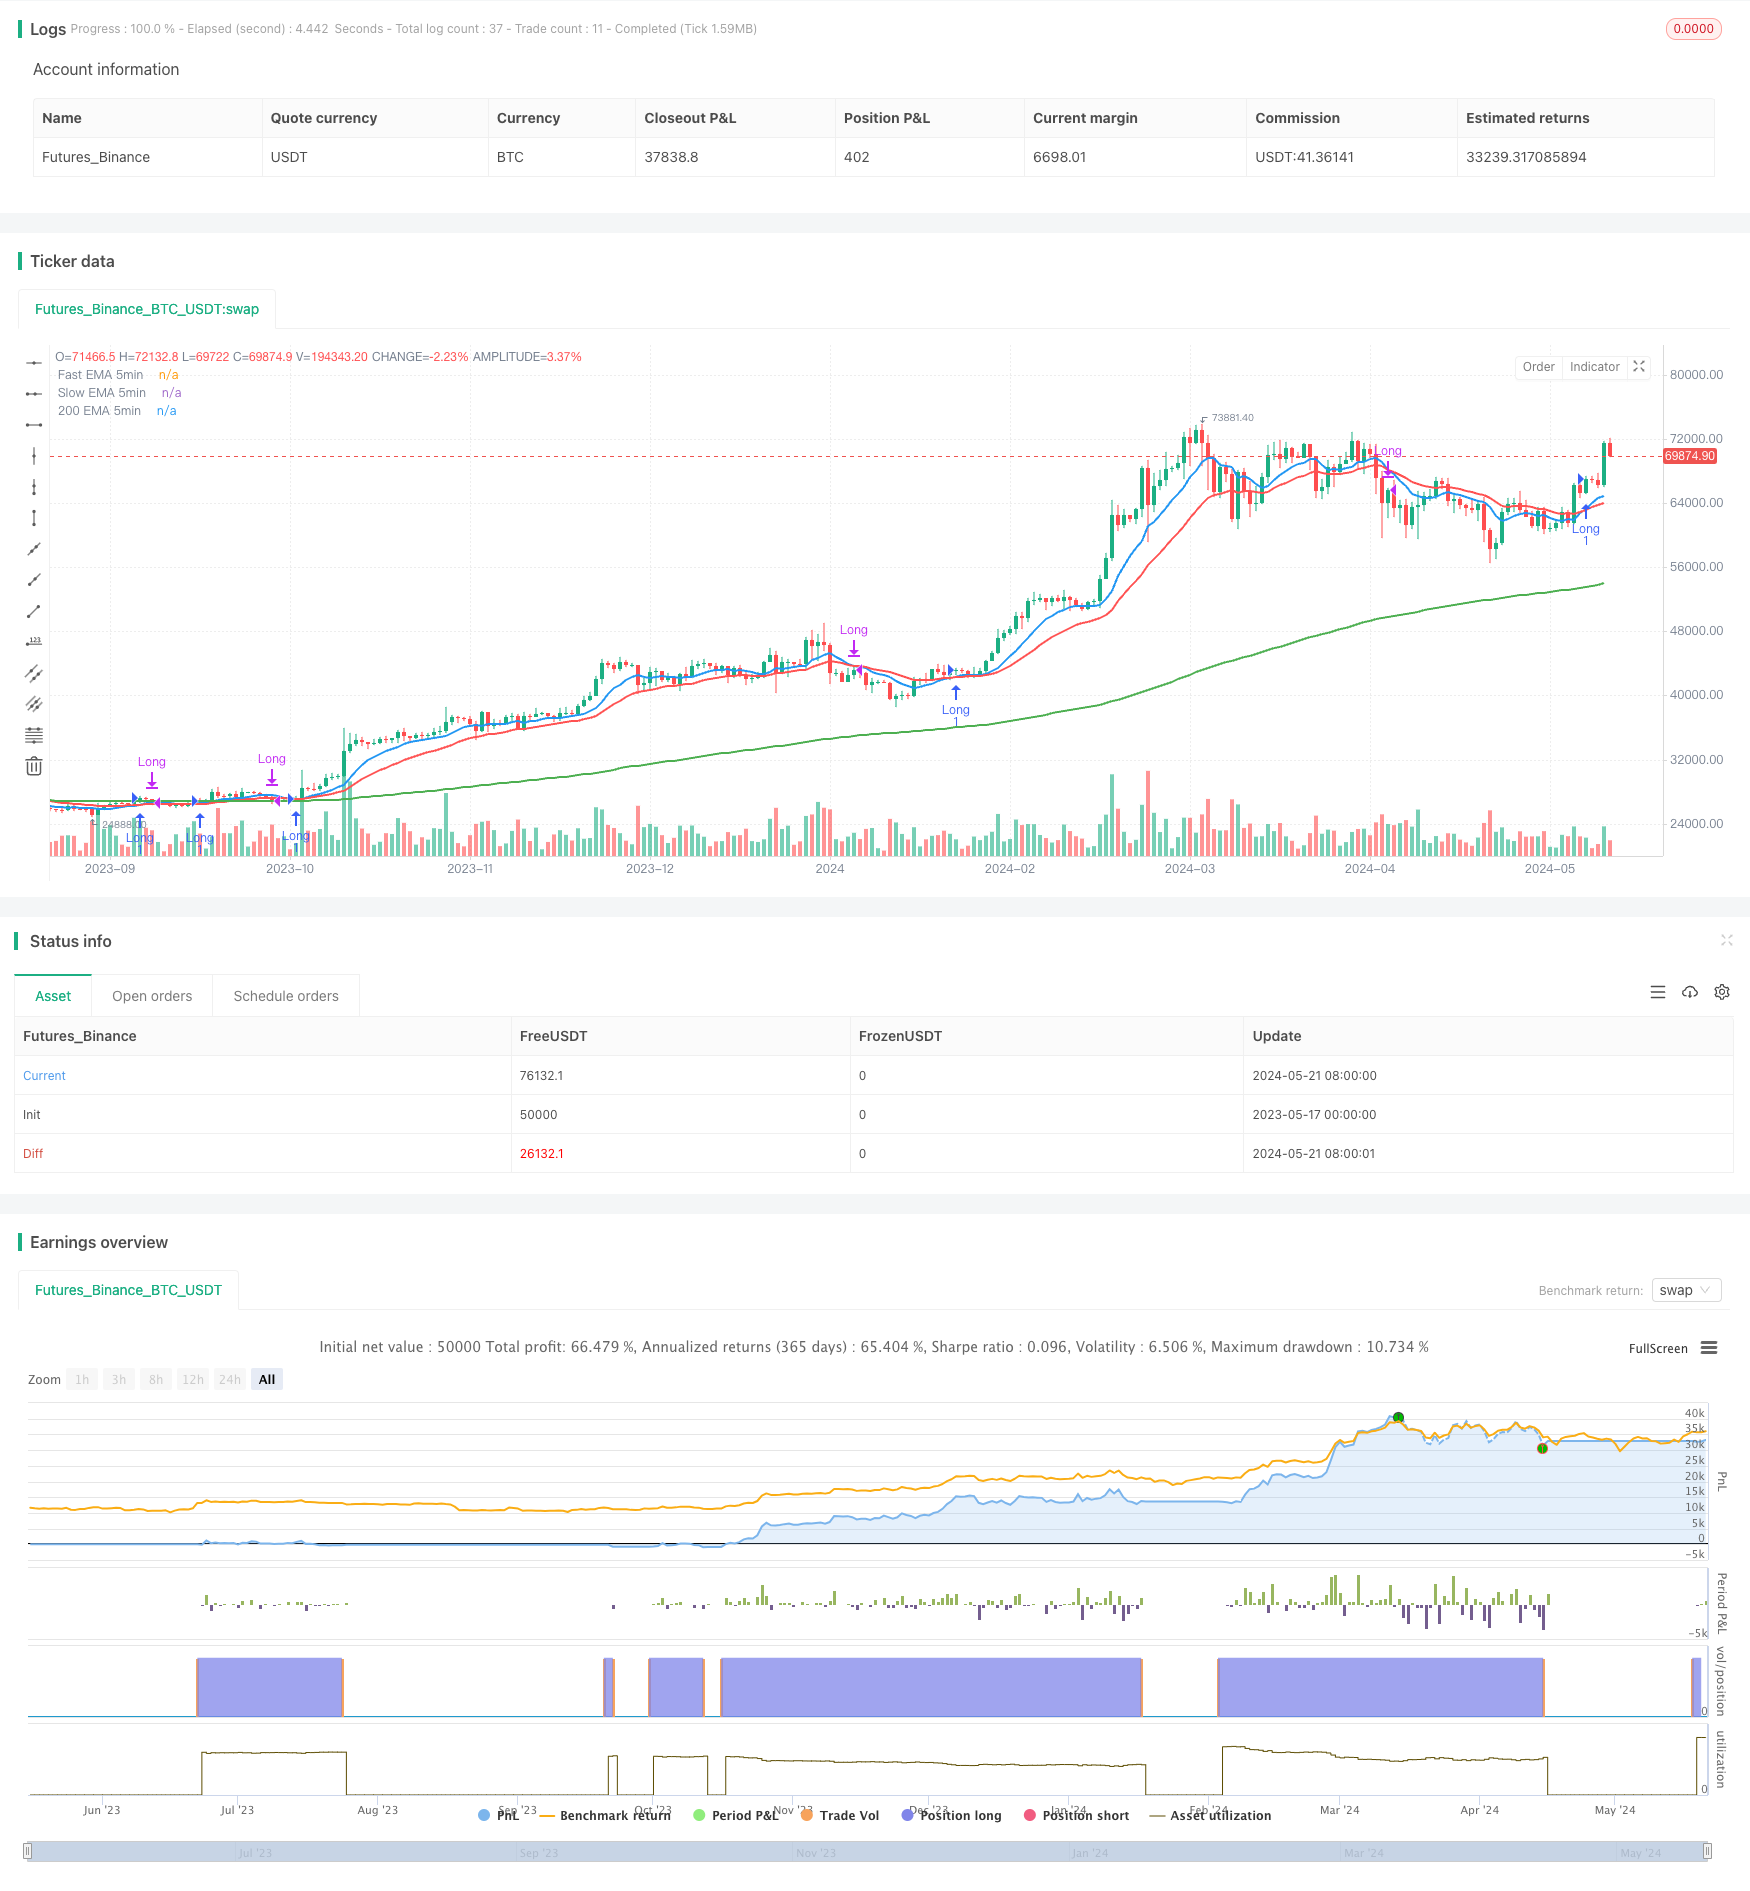
该策略是一个基于多时间框架指数移动平均线(EMA)和200期EMA过滤器的趋势跟踪策略。它的主要思路是利用不同时间框架的EMA来识别市场的趋势方向,并在趋势向上且价格在200期EMA之上时建立做多头寸。这样可以确保只在强势上涨趋势中进行交易,以把握持续的上涨行情,同时利用止损和止盈机制来控制风险。
|
||
|
|
|
||
|
|
策略使用5分钟、15分钟和30分钟三个时间框架,分别计算快速EMA和慢速EMA。通过比较每个时间框架的快速EMA和慢速EMA,可以判断该时间框架的趋势方向。然后将三个时间框架的趋势信号加总,得到一个综合的趋势信号。当综合趋势信号为3(即所有时间框架都是上涨趋势)且当前收盘价在5分钟200期EMA之上时,策略开仓做多;当综合趋势信号小于3或者价格跌破5分钟200期EMA时,策略平仓。
|
||
|
|
|
||
|
|
#### 策略原理
|
||
|
|
|
||
|
|
1. 分别计算5分钟、15分钟和30分钟时间框架的快速EMA(默认9期)和慢速EMA(默认21期)。
|
||
|
|
2. 在5分钟时间框架上计算200期EMA,作为趋势过滤器。
|
||
|
|
3. 对每个时间框架,比较快速EMA和慢速EMA的大小,快速在上为上涨趋势(+1),慢速在上为下跌趋势(-1)。
|
||
|
|
4. 将三个时间框架的趋势信号相加,得到一个区间在[-3, 3]的综合趋势信号。
|
||
|
|
5. 当综合趋势信号等于3(强势上涨)且当前收盘价在5分钟200期EMA之上时,开仓做多。
|
||
|
|
6. 当综合趋势信号小于3(上涨趋势减弱)或者价格跌破5分钟200期EMA时,平仓。
|
||
|
|
7. 开仓时,止损设在开仓价下方1%,止盈设在开仓价上方3%。
|
||
|
|
|
||
|
|
#### 优势分析
|
||
|
|
|
||
|
|
1. 利用多个时间框架的趋势信号,可以更全面地判断市场趋势,减少假信号。
|
||
|
|
2. 200期EMA过滤器能够确保只在强势上涨趋势中交易,提高成功率。
|
||
|
|
3. 严格的开平仓条件和止损止盈,有助于控制风险,提高风险收益比。
|
||
|
|
4. 参数可调,适用于不同市场和交易风格。
|
||
|
|
|
||
|
|
#### 风险分析
|
||
|
|
|
||
|
|
1. 在趋势转折点反应可能较慢,错失最佳建仓时机。
|
||
|
|
2. 频繁开平仓可能增加交易成本。
|
||
|
|
3. 止损位置固定,在波动较大的行情中可能会被提前止损出场。
|
||
|
|
4. 趋势判断基于历史数据,对于突发事件引起的价格波动可能反应不及时。
|
||
|
|
|
||
|
|
#### 优化方向
|
||
|
|
|
||
|
|
1. 引入更多时间框架或者优化现有时间框架的选择,提高趋势判断的准确性和及时性。
|
||
|
|
2. 对止损和止盈位置进行优化,例如引入追踪止损或者动态止盈,以适应不同的市场状况。
|
||
|
|
3. 在趋势信号之外,引入其他信号如成交量、动量等,形成多因子开平仓条件,提高策略稳健性。
|
||
|
|
4. 对参数进行优化,找到最适合当前市场的参数组合。
|
||
|
|
5. 考虑加入做空机制,扩大适用范围。
|
||
|
|
|
||
|
|
#### 总结
|
||
|
|
|
||
|
|
该策略通过多个时间框架的EMA比较来判断趋势方向,同时使用200期EMA作为趋势过滤器,在趋势明确向上且价格在长期均线之上时建立做多头寸,以把握强势上涨行情。严格的开平仓条件和固定止损止盈有助于控制风险。但是该策略在趋势转折点的反应可能较慢,且止损止盈位置固定,在应对市场突发波动时具有局限性。
|
||
|
|
未来可以通过引入更多时间框架、优化止损止盈、加入更多交易信号、参数优化等方式来提升策略的适应性和稳健性,使其能够更好地把握市场机会并控制风险。
|
||
|
|
|
||
|
|
||
|
||
|
|
|
||
|
|
#### Overview
|
||
|
|
|
||
|
|
This strategy is a trend-following strategy based on multi-timeframe Exponential Moving Averages (EMAs) and a 200-period EMA filter. The main idea is to use EMAs on different timeframes to identify the market trend direction and establish long positions when the trend is up and the price is above the 200-period EMA. This ensures that trades are only entered during strong uptrends, aiming to capture sustained upward movements while managing risk with defined stop-loss and take-profit mechanisms.
|
||
|
|
|
||
|
|
The strategy uses three timeframes: 5-minute, 15-minute, and 30-minute, calculating fast and slow EMAs for each. By comparing the fast and slow EMAs for each timeframe, the trend direction can be determined. The trend signals from the three timeframes are then summed to obtain a combined trend signal. When the combined trend signal is 3 (indicating an uptrend across all timeframes) and the current closing price is above the 200-period EMA on the 5-minute timeframe, the strategy enters a long position. The position is closed when the combined trend signal falls below 3 or the price drops below the 5-minute 200-period EMA.
|
||
|
|
|
||
|
|
#### Strategy Principles
|
||
|
|
|
||
|
|
1. Calculate the fast EMA (default 9 periods) and slow EMA (default 21 periods) for the 5-minute, 15-minute, and 30-minute timeframes.
|
||
|
|
2. Calculate the 200-period EMA on the 5-minute timeframe as a trend filter.
|
||
|
|
3. For each timeframe, compare the fast and slow EMAs. Fast above slow indicates an uptrend (+1), slow above fast indicates a downtrend (-1).
|
||
|
|
4. Sum the trend signals from the three timeframes to obtain a combined trend signal in the range [-3, 3].
|
||
|
|
5. Enter a long position when the combined trend signal equals 3 (strong uptrend) and the current closing price is above the 5-minute 200-period EMA.
|
||
|
|
6. Close the position when the combined trend signal falls below 3 (weakening uptrend) or the price drops below the 5-minute 200-period EMA.
|
||
|
|
7. Set the stop-loss 1% below the entry price and the take-profit 3% above the entry price.
|
||
|
|
|
||
|
|
#### Advantages
|
||
|
|
|
||
|
|
1. By utilizing trend signals from multiple timeframes, the strategy can more comprehensively assess the market trend and reduce false signals.
|
||
|
|
2. The 200-period EMA filter ensures that trades are only entered during strong uptrends, increasing the success rate.
|
||
|
|
3. Strict entry and exit conditions, along with stop-loss and take-profit, help control risk and improve the risk-reward ratio.
|
||
|
|
4. Adjustable parameters make the strategy adaptable to different markets and trading styles.
|
||
|
|
|
||
|
|
#### Risks
|
||
|
|
|
||
|
|
1. The strategy may react slowly at trend turning points, missing optimal entry opportunities.
|
||
|
|
2. Frequent entries and exits may increase trading costs.
|
||
|
|
3. Fixed stop-loss levels may lead to premature exits in highly volatile markets.
|
||
|
|
4. Trend determination is based on historical data and may not react promptly to sudden price movements caused by unexpected events.
|
||
|
|
|
||
|
|
#### Optimization Directions
|
||
|
|
|
||
|
|
1. Introduce more timeframes or optimize the selection of existing timeframes to improve the accuracy and timeliness of trend identification.
|
||
|
|
2. Optimize stop-loss and take-profit levels, such as implementing trailing stops or dynamic take-profits, to adapt to different market conditions.
|
||
|
|
3. Incorporate additional signals like volume, momentum, etc., alongside trend signals to form multi-factor entry and exit conditions, enhancing the strategy's robustness.
|
||
|
|
4. Optimize parameters to find the most suitable combination for the current market.
|
||
|
|
5. Consider adding a short-selling mechanism to expand the strategy's applicability.
|
||
|
|
|
||
|
|
#### Summary
|
||
|
|
|
||
|
|
This strategy determines the trend direction by comparing EMAs on multiple timeframes while using a 200-period EMA as a trend filter. It establishes long positions when the trend is clearly upward and the price is above the long-term moving average, aiming to capture strong uptrends. Strict entry and exit conditions and fixed stop-loss and take-profit levels help manage risk. However, the strategy may react slowly at trend turning points and has limitations in dealing with sudden market volatility due to fixed stop-loss and take-profit levels.
|
||
|
|
In the future, the strategy's adaptability and robustness can be improved by introducing more timeframes, optimizing stop-loss and take-profit levels, incorporating additional trading signals, optimizing parameters, etc. This will enable the strategy to better seize market opportunities while controlling risks.
|
||
|
|
[/trans]
|
||
|
|
|
||
|
|
|
||
|
|
|
||
|
|
> Source (PineScript)
|
||
|
|
|
||
|
|
``` pinescript
|
||
|
|
/*backtest
|
||
|
|
start: 2023-05-17 00:00:00
|
||
|
|
end: 2024-05-22 00:00:00
|
||
|
|
period: 1d
|
||
|
|
basePeriod: 1h
|
||
|
|
exchanges: [{"eid":"Futures_Binance","currency":"BTC_USDT"}]
|
||
|
|
*/
|
||
|
|
|
||
|
|
//@version=5
|
||
|
|
strategy("Multi-Timeframe Trend Following with 200 EMA Filter - Longs Only", shorttitle="MTF_TF_200EMA_Longs", overlay=true, initial_capital=1000, default_qty_type=strategy.fixed, default_qty_value=1)
|
||
|
|
|
||
|
|
// Inputs
|
||
|
|
fast_length = input.int(9, title="Fast EMA Length", minval=1)
|
||
|
|
slow_length = input.int(21, title="Slow EMA Length", minval=1)
|
||
|
|
filter_length_200 = input.int(200, title="200 EMA Length", minval=1)
|
||
|
|
stop_loss_perc = input.float(1.0, title="Stop Loss Percentage", minval=0.1) / 100
|
||
|
|
take_profit_perc = input.float(3.0, title="Take Profit Percentage", minval=0.1) / 100
|
||
|
|
|
||
|
|
// Calculate EMAs for 5-minute, 15-minute, and 30-minute timeframes
|
||
|
|
ema_fast_5min = request.security(syminfo.tickerid, "5", ta.ema(close, fast_length), lookahead=barmerge.lookahead_on)
|
||
|
|
ema_slow_5min = request.security(syminfo.tickerid, "5", ta.ema(close, slow_length), lookahead=barmerge.lookahead_on)
|
||
|
|
|
||
|
|
ema_fast_15min = request.security(syminfo.tickerid, "15", ta.ema(close, fast_length), lookahead=barmerge.lookahead_on)
|
||
|
|
ema_slow_15min = request.security(syminfo.tickerid, "15", ta.ema(close, slow_length), lookahead=barmerge.lookahead_on)
|
||
|
|
|
||
|
|
ema_fast_30min = request.security(syminfo.tickerid, "30", ta.ema(close, fast_length), lookahead=barmerge.lookahead_on)
|
||
|
|
ema_slow_30min = request.security(syminfo.tickerid, "30", ta.ema(close, slow_length), lookahead=barmerge.lookahead_on)
|
||
|
|
|
||
|
|
// Calculate 200 EMA for the 5-minute timeframe
|
||
|
|
ema_200_5min = ta.ema(close, filter_length_200)
|
||
|
|
|
||
|
|
// Determine the trend for each timeframe
|
||
|
|
trend_5min = ema_fast_5min > ema_slow_5min ? 1 : -1
|
||
|
|
trend_15min = ema_fast_15min > ema_slow_15min ? 1 : -1
|
||
|
|
trend_30min = ema_fast_30min > ema_slow_30min ? 1 : -1
|
||
|
|
|
||
|
|
// Combine trend signals
|
||
|
|
combined_trend = trend_5min + trend_15min + trend_30min
|
||
|
|
|
||
|
|
// Define entry and exit conditions with 200 EMA filter
|
||
|
|
enter_long = combined_trend == 3 and close > ema_200_5min
|
||
|
|
exit_long = combined_trend < 3 or close < ema_200_5min
|
||
|
|
|
||
|
|
// Plot EMAs for the 5-minute timeframe
|
||
|
|
plot(ema_fast_5min, color=color.blue, linewidth=2, title="Fast EMA 5min")
|
||
|
|
plot(ema_slow_5min, color=color.red, linewidth=2, title="Slow EMA 5min")
|
||
|
|
plot(ema_200_5min, color=color.green, linewidth=2, title="200 EMA 5min")
|
||
|
|
|
||
|
|
// Strategy execution
|
||
|
|
if (enter_long)
|
||
|
|
strategy.entry("Long", strategy.long, stop=close * (1 - stop_loss_perc), limit=close * (1 + take_profit_perc))
|
||
|
|
if (exit_long)
|
||
|
|
strategy.close("Long")
|
||
|
|
|
||
|
|
```
|
||
|
|
|
||
|
|
> Detail
|
||
|
|
|
||
|
|
https://www.fmz.com/strategy/452279
|
||
|
|
|
||
|
|
> Last Modified
|
||
|
|
|
||
|
|
2024-05-23 18:07:50
|