167 lines
9.3 KiB
Markdown
167 lines
9.3 KiB
Markdown

|
|
||
|
|
> Name
|
||
|
|
|
||
|
|
多指标趋势追踪策略结合布林带和-ATR-动态止损-Multi-Indicator-Trend-Following-Strategy-with-Bollinger-Bands-and-ATR-Dynamic-Stop-Loss
|
||
|
|
|
||
|
|
> Author
|
||
|
|
|
||
|
|
ChaoZhang
|
||
|
|
|
||
|
|
> Strategy Description
|
||
|
|
|
||
|
|
|
||
|
|
|
||
|
|
[trans]
|
||
|
|
#### 概述
|
||
|
|
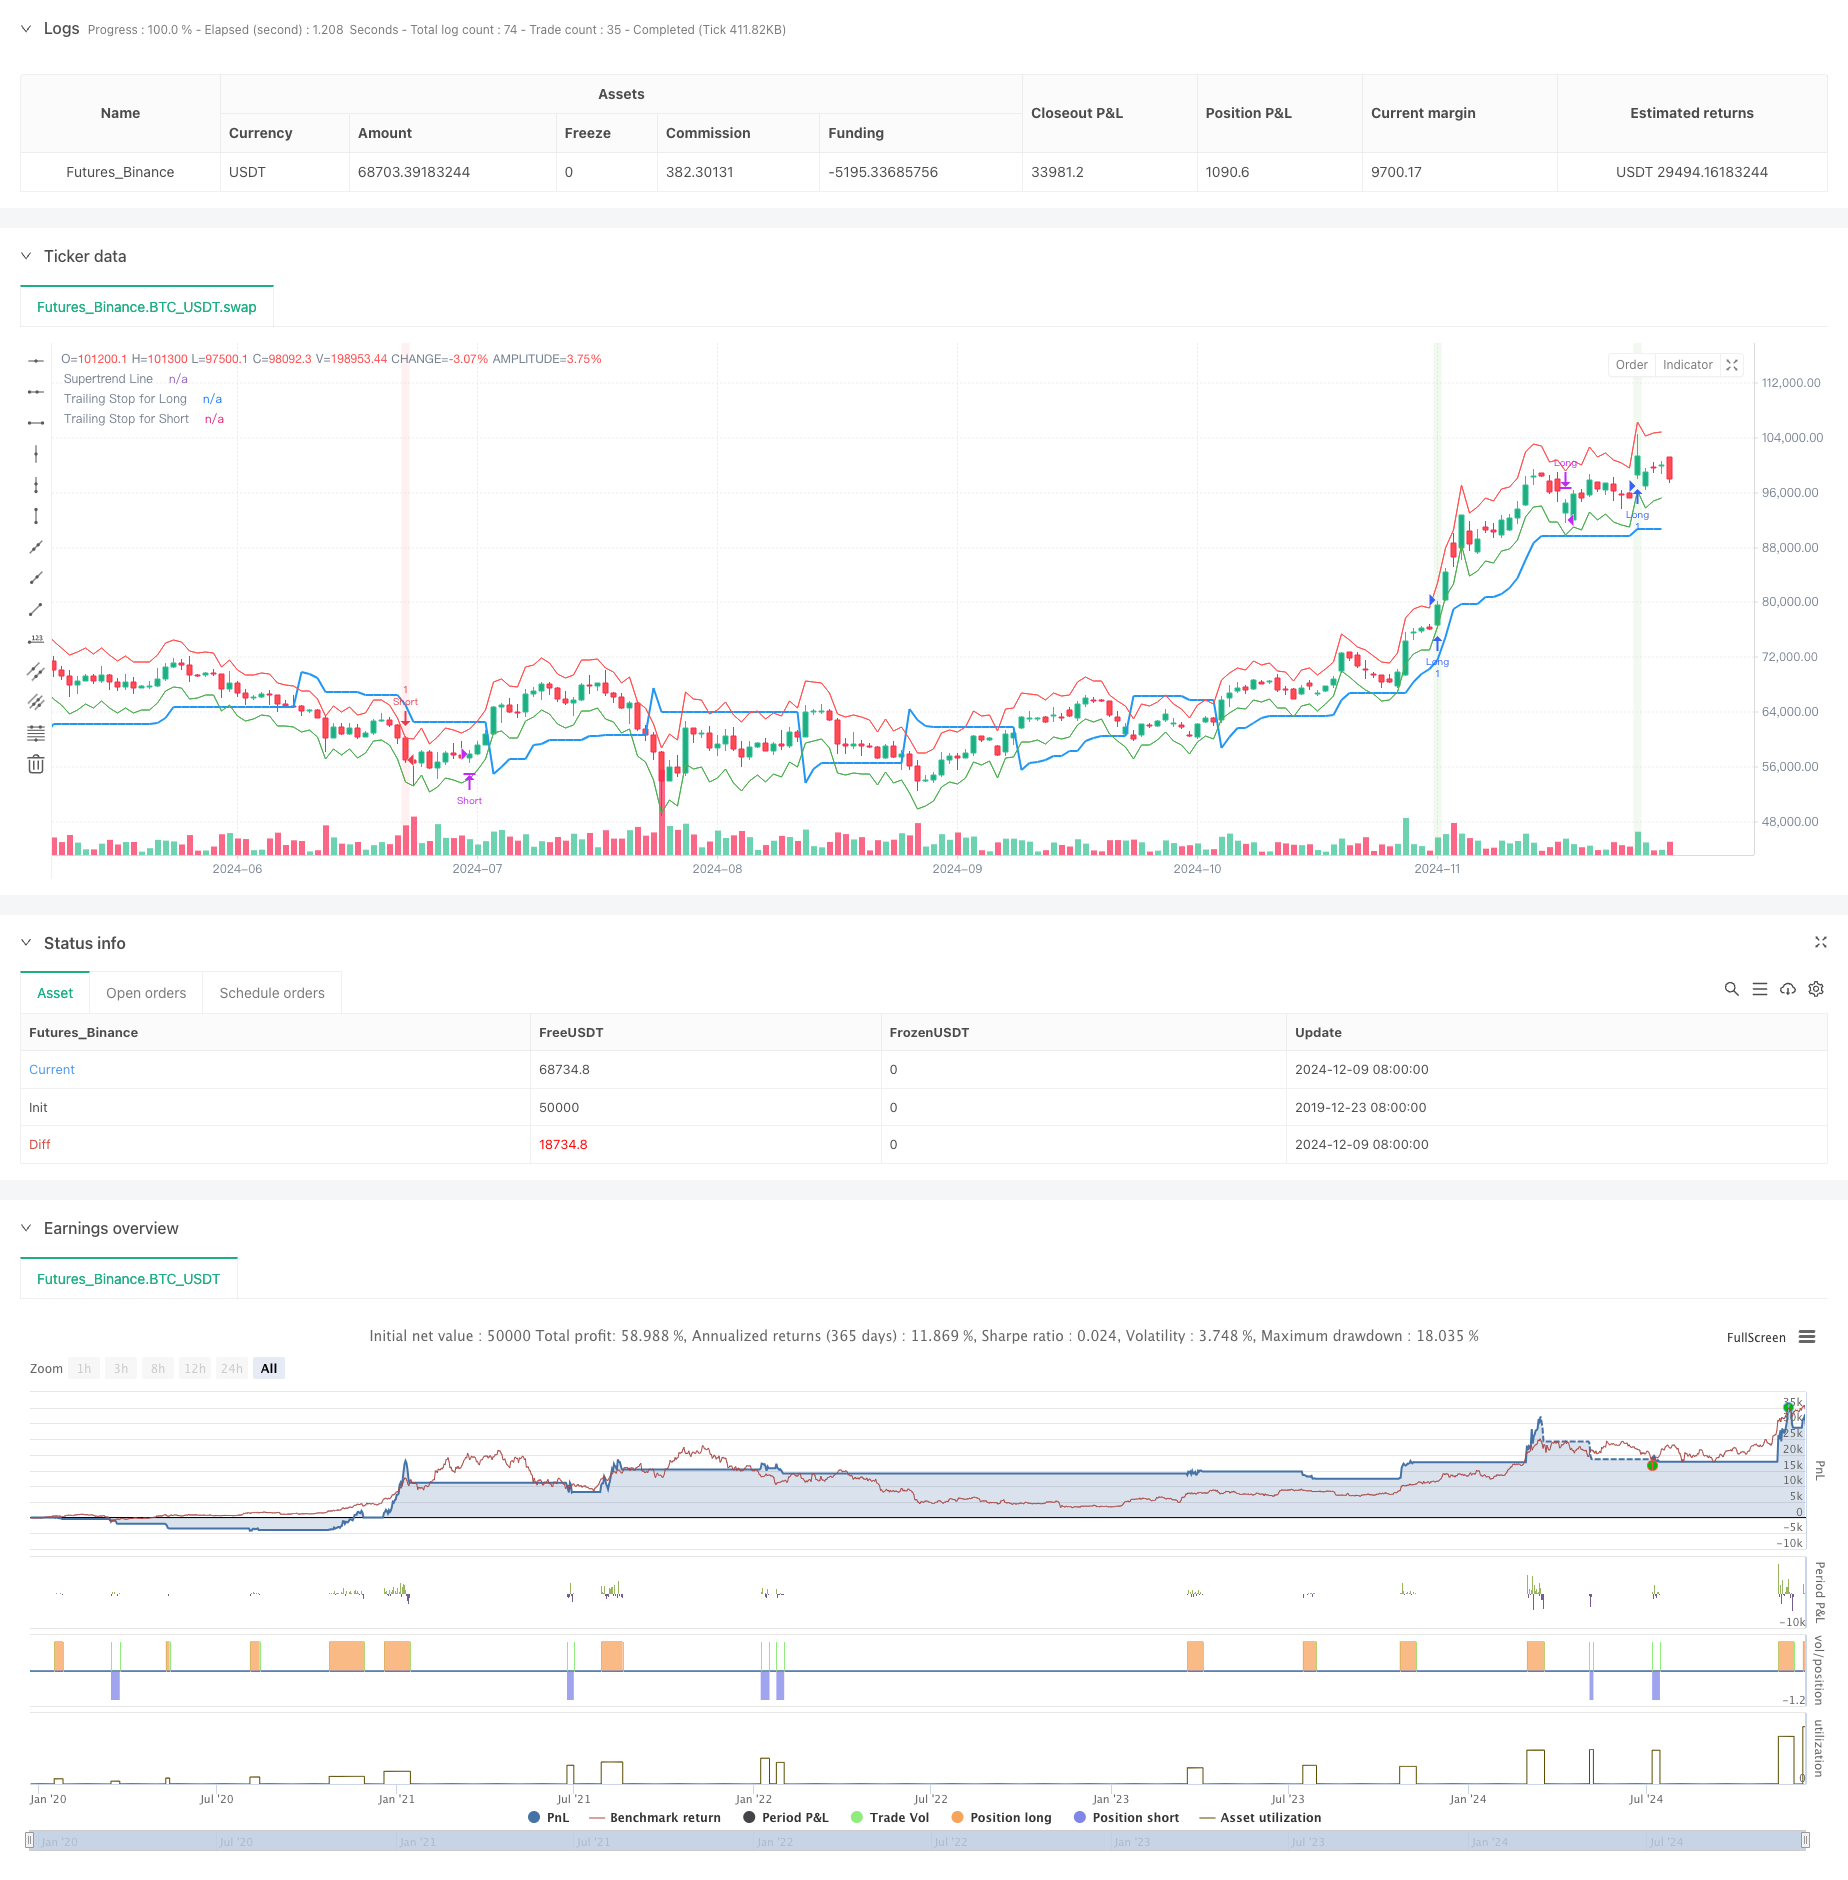
该策略是一个基于多技术指标的趋势追踪交易系统,结合了布林带、趋势指标、动量指标和波动率指标,通过量价配合来进行交易决策。策略采用布林带突破作为主要入场信号,同时结合 ADX 趋势强度确认和成交量突破验证,使用 MACD 和 ATR trailing stop 作为出场机制。
|
||
|
|
|
||
|
|
#### 策略原理
|
||
|
|
策略的核心逻辑基于以下几个方面:
|
||
|
|
1. 使用布林带(Bollinger Bands)作为价格波动区间的参考,当价格突破上轨时寻找做多机会,突破下轨时寻找做空机会
|
||
|
|
2. 通过 ADX 指标判断趋势强度,只有在趋势足够强(ADX>25)时才开仓
|
||
|
|
3. 要求成交量出现放量(高于20日均量1.5倍)确认价格突破的有效性
|
||
|
|
4. 使用 SuperTrend 指标作为趋势方向过滤,只在价格在趋势线正确一侧时开仓
|
||
|
|
5. 采用 MACD 死叉、ATR 移动止损或 ADX 转弱作为离场条件
|
||
|
|
|
||
|
|
#### 策略优势
|
||
|
|
1. 多重信号配合提高了交易的准确性,有效降低了虚假突破带来的风险
|
||
|
|
2. 通过 ADX 和成交量确认,提高了趋势交易的胜率
|
||
|
|
3. 动态止损机制(ATR trailing stop)能够在保护利润的同时给趋势以足够发展空间
|
||
|
|
4. 结合了趋势跟踪和反转策略的优点,既能捕捉大趋势,又不会错过重要反转机会
|
||
|
|
5. 具有完善的风险控制机制,包括趋势强度确认、量价配合和动态止损
|
||
|
|
|
||
|
|
#### 策略风险
|
||
|
|
1. 在震荡市场中可能产生频繁的虚假信号,导致连续止损
|
||
|
|
2. 多重条件叠加可能导致错过一些重要的交易机会
|
||
|
|
3. ATR 止损在波动率突然放大时可能会过早止损
|
||
|
|
4. 依赖趋势的持续性,在趋势突然反转时可能会有较大回撤
|
||
|
|
5. 需要较大的样本量来验证策略的有效性
|
||
|
|
|
||
|
|
#### 策略优化方向
|
||
|
|
1. 考虑加入市场环境判断机制,在不同市场条件下使用不同的参数组合
|
||
|
|
2. 可以引入时间过滤,避开一些已知的高波动时段
|
||
|
|
3. 对止损参数进行优化,在不同波动率环境下动态调整 ATR 乘数
|
||
|
|
4. 增加对成交量的分析深度,考虑成交量的质量而不仅仅是数量
|
||
|
|
5. 可以考虑加入更多的市场情绪指标来提高信号的可靠性
|
||
|
|
|
||
|
|
#### 总结
|
||
|
|
这是一个设计完善的多指标趋势追踪策略,通过布林带、ADX、SuperTrend、MACD 等指标的有机结合,构建了一个兼具趋势跟踪和风险控制的交易系统。策略的优势在于多重信号确认和完善的风险控制机制,但同时也面临着过度优化和参数敏感性的挑战。通过持续优化和市场环境的动态适应,该策略有望在不同市场环境下都能保持稳定的表现。 ||
|
||
|
|
|
||
|
|
#### Overview
|
||
|
|
This strategy is a multi-technical indicator trend following trading system that combines Bollinger Bands, trend indicators, momentum indicators, and volatility indicators, making trading decisions through price-volume analysis. The strategy uses Bollinger Bands breakout as the primary entry signal, combined with ADX trend strength confirmation and volume breakthrough verification, using MACD and ATR trailing stop as exit mechanisms.
|
||
|
|
|
||
|
|
#### Strategy Principles
|
||
|
|
The core logic of the strategy is based on the following aspects:
|
||
|
|
1. Using Bollinger Bands as a reference for price volatility range, looking for long opportunities when price breaks above the upper band and short opportunities when it breaks below the lower band
|
||
|
|
2. Using the ADX indicator to judge trend strength, only opening positions when the trend is strong enough (ADX>25)
|
||
|
|
3. Requiring volume surge (1.5 times above 20-day average volume) to confirm price breakout validity
|
||
|
|
4. Using SuperTrend indicator as trend direction filter, only entering positions when price is on the correct side of the trend line
|
||
|
|
5. Using MACD death cross, ATR trailing stop, or ADX weakening as exit conditions
|
||
|
|
|
||
|
|
#### Strategy Advantages
|
||
|
|
1. Multiple signal combinations improve trading accuracy and effectively reduce risks from false breakouts
|
||
|
|
2. ADX and volume confirmation improve the win rate of trend trading
|
||
|
|
3. Dynamic stop loss mechanism (ATR trailing stop) protects profits while giving trends enough room to develop
|
||
|
|
4. Combines advantages of trend following and reversal strategies, capturing major trends without missing important reversal opportunities
|
||
|
|
5. Has comprehensive risk control mechanisms, including trend strength confirmation, price-volume correlation, and dynamic stop loss
|
||
|
|
|
||
|
|
#### Strategy Risks
|
||
|
|
1. May generate frequent false signals in oscillating markets, leading to consecutive stop losses
|
||
|
|
2. Multiple conditions stacking may cause missing some important trading opportunities
|
||
|
|
3. ATR stops may trigger too early when volatility suddenly increases
|
||
|
|
4. Depends on trend continuity, may experience significant drawdowns during sudden trend reversals
|
||
|
|
5. Requires large sample size to verify strategy effectiveness
|
||
|
|
|
||
|
|
#### Strategy Optimization Directions
|
||
|
|
1. Consider adding market environment judgment mechanism, using different parameter combinations under different market conditions
|
||
|
|
2. Can introduce time filtering to avoid known high volatility periods
|
||
|
|
3. Optimize stop loss parameters, dynamically adjust ATR multiplier in different volatility environments
|
||
|
|
4. Increase depth of volume analysis, considering volume quality rather than just quantity
|
||
|
|
5. Consider adding more market sentiment indicators to improve signal reliability
|
||
|
|
|
||
|
|
#### Summary
|
||
|
|
This is a well-designed multi-indicator trend following strategy that constructs a trading system combining trend following and risk control through organic integration of Bollinger Bands, ADX, SuperTrend, MACD, and other indicators. The strategy's advantages lie in multiple signal confirmation and comprehensive risk control mechanisms, but it also faces challenges of over-optimization and parameter sensitivity. Through continuous optimization and dynamic adaptation to market environment, this strategy has the potential to maintain stable performance across different market conditions.[/trans]
|
||
|
|
|
||
|
|
|
||
|
|
|
||
|
|
> Source (PineScript)
|
||
|
|
|
||
|
|
``` pinescript
|
||
|
|
/*backtest
|
||
|
|
start: 2019-12-23 08:00:00
|
||
|
|
end: 2024-12-10 08:00:00
|
||
|
|
period: 1d
|
||
|
|
basePeriod: 1d
|
||
|
|
exchanges: [{"eid":"Futures_Binance","currency":"BTC_USDT"}]
|
||
|
|
*/
|
||
|
|
|
||
|
|
//@version=5
|
||
|
|
strategy("Nifty Options Trendy Markets with TSL", overlay=true)
|
||
|
|
// Input Parameters
|
||
|
|
lengthBB = input(20, title="Bollinger Bands Length")
|
||
|
|
multBB = input(2.0, title="Bollinger Bands Multiplier")
|
||
|
|
adxLength = input(14, title="ADX Length")
|
||
|
|
adxThreshold = input(25, title="ADX Entry Threshold")
|
||
|
|
adxExitThreshold = input(20, title="ADX Exit Threshold")
|
||
|
|
superTrendLength = input(10, title="Supertrend Length")
|
||
|
|
superTrendMultiplier = input(3.0, title="Supertrend Multiplier")
|
||
|
|
macdFast = input(12, title="MACD Fast Length")
|
||
|
|
macdSlow = input(26, title="MACD Slow Length")
|
||
|
|
macdSignal = input(9, title="MACD Signal Length")
|
||
|
|
atrLength = input(14, title="ATR Length")
|
||
|
|
atrMultiplier = input(1.5, title="Trailing Stop ATR Multiplier")
|
||
|
|
volumeSpikeMultiplier = input(1.5, title="Volume Spike Multiplier")
|
||
|
|
|
||
|
|
// Calculations
|
||
|
|
[macdLine, signalLine,_ ] = ta.macd(close, macdFast, macdSlow, macdSignal)
|
||
|
|
macdCrossover = ta.crossover(macdLine, signalLine)
|
||
|
|
macdCrossunder = ta.crossunder(macdLine, signalLine)
|
||
|
|
[middleBB,upperBB,lowerBB] = ta.bb(close, lengthBB, multBB)
|
||
|
|
[supertrend, direction] = ta.supertrend(superTrendMultiplier,superTrendLength)
|
||
|
|
len = input.int(17, minval=1, title="DI Length")
|
||
|
|
lensig = input.int(14, title="ADX Smoothing", minval=1, maxval=50)
|
||
|
|
[diplus, diminus, adx] = ta.dmi(len, lensig)
|
||
|
|
atr = ta.atr(atrLength)
|
||
|
|
trailingStopLong = close - atr * atrMultiplier // For long trades
|
||
|
|
trailingStopShort = close + atr * atrMultiplier // For short trades
|
||
|
|
volumeSpike = volume > ta.sma(volume, 20) * volumeSpikeMultiplier
|
||
|
|
|
||
|
|
// Entry Conditions
|
||
|
|
longEntry = ta.crossover(close, upperBB) and adx > adxThreshold and volumeSpike and close > supertrend
|
||
|
|
shortEntry = ta.crossunder(close, lowerBB) and adx > adxThreshold and volumeSpike and close < supertrend
|
||
|
|
|
||
|
|
// Exit Conditions
|
||
|
|
longExit = ta.crossunder(macdLine, signalLine) or close < trailingStopLong or adx < adxExitThreshold
|
||
|
|
shortExit = ta.crossover(macdLine, signalLine) or close > trailingStopShort or adx < adxExitThreshold
|
||
|
|
|
||
|
|
// Strategy Entries and Exits
|
||
|
|
if (longEntry)
|
||
|
|
strategy.entry("Long", strategy.long)
|
||
|
|
if (shortEntry)
|
||
|
|
strategy.entry("Short", strategy.short)
|
||
|
|
if (longExit)
|
||
|
|
strategy.close("Long")
|
||
|
|
if (shortExit)
|
||
|
|
strategy.close("Short")
|
||
|
|
|
||
|
|
// Plotting
|
||
|
|
plot(supertrend, color=color.blue, style=plot.style_line, linewidth=2, title="Supertrend Line")
|
||
|
|
plot(trailingStopLong, title="Trailing Stop for Long", color=color.green, style=plot.style_line)
|
||
|
|
plot(trailingStopShort, title="Trailing Stop for Short", color=color.red, style=plot.style_line)
|
||
|
|
bgcolor(longEntry ? color.new(color.green, 90) : shortEntry ? color.new(color.red, 90) : na, title="Background for Entry")
|
||
|
|
|
||
|
|
// Alerts
|
||
|
|
alertcondition(longEntry, title="Long Entry", message="Buy Call: Long entry conditions met")
|
||
|
|
alertcondition(shortEntry, title="Short Entry", message="Buy Put: Short entry conditions met")
|
||
|
|
alertcondition(longExit, title="Long Exit", message="Exit Call: Long exit conditions met")
|
||
|
|
alertcondition(shortExit, title="Short Exit", message="Exit Put: Short exit conditions met")
|
||
|
|
```
|
||
|
|
|
||
|
|
> Detail
|
||
|
|
|
||
|
|
https://www.fmz.com/strategy/474868
|
||
|
|
|
||
|
|
> Last Modified
|
||
|
|
|
||
|
|
2024-12-12 16:08:45
|