203 lines
8.9 KiB
Markdown
203 lines
8.9 KiB
Markdown

|
|
||
|
|
> Name
|
||
|
|
|
||
|
|
多指标趋势跟踪与区间交易相结合的自适应策略-Adaptive-Multi-Indicator-Strategy-Combining-Trend-Following-and-Range-Trading
|
||
|
|
|
||
|
|
> Author
|
||
|
|
|
||
|
|
ianzeng123
|
||
|
|
|
||
|
|
> Strategy Description
|
||
|
|
|
||
|
|
|
||
|
|
|
||
|
|
|
||
|
|
|
||
|
|
|
||
|
|
|
||
|
|
[trans]
|
||
|
|
#### 概述
|
||
|
|
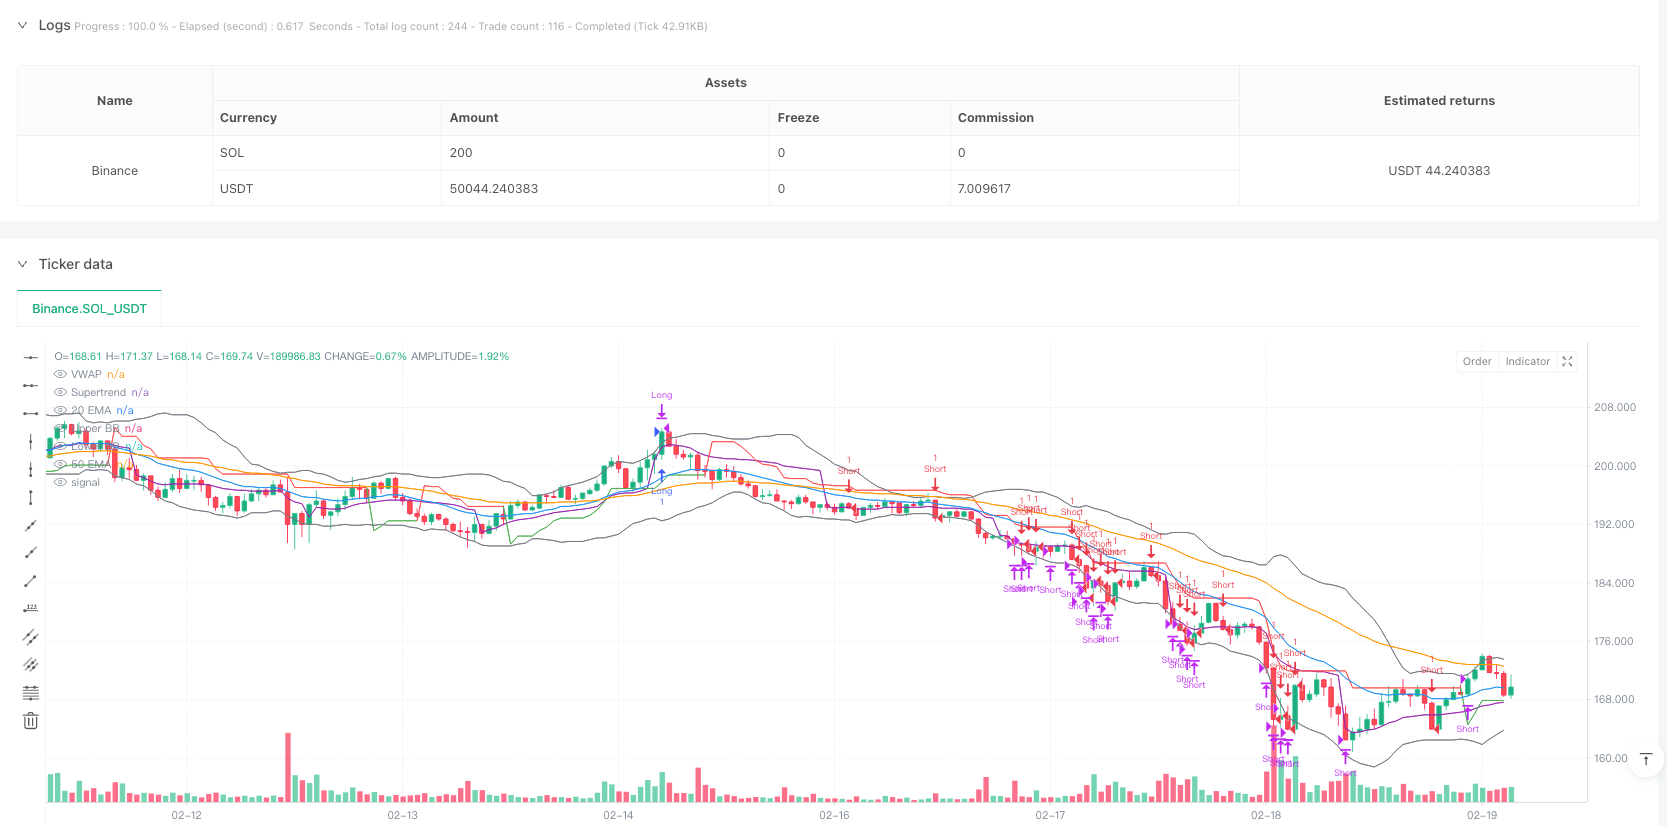
该策略是一个结合了趋势跟踪和区间交易的自适应交易系统。它通过多个技术指标的协同配合,在不同的市场环境下灵活切换交易模式。策略使用Supertrend、移动均线、ADX、RSI和布林带等指标来识别市场状态并确定交易信号,同时结合VWAP进行价格参考,并设置了止损机制来控制风险。
|
||
|
|
|
||
|
|
#### 策略原理
|
||
|
|
策略的核心逻辑分为两个部分:趋势跟踪和区间交易。在趋势市场中(由ADX>25判定),策略依据Supertrend方向、EMA交叉和VWAP位置产生信号;在震荡市场中,策略利用布林带边界和RSI超买超卖水平进行交易。具体来说:
|
||
|
|
- 趋势跟踪模式:当ADX>25时启用,结合20/50周期EMA的位置关系、Supertrend方向和价格相对VWAP的位置综合判断
|
||
|
|
- 区间交易模式:当ADX<25时启用,在价格触及布林带边界且RSI达到极值时入场
|
||
|
|
- 出场条件包括:止损触发、Supertrend反转或RSI达到极值
|
||
|
|
|
||
|
|
#### 策略优势
|
||
|
|
1. 自适应性强:能够根据市场状态自动切换交易模式
|
||
|
|
2. 多重确认:采用多个指标交叉验证,提高信号可靠性
|
||
|
|
3. 风险控制完善:设置了固定百分比止损,并利用RSI极值进行动态调整
|
||
|
|
4. 综合性强:既能把握趋势行情,又能在震荡市场中获利
|
||
|
|
5. 可视化支持:提供了重要指标的图形展示,便于分析决策
|
||
|
|
|
||
|
|
#### 策略风险
|
||
|
|
1. 参数敏感性:多个指标参数的设置会影响策略表现
|
||
|
|
2. 信号滞后:技术指标本身具有一定滞后性
|
||
|
|
3. 假突破风险:在横盘市场可能产生虚假信号
|
||
|
|
4. 计算复杂度:多个指标的实时计算可能影响执行效率
|
||
|
|
5. 市场适应性:可能在某些特定市场环境下表现不佳
|
||
|
|
|
||
|
|
#### 策略优化方向
|
||
|
|
1. 动态参数调整:可以根据波动率自动调整各指标参数
|
||
|
|
2. 引入成交量分析:增加成交量指标来验证信号有效性
|
||
|
|
3. 优化止损机制:可以考虑使用ATR动态止损
|
||
|
|
4. 增加时间过滤:加入交易时间窗口来避免低效时段
|
||
|
|
5. 市场情绪指标:整合市场情绪指标来提高预测准确性
|
||
|
|
|
||
|
|
#### 总结
|
||
|
|
这是一个设计合理、逻辑完整的综合性策略。通过多指标配合和模式切换,在不同市场环境下都能保持一定的适应性。虽然存在一些潜在风险,但通过合理的风险控制和持续优化,该策略具有良好的实战应用价值。建议在实盘使用时进行充分的参数优化和回测验证。
|
||
|
|
|
||
|
|
||
|
||
|
|
|
||
|
|
#### Overview
|
||
|
|
This strategy is an adaptive trading system that combines trend following and range trading approaches. It flexibly switches between trading modes in different market environments through the coordination of multiple technical indicators. The strategy utilizes Supertrend, moving averages, ADX, RSI, and Bollinger Bands to identify market conditions and determine trading signals, while incorporating VWAP for price reference and implementing stop-loss mechanisms for risk control.
|
||
|
|
|
||
|
|
#### Strategy Principles
|
||
|
|
The core logic is divided into two parts: trend following and range trading. In trending markets (determined by ADX>25), the strategy generates signals based on Supertrend direction, EMA crossovers, and VWAP position; in ranging markets, it trades using Bollinger Band boundaries and RSI overbought/oversold levels. Specifically:
|
||
|
|
- Trend Following Mode: Activated when ADX>25, combining 20/50 period EMA relationships, Supertrend direction, and price position relative to VWAP
|
||
|
|
- Range Trading Mode: Activated when ADX<25, entering positions when price touches Bollinger Band boundaries and RSI reaches extreme values
|
||
|
|
- Exit conditions include: stop-loss triggers, Supertrend reversals, or RSI extreme values
|
||
|
|
|
||
|
|
#### Strategy Advantages
|
||
|
|
1. Strong adaptability: Automatically switches trading modes based on market conditions
|
||
|
|
2. Multiple confirmations: Uses multiple indicators for cross-validation, improving signal reliability
|
||
|
|
3. Comprehensive risk control: Implements fixed percentage stop-loss and dynamic RSI-based adjustments
|
||
|
|
4. Versatility: Captures both trending and ranging market opportunities
|
||
|
|
5. Visual support: Provides graphical display of important indicators for analysis and decision-making
|
||
|
|
|
||
|
|
#### Strategy Risks
|
||
|
|
1. Parameter sensitivity: Strategy performance depends on multiple indicator settings
|
||
|
|
2. Signal lag: Technical indicators have inherent time delays
|
||
|
|
3. False breakout risk: May generate false signals in sideways markets
|
||
|
|
4. Computational complexity: Real-time calculation of multiple indicators may affect execution efficiency
|
||
|
|
5. Market adaptability: May underperform in certain market conditions
|
||
|
|
|
||
|
|
#### Optimization Directions
|
||
|
|
1. Dynamic parameter adjustment: Automatically adjust indicator parameters based on volatility
|
||
|
|
2. Volume analysis integration: Add volume indicators to validate signal effectiveness
|
||
|
|
3. Stop-loss optimization: Consider implementing ATR-based dynamic stop-loss
|
||
|
|
4. Time filtering: Add trading time windows to avoid inefficient periods
|
||
|
|
5. Market sentiment indicators: Integrate sentiment indicators to improve prediction accuracy
|
||
|
|
|
||
|
|
#### Summary
|
||
|
|
This is a well-designed, logically complete comprehensive strategy. Through multiple indicator coordination and mode switching, it maintains adaptability across different market conditions. While there are some potential risks, with proper risk control and continuous optimization, the strategy has good practical application value. It is recommended to perform thorough parameter optimization and backtesting before live implementation.
|
||
|
|
|
||
|
|
[/trans]
|
||
|
|
|
||
|
|
|
||
|
|
|
||
|
|
> Source (PineScript)
|
||
|
|
|
||
|
|
``` pinescript
|
||
|
|
/*backtest
|
||
|
|
start: 2025-01-27 00:00:00
|
||
|
|
end: 2025-02-20 00:00:00
|
||
|
|
period: 1h
|
||
|
|
basePeriod: 1h
|
||
|
|
exchanges: [{"eid":"Binance","currency":"SOL_USDT"}]
|
||
|
|
*/
|
||
|
|
|
||
|
|
//@version=5
|
||
|
|
strategy("Nifty/BankNifty Multi-Strategy v2", overlay=true, margin_long=100, margin_short=100)
|
||
|
|
|
||
|
|
// ———— Inputs ———— //
|
||
|
|
// Supertrend
|
||
|
|
atrPeriod = input.int(10, "ATR Period")
|
||
|
|
supertrendMultiplier = input.float(2.0, "Supertrend Multiplier", step=0.1)
|
||
|
|
|
||
|
|
// EMA
|
||
|
|
ema20Period = input.int(20, "20 EMA Period")
|
||
|
|
ema50Period = input.int(50, "50 EMA Period")
|
||
|
|
|
||
|
|
// ADX/DMI
|
||
|
|
adxThreshold = input.int(25, "ADX Trend Threshold")
|
||
|
|
adxLength = input.int(14, "ADX Length")
|
||
|
|
|
||
|
|
// RSI
|
||
|
|
rsiLength = input.int(14, "RSI Length")
|
||
|
|
rsiOverbought = input.int(70, "RSI Overbought")
|
||
|
|
rsiOversold = input.int(30, "RSI Oversold")
|
||
|
|
|
||
|
|
// Bollinger Bands
|
||
|
|
bbLength = input.int(20, "BB Length")
|
||
|
|
bbStdDev = input.float(2.0, "BB Std Dev", step=0.1)
|
||
|
|
|
||
|
|
// Stop-Loss
|
||
|
|
stopLossPerc = input.float(1.0, "Stop-Loss %", step=0.1)
|
||
|
|
|
||
|
|
// ———— Calculations ———— //
|
||
|
|
// Supertrend
|
||
|
|
[supertrend, direction] = ta.supertrend(supertrendMultiplier, atrPeriod)
|
||
|
|
|
||
|
|
// EMAs
|
||
|
|
ema20 = ta.ema(close, ema20Period)
|
||
|
|
ema50 = ta.ema(close, ema50Period)
|
||
|
|
|
||
|
|
// ADX via DMI (corrected)
|
||
|
|
[dip, din, adx] = ta.dmi(adxLength, adxLength) // ta.dmi(diLength, adxSmoothing)
|
||
|
|
|
||
|
|
// RSI
|
||
|
|
rsi = ta.rsi(close, rsiLength)
|
||
|
|
|
||
|
|
// Bollinger Bands
|
||
|
|
basis = ta.sma(close, bbLength)
|
||
|
|
upperBB = basis + ta.stdev(close, bbLength) * bbStdDev
|
||
|
|
lowerBB = basis - ta.stdev(close, bbLength) * bbStdDev
|
||
|
|
|
||
|
|
// VWAP
|
||
|
|
vwapValue = ta.vwap(hlc3)
|
||
|
|
|
||
|
|
// ———— Strategy Logic ———— //
|
||
|
|
trendingMarket = adx > adxThreshold
|
||
|
|
|
||
|
|
// Trend-Following Strategy
|
||
|
|
emaBullish = ema20 > ema50
|
||
|
|
priceAboveVWAP = close > vwapValue
|
||
|
|
|
||
|
|
longConditionTrend = trendingMarket and direction < 0 and emaBullish and priceAboveVWAP
|
||
|
|
shortConditionTrend = trendingMarket and direction > 0 and not emaBullish and close < vwapValue
|
||
|
|
|
||
|
|
// Range-Bound Strategy
|
||
|
|
priceNearLowerBB = close <= lowerBB
|
||
|
|
priceNearUpperBB = close >= upperBB
|
||
|
|
|
||
|
|
longConditionRange = not trendingMarket and priceNearLowerBB and rsi < rsiOversold
|
||
|
|
shortConditionRange = not trendingMarket and priceNearUpperBB and rsi > rsiOverbought
|
||
|
|
|
||
|
|
// ———— Entries/Exits ———— //
|
||
|
|
if (longConditionTrend or longConditionRange)
|
||
|
|
strategy.entry("Long", strategy.long)
|
||
|
|
stopPriceLong = strategy.position_avg_price * (1 - stopLossPerc / 100)
|
||
|
|
strategy.exit("Exit Long", "Long", stop=stopPriceLong)
|
||
|
|
|
||
|
|
if (shortConditionTrend or shortConditionRange)
|
||
|
|
strategy.entry("Short", strategy.short)
|
||
|
|
stopPriceShort = strategy.position_avg_price * (1 + stopLossPerc / 100)
|
||
|
|
strategy.exit("Exit Short", "Short", stop=stopPriceShort)
|
||
|
|
|
||
|
|
// Exit on Supertrend flip or RSI extremes
|
||
|
|
if (direction > 0 or rsi >= rsiOverbought)
|
||
|
|
strategy.close("Long")
|
||
|
|
|
||
|
|
if (direction < 0 or rsi <= rsiOversold)
|
||
|
|
strategy.close("Short")
|
||
|
|
|
||
|
|
// ———— Visualization ———— //
|
||
|
|
plot(supertrend, "Supertrend", color = direction < 0 ? color.green : color.red)
|
||
|
|
plot(ema20, "20 EMA", color.blue)
|
||
|
|
plot(ema50, "50 EMA", color.orange)
|
||
|
|
plot(vwapValue, "VWAP", color.purple)
|
||
|
|
plot(upperBB, "Upper BB", color.gray)
|
||
|
|
plot(lowerBB, "Lower BB", color.gray)
|
||
|
|
```
|
||
|
|
|
||
|
|
> Detail
|
||
|
|
|
||
|
|
https://www.fmz.com/strategy/483053
|
||
|
|
|
||
|
|
> Last Modified
|
||
|
|
|
||
|
|
2025-02-21 11:08:52
|