256 lines
19 KiB
Markdown
256 lines
19 KiB
Markdown

|
|
|||
|
|
> Name
|
|||
|
|
|
|||
|
|
多指标趋势确认交易系统-均线融合RSI背离MACD信号策略-Multi-Indicator-Trend-Confirmation-Trading-System-EMA-Confluence-with-RSI-Divergence-and-MACD-Signal-Strategy
|
|||
|
|
|
|||
|
|
> Author
|
|||
|
|
|
|||
|
|
ianzeng123
|
|||
|
|
|
|||
|
|
> Strategy Description
|
|||
|
|
|
|||
|
|
|
|||
|
|
|
|||
|
|
|
|||
|
|
[trans]#### 概述
|
|||
|
|
|
|||
|
|
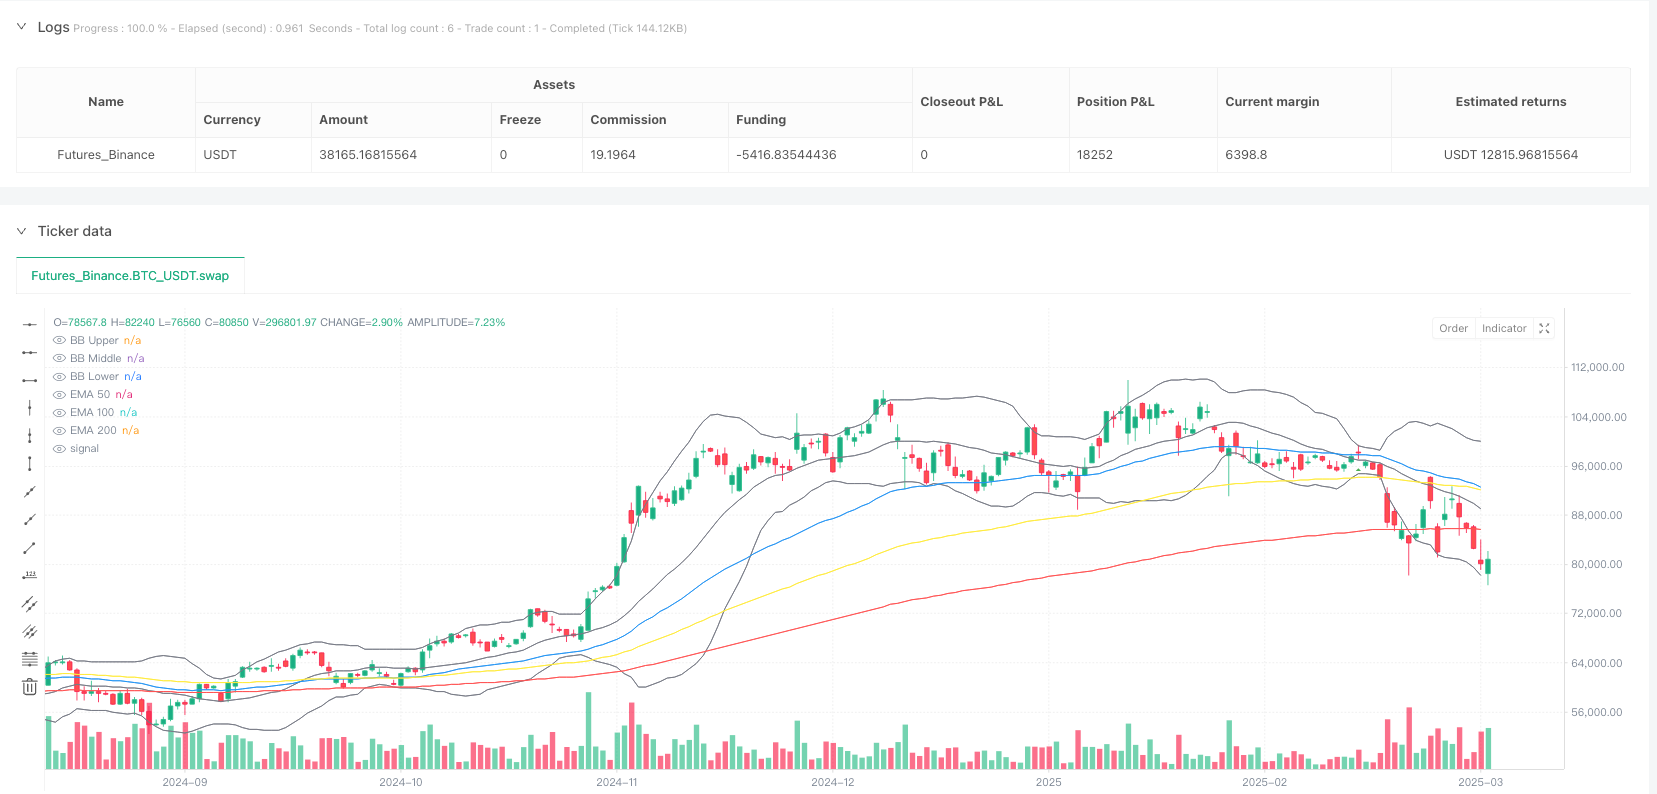
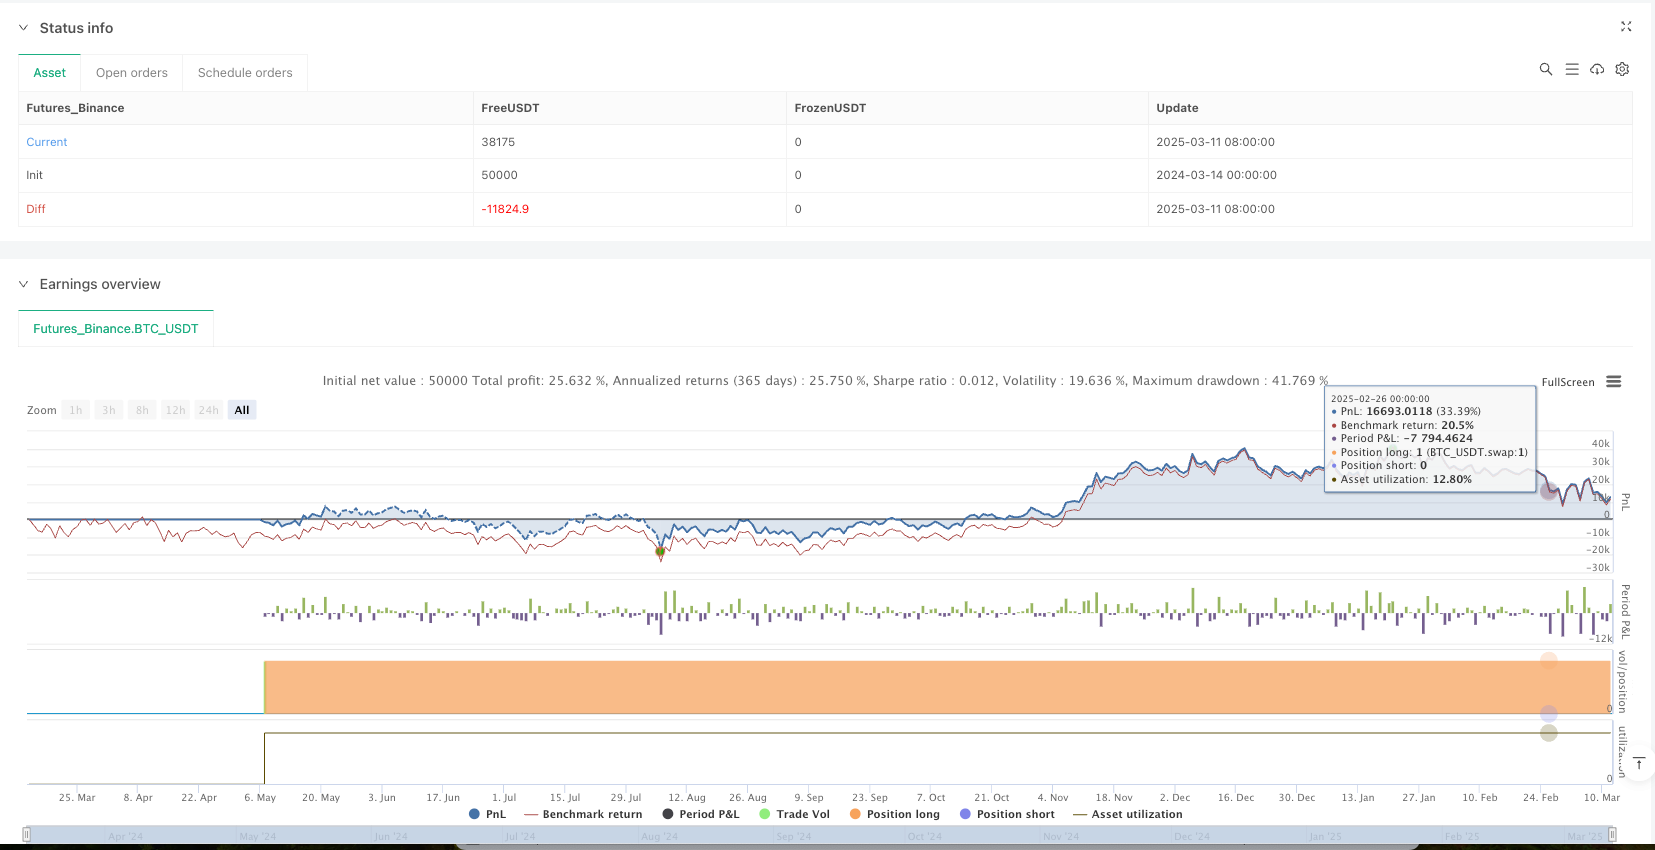
这个"多指标趋势确认交易系统 - 均线融合RSI背离MACD信号策略"是一个综合性的量化交易系统,通过结合多个技术指标来识别市场趋势和潜在的交易机会。该策略主要依靠三条指数移动平均线(EMA)、相对强弱指标(RSI)、移动平均线收敛发散指标(MACD)以及布林带(Bollinger Bands)等多个技术指标的协同确认,以提高交易信号的可靠性和准确性。
|
|||
|
|
|
|||
|
|
策略的核心理念是,只有当多个指标共同确认时才进行交易,这种"共识机制"有效降低了假信号的风险。在趋势明确的市场环境中,该策略通过EMA的层级结构确认大方向,再结合RSI和MACD等动量指标进行精确的入场时机把握,从而形成一个全面而稳健的交易系统。
|
|||
|
|
|
|||
|
|
#### 策略原理
|
|||
|
|
|
|||
|
|
多指标趋势确认交易系统基于以下关键原理运行:
|
|||
|
|
|
|||
|
|
1. **均线系统趋势确认**:策略使用三条不同周期(50、100、200)的指数移动平均线(EMA)形成层级结构。当短期均线(EMA50)位于中期均线(EMA100)之上,且中期均线位于长期均线(EMA200)之上时,确认上升趋势;反之则确认下降趋势。
|
|||
|
|
|
|||
|
|
2. **价格与均线交叉信号**:策略识别价格与EMA50的交叉点作为潜在的入场信号。当价格向上穿越EMA50且满足其他条件时,生成做多信号;当价格向下穿越EMA50且满足其他条件时,生成做空信号。
|
|||
|
|
|
|||
|
|
3. **RSI过滤条件**:采用RSI指标(周期为14)验证市场动量。做多信号要求RSI值大于50且小于70,避免在已超买区域入场;做空信号要求RSI值小于50且大于30,避免在已超卖区域入场。
|
|||
|
|
|
|||
|
|
4. **MACD方向确认**:通过MACD线与信号线的相对位置进一步确认趋势方向。做多信号要求MACD线位于信号线之上;做空信号要求MACD线位于信号线之下。
|
|||
|
|
|
|||
|
|
5. **布林带辅助分析**:系统同时显示布林带(20,2),帮助交易者直观了解市场波动情况,虽然布林带没有直接参与信号生成,但可作为辅助判断工具。
|
|||
|
|
|
|||
|
|
交易执行逻辑如下:
|
|||
|
|
- **做多条件**:价格上穿EMA50 且 EMA50 > EMA100 > EMA200 且 RSI > 50 且 RSI < 70 且 MACD线 > 信号线
|
|||
|
|
- **做空条件**:价格下穿EMA50 且 EMA50 < EMA100 < EMA200 且 RSI < 50 且 RSI > 30 且 MACD线 < 信号线
|
|||
|
|
|
|||
|
|
#### 策略优势
|
|||
|
|
|
|||
|
|
1. **多层过滤机制**:通过要求多个指标同时满足特定条件,有效减少了假信号的产生,提高了交易信号的质量和可靠性。只有当趋势、动量和价格行为等多个方面都确认时,策略才会发出信号。
|
|||
|
|
|
|||
|
|
2. **趋势跟踪与动量结合**:策略既考虑了趋势因素(通过EMA系统),又兼顾了动量因素(通过RSI和MACD),全面分析市场状态,使交易决策更加全面和均衡。
|
|||
|
|
|
|||
|
|
3. **避免极端区域交易**:通过RSI的上下限过滤,避免在超买或超卖区域追高杀低,有效规避了逆势交易的高风险。
|
|||
|
|
|
|||
|
|
4. **适应不同市场周期**:通过融合不同时间周期的指标(短期、中期、长期均线),策略能够在不同的市场周期中找到适合的交易机会,适应性较强。
|
|||
|
|
|
|||
|
|
5. **视觉直观**:策略的信号显示清晰直观,使用三角形标记明确指示入场点位,同时通过不同颜色的均线和布林带提供市场结构的可视化参考,便于交易者理解和执行。
|
|||
|
|
|
|||
|
|
6. **规则明确客观**:交易规则完全基于客观技术指标,消除了主观判断因素,有助于交易者保持纪律性,严格执行交易计划。
|
|||
|
|
|
|||
|
|
#### 策略风险
|
|||
|
|
|
|||
|
|
1. **滞后性风险**:作为一个基于移动平均线的系统,该策略存在一定滞后性,尤其是在市场急剧转向或波动加剧时可能错过最佳入场或出场时机。
|
|||
|
|
|
|||
|
|
2. **震荡市场表现不佳**:在横盘震荡或无明显趋势的市场环境中,策略可能产生频繁的假信号,导致"锯齿式"损失。当价格在均线附近来回震荡时,这一风险尤为显著。
|
|||
|
|
|
|||
|
|
3. **指标冲突风险**:多指标策略虽然提高了信号可靠性,但也可能导致指标之间相互冲突,在某些市场环境下难以产生明确信号,错过潜在交易机会。
|
|||
|
|
|
|||
|
|
4. **参数优化过度**:该策略使用多个可调参数(如均线周期、RSI阈值等),存在过度优化(过拟合)的风险,可能在历史数据中表现出色但在实盘交易中效果不佳。
|
|||
|
|
|
|||
|
|
5. **缺乏止损机制**:代码中未明确设置止损策略,在趋势突然逆转的情况下可能面临较大亏损风险。
|
|||
|
|
|
|||
|
|
**风险解决方案**:
|
|||
|
|
- 加入适当的止损机制,如基于ATR的动态止损或固定百分比止损
|
|||
|
|
- 实施资金管理规则,限制每笔交易的风险敞口
|
|||
|
|
- 增加市场环境过滤器,在震荡市场中减少交易频率或暂停交易
|
|||
|
|
- 使用自适应参数或在不同市场环境下切换参数设置
|
|||
|
|
- 结合更高时间周期分析,提高整体判断的准确性
|
|||
|
|
|
|||
|
|
#### 策略优化方向
|
|||
|
|
|
|||
|
|
1. **增加市场环境识别机制**:可以引入ADX(平均趋向指标)来识别市场是否处于明显趋势中,只在ADX高于特定阈值(如25)时才允许交易,避免在震荡市场中频繁交易。
|
|||
|
|
|
|||
|
|
2. **完善资金管理与风险控制**:
|
|||
|
|
- 实现动态止损策略,如基于ATR的追踪止损
|
|||
|
|
- 添加利润保护机制,在盈利达到一定水平后移动止损到成本位
|
|||
|
|
- 根据市场波动性动态调整仓位大小
|
|||
|
|
|
|||
|
|
3. **增强入场条件精确性**:
|
|||
|
|
- 考虑加入成交量确认机制,要求信号出现时成交量增加
|
|||
|
|
- 增加价格形态识别,如突破确认或回调确认
|
|||
|
|
- 结合更高时间周期的趋势方向确认
|
|||
|
|
|
|||
|
|
4. **引入自适应参数**:
|
|||
|
|
- 使均线周期根据市场波动性自动调整,在低波动环境使用较短周期,高波动环境使用较长周期
|
|||
|
|
- 使RSI的超买超卖阈值根据整体市场环境动态调整
|
|||
|
|
|
|||
|
|
5. **增加分批建仓与平仓机制**:不再采用一次性全仓建仓方式,而是实现分批建仓策略,在信号出现后分多次入场,同样在获利后也分批平仓,提高资金利用效率并降低时机选择风险。
|
|||
|
|
|
|||
|
|
优化这些方向的理由在于,原策略虽然在信号生成机制上相对完善,但在实际应用中仍存在风险管理不足、市场适应性有限等问题。通过增加市场环境过滤、完善风险控制和引入自适应参数等措施,可以使策略在保持原有优势的同时,显著提高在不同市场环境下的稳定性和鲁棒性。
|
|||
|
|
|
|||
|
|
#### 总结
|
|||
|
|
|
|||
|
|
多指标趋势确认交易系统是一个结构完善、逻辑清晰的量化交易策略,它通过均线系统、RSI和MACD等指标的协同作用,构建了一个多层次的交易信号确认机制。该策略特别适合趋势明确的市场环境,能够有效捕捉中长期趋势变化并找到相对理想的入场点位。
|
|||
|
|
|
|||
|
|
策略的主要优势在于多指标协同确认机制大大提高了信号质量,规避了单一指标可能带来的误导,同时通过避开极端区域交易降低了风险。然而,策略也面临滞后性风险、震荡市场适应性不足以及风险控制机制欠缺等挑战。
|
|||
|
|
|
|||
|
|
通过增加市场环境识别、完善风险管理、增强入场精确性、引入自适应参数和实现分批交易等优化措施,该策略有潜力发展成为一个更加全面、稳健和适应性强的交易系统。交易者在实际应用中,应注重不同市场环境下的表现测试,合理设置参数,并结合完善的资金管理规则,才能充分发挥该策略的优势,实现长期稳定的交易效果。 || #### Overview
|
|||
|
|
|
|||
|
|
The "Multi-Indicator Trend Confirmation Trading System - EMA Confluence with RSI Divergence and MACD Signal Strategy" is a comprehensive quantitative trading system that identifies market trends and potential trading opportunities by combining multiple technical indicators. This strategy primarily relies on the coordinated confirmation of three Exponential Moving Averages (EMAs), Relative Strength Index (RSI), Moving Average Convergence Divergence (MACD), and Bollinger Bands to enhance the reliability and accuracy of trading signals.
|
|||
|
|
|
|||
|
|
The core philosophy of this strategy is to execute trades only when multiple indicators provide confirmation simultaneously, creating a "consensus mechanism" that effectively reduces the risk of false signals. In clearly trending market environments, the strategy confirms the overall direction through the hierarchical structure of EMAs, then combines momentum indicators like RSI and MACD to precisely time entries, forming a comprehensive and robust trading system.
|
|||
|
|
|
|||
|
|
#### Strategy Principles
|
|||
|
|
|
|||
|
|
The Multi-Indicator Trend Confirmation Trading System operates based on the following key principles:
|
|||
|
|
|
|||
|
|
1. **EMA System Trend Confirmation**: The strategy employs three different period (50, 100, 200) Exponential Moving Averages (EMAs) to form a hierarchical structure. An uptrend is confirmed when the short-term EMA (EMA50) is above the medium-term EMA (EMA100), which is above the long-term EMA (EMA200); conversely, a downtrend is confirmed.
|
|||
|
|
|
|||
|
|
2. **Price and EMA Crossover Signals**: The strategy identifies crossover points between price and EMA50 as potential entry signals. A long signal is generated when price crosses above EMA50 and other conditions are met; a short signal is generated when price crosses below EMA50 and other conditions are met.
|
|||
|
|
|
|||
|
|
3. **RSI Filter Conditions**: RSI indicator (period 14) is used to verify market momentum. Long signals require the RSI value to be greater than 50 but less than 70, avoiding entries in already overbought areas; short signals require the RSI value to be less than 50 but greater than 30, avoiding entries in already oversold areas.
|
|||
|
|
|
|||
|
|
4. **MACD Direction Confirmation**: The relative position of the MACD line to the signal line further confirms trend direction. Long signals require the MACD line to be above the signal line; short signals require the MACD line to be below the signal line.
|
|||
|
|
|
|||
|
|
5. **Bollinger Bands Auxiliary Analysis**: The system displays Bollinger Bands (20,2) to help traders intuitively understand market volatility. While Bollinger Bands don't directly participate in signal generation, they serve as an auxiliary judgment tool.
|
|||
|
|
|
|||
|
|
The trade execution logic is as follows:
|
|||
|
|
- **Long Condition**: Price crosses above EMA50 AND EMA50 > EMA100 > EMA200 AND RSI > 50 AND RSI < 70 AND MACD line > Signal line
|
|||
|
|
- **Short Condition**: Price crosses below EMA50 AND EMA50 < EMA100 < EMA200 AND RSI < 50 AND RSI > 30 AND MACD line < Signal line
|
|||
|
|
|
|||
|
|
#### Strategy Advantages
|
|||
|
|
|
|||
|
|
1. **Multi-Layer Filtering Mechanism**: By requiring multiple indicators to simultaneously meet specific conditions, the strategy effectively reduces false signals and improves the quality and reliability of trading signals. Signals are only generated when trend, momentum, and price action are all confirmed.
|
|||
|
|
|
|||
|
|
2. **Trend Following and Momentum Combination**: The strategy considers both trend factors (through the EMA system) and momentum factors (through RSI and MACD), providing a comprehensive market analysis that leads to more balanced trading decisions.
|
|||
|
|
|
|||
|
|
3. **Avoiding Extreme Area Trading**: By filtering with RSI upper and lower limits, the strategy avoids chasing highs or lows in overbought or oversold areas, effectively mitigating the high risk of counter-trend trading.
|
|||
|
|
|
|||
|
|
4. **Adaptation to Different Market Cycles**: By integrating indicators from different time periods (short-term, medium-term, long-term moving averages), the strategy can find suitable trading opportunities across various market cycles, demonstrating strong adaptability.
|
|||
|
|
|
|||
|
|
5. **Visual Intuitiveness**: The strategy displays signals clearly and intuitively, using triangle markers to precisely indicate entry points, while different colored moving averages and Bollinger Bands provide visual references for market structure, making it easy for traders to understand and execute.
|
|||
|
|
|
|||
|
|
6. **Clear and Objective Rules**: Trading rules are entirely based on objective technical indicators, eliminating subjective judgment factors, which helps traders maintain discipline and strictly follow the trading plan.
|
|||
|
|
|
|||
|
|
#### Strategy Risks
|
|||
|
|
|
|||
|
|
1. **Lag Risk**: As a moving average-based system, this strategy has some inherent lag, which may cause missed optimal entry or exit points, especially during rapid market reversals or increased volatility.
|
|||
|
|
|
|||
|
|
2. **Poor Performance in Ranging Markets**: In sideways or trendless market environments, the strategy may generate frequent false signals, leading to "whipsaw" losses. This risk is particularly significant when prices oscillate around moving averages.
|
|||
|
|
|
|||
|
|
3. **Indicator Conflict Risk**: While multi-indicator strategies improve signal reliability, they may also cause conflicts between indicators, making it difficult to generate clear signals in certain market environments and potentially missing trading opportunities.
|
|||
|
|
|
|||
|
|
4. **Parameter Optimization Excess**: The strategy uses multiple adjustable parameters (such as moving average periods, RSI thresholds), creating a risk of over-optimization (overfitting), which may perform excellently on historical data but poorly in live trading.
|
|||
|
|
|
|||
|
|
5. **Lack of Stop-Loss Mechanism**: The code does not explicitly set a stop-loss strategy, which may result in significant losses if trends suddenly reverse.
|
|||
|
|
|
|||
|
|
**Risk Solutions**:
|
|||
|
|
- Implement appropriate stop-loss mechanisms, such as ATR-based dynamic stops or fixed percentage stops
|
|||
|
|
- Implement money management rules to limit risk exposure per trade
|
|||
|
|
- Add market environment filters to reduce trading frequency or pause trading in ranging markets
|
|||
|
|
- Use adaptive parameters or switch parameter settings in different market environments
|
|||
|
|
- Incorporate higher timeframe analysis to improve overall judgment accuracy
|
|||
|
|
|
|||
|
|
#### Strategy Optimization Directions
|
|||
|
|
|
|||
|
|
1. **Add Market Environment Recognition Mechanism**: Introduce ADX (Average Directional Index) to identify whether the market is in a clear trend, only allowing trades when ADX is above a specific threshold (e.g., 25), avoiding frequent trading in ranging markets.
|
|||
|
|
|
|||
|
|
2. **Improve Money Management and Risk Control**:
|
|||
|
|
- Implement dynamic stop-loss strategies, such as ATR-based trailing stops
|
|||
|
|
- Add profit protection mechanisms, moving stops to breakeven when profits reach certain levels
|
|||
|
|
- Dynamically adjust position sizes based on market volatility
|
|||
|
|
|
|||
|
|
3. **Enhance Entry Condition Precision**:
|
|||
|
|
- Consider adding volume confirmation mechanisms, requiring volume increase when signals appear
|
|||
|
|
- Add price pattern recognition, such as breakout confirmation or pullback confirmation
|
|||
|
|
- Incorporate higher timeframe trend direction confirmation
|
|||
|
|
|
|||
|
|
4. **Introduce Adaptive Parameters**:
|
|||
|
|
- Allow moving average periods to automatically adjust based on market volatility, using shorter periods in low volatility environments and longer periods in high volatility environments
|
|||
|
|
- Make RSI overbought/oversold thresholds dynamically adjust according to the overall market environment
|
|||
|
|
|
|||
|
|
5. **Add Scaled Entry and Exit Mechanisms**: Instead of all-in-one-go position building, implement a scaled entry strategy, entering positions in multiple stages after a signal appears, and similarly scaling out of positions when taking profits, improving capital efficiency and reducing timing risk.
|
|||
|
|
|
|||
|
|
The rationale for these optimization directions is that while the original strategy is relatively complete in its signal generation mechanism, it still has limitations in risk management and market adaptability in practical applications. By adding market environment filtering, improving risk control, and introducing adaptive parameters, the strategy can maintain its original advantages while significantly improving stability and robustness across different market environments.
|
|||
|
|
|
|||
|
|
#### Summary
|
|||
|
|
|
|||
|
|
The Multi-Indicator Trend Confirmation Trading System is a well-structured, logically clear quantitative trading strategy that builds a multi-level trade signal confirmation mechanism through the coordinated action of EMA systems, RSI, and MACD indicators. This strategy is particularly suitable for clearly trending market environments, effectively capturing medium to long-term trend changes and finding relatively ideal entry points.
|
|||
|
|
|
|||
|
|
The main advantage of the strategy lies in its multi-indicator collaborative confirmation mechanism, which greatly improves signal quality and avoids the potential misleading of single indicators, while reducing risk by avoiding trading in extreme areas. However, the strategy also faces challenges such as lag risk, poor adaptability in ranging markets, and insufficient risk control mechanisms.
|
|||
|
|
|
|||
|
|
Through optimizations such as adding market environment recognition, improving risk management, enhancing entry precision, introducing adaptive parameters, and implementing scaled trading, this strategy has the potential to develop into a more comprehensive, robust, and adaptive trading system. In practical application, traders should focus on testing performance in different market environments, setting parameters reasonably, and combining with sound money management rules to fully leverage the advantages of this strategy and achieve long-term stable trading results.[/trans]
|
|||
|
|
|
|||
|
|
|
|||
|
|
|
|||
|
|
> Source (PineScript)
|
|||
|
|
|
|||
|
|
``` pinescript
|
|||
|
|
/*backtest
|
|||
|
|
start: 2024-03-14 00:00:00
|
|||
|
|
end: 2025-03-12 08:00:00
|
|||
|
|
period: 1d
|
|||
|
|
basePeriod: 1d
|
|||
|
|
exchanges: [{"eid":"Futures_Binance","currency":"BTC_USDT"}]
|
|||
|
|
*/
|
|||
|
|
|
|||
|
|
//@version=5
|
|||
|
|
strategy("Multi-Indikator Handelsstrategie", overlay=true)
|
|||
|
|
|
|||
|
|
// Eingabevariablen
|
|||
|
|
len1 = input(50, "EMA 50")
|
|||
|
|
len2 = input(100, "EMA 100")
|
|||
|
|
len3 = input(200, "EMA 200")
|
|||
|
|
rsiLength = input(14, "RSI Länge")
|
|||
|
|
rsiOverbought = input(70, "RSI Überkauft")
|
|||
|
|
rsiOversold = input(30, "RSI Überverkauft")
|
|||
|
|
|
|||
|
|
// Indikatoren
|
|||
|
|
ema50 = ta.ema(close, len1)
|
|||
|
|
ema100 = ta.ema(close, len2)
|
|||
|
|
ema200 = ta.ema(close, len3)
|
|||
|
|
rsi = ta.rsi(close, rsiLength)
|
|||
|
|
[macdLine, signalLine, histLine] = ta.macd(close, 12, 26, 9)
|
|||
|
|
[middle, upper, lower] = ta.bb(close, 20, 2)
|
|||
|
|
|
|||
|
|
// Handelssignale
|
|||
|
|
longCondition = ta.crossover(close, ema50) and ema50 > ema100 and ema100 > ema200 and rsi > 50 and rsi < rsiOverbought and macdLine > signalLine
|
|||
|
|
|
|||
|
|
shortCondition = ta.crossunder(close, ema50) and
|
|||
|
|
ema50 < ema100 and
|
|||
|
|
ema100 < ema200 and
|
|||
|
|
rsi < 50 and
|
|||
|
|
rsi > rsiOversold and
|
|||
|
|
macdLine < signalLine
|
|||
|
|
|
|||
|
|
// Plots
|
|||
|
|
plot(ema50, "EMA 50", color.blue)
|
|||
|
|
plot(ema100, "EMA 100", color.yellow)
|
|||
|
|
plot(ema200, "EMA 200", color.red)
|
|||
|
|
plot(upper, "BB Upper", color.gray)
|
|||
|
|
plot(middle, "BB Middle", color.gray)
|
|||
|
|
plot(lower, "BB Lower", color.gray)
|
|||
|
|
|
|||
|
|
// Signale
|
|||
|
|
plotshape(longCondition, "Long", shape.triangleup, location.belowbar, color.green)
|
|||
|
|
plotshape(shortCondition, "Short", shape.triangledown, location.abovebar, color.red)
|
|||
|
|
|
|||
|
|
// Strategie
|
|||
|
|
if (longCondition)
|
|||
|
|
strategy.entry("Long", strategy.long)
|
|||
|
|
|
|||
|
|
if (shortCondition)
|
|||
|
|
strategy.entry("Short", strategy.short)
|
|||
|
|
```
|
|||
|
|
|
|||
|
|
> Detail
|
|||
|
|
|
|||
|
|
https://www.fmz.com/strategy/486573
|
|||
|
|
|
|||
|
|
> Last Modified
|
|||
|
|
|
|||
|
|
2025-03-14 09:52:05
|