311 lines
22 KiB
Markdown
311 lines
22 KiB
Markdown

|
|
||
|
|
> Name
|
||
|
|
|
||
|
|
多指标合成多维决策交易系统-基于RSIMACD布林带成交量及趋势的量化策略-Multi-Indicator-Composite-Multi-Dimensional-Decision-Trading-System-A-Quantitative-Strategy-Based-on-RSI-MACD-Bollinger-Bands-Volume-and-Trend
|
||
|
|
|
||
|
|
> Author
|
||
|
|
|
||
|
|
ianzeng123
|
||
|
|
|
||
|
|
> Strategy Description
|
||
|
|
|
||
|
|
|
||
|
|
|
||
|
|
|
||
|
|
[trans]
|
||
|
|
|
||
|
|
#### 概述
|
||
|
|
|
||
|
|
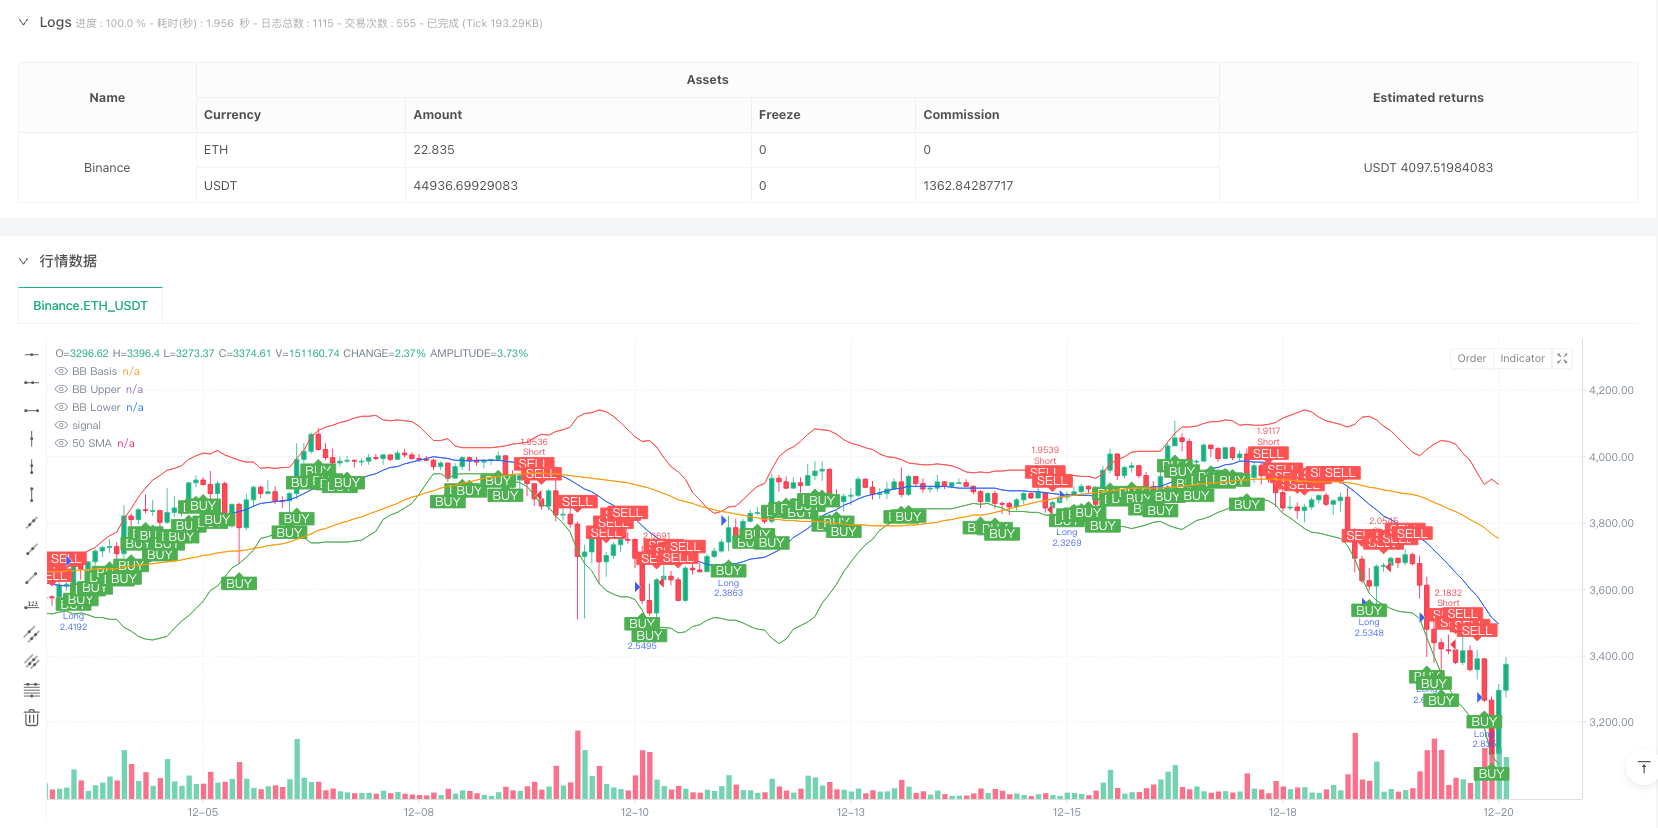
多指标合成多维决策交易系统是一个结合了多种技术指标的量化策略,该策略通过综合分析5个关键指标(RSI、MACD、布林带、成交量和价格趋势)来生成交易信号。当至少3个指标显示看涨信号时,策略会发出买入指令;当至少3个指标显示看跌信号时,则发出卖出指令。这种多维分析方法能够过滤掉单一指标可能产生的虚假信号,提高了交易决策的可靠性。该策略还配备了直观的状态表格,实时显示各指标的当前状态,使交易者能够清晰地了解市场的多维状态。
|
||
|
|
|
||
|
|
#### 策略原理
|
||
|
|
|
||
|
|
该策略的核心原理基于多指标共振的思想,通过以下步骤运作:
|
||
|
|
|
||
|
|
1. **指标计算**: 策略首先计算5个关键指标:
|
||
|
|
- RSI(相对强弱指数): 使用18周期设置,评估价格动量
|
||
|
|
- MACD(移动平均线收敛发散): 使用12/26/9周期组合,识别趋势变化
|
||
|
|
- 布林带: 使用20周期、2.5倍标准差设置,评估价格波动性
|
||
|
|
- 成交量: 与20周期均线对比,评估交易活跃度
|
||
|
|
- 价格趋势: 通过50周期均线判断中期趋势方向
|
||
|
|
|
||
|
|
2. **信号条件定义**: 对每个指标设定看涨和看跌的具体条件:
|
||
|
|
- RSI: 低于30为看涨,高于70为看跌
|
||
|
|
- MACD: MACD线高于信号线为看涨,反之为看跌
|
||
|
|
- 布林带: 价格在布林带内为看涨,价格低于下轨为看跌
|
||
|
|
- 成交量: 高于20日均量为看涨,低于为看跌
|
||
|
|
- 价格趋势: 高于50日均线为看涨,低于为看跌
|
||
|
|
|
||
|
|
3. **多指标合成**: 代码通过计算看涨和看跌信号的数量,当至少有3个指标显示看涨时形成多维买入信号,当至少有3个指标显示看跌时形成多维卖出信号。
|
||
|
|
|
||
|
|
4. **执行交易**: 在满足买入条件时进入多头仓位,在满足卖出条件时进入空头仓位。
|
||
|
|
|
||
|
|
该策略的优势在于它不依赖单一指标,而是要求多个指标同时确认,这种"多数表决"机制大大减少了误判的可能性。
|
||
|
|
|
||
|
|
#### 策略优势
|
||
|
|
|
||
|
|
深入分析该多指标合成策略的代码,可以总结出以下显著优势:
|
||
|
|
|
||
|
|
1. **多维过滤机制**: 通过要求5个指标中至少3个产生一致信号,有效降低了单一指标可能产生的误导性信号,显著提高了交易精确度。
|
||
|
|
|
||
|
|
2. **自适应性强**: 结合了动量指标(RSI)、趋势指标(MACD、均线)和波动指标(布林带),使策略能够适应不同市场环境,包括趋势市和震荡市。
|
||
|
|
|
||
|
|
3. **风险控制内置**: 布林带组件能够识别极端价格行为,RSI能够检测超买超卖状态,这些内置的过滤器有助于避免在不利市场条件下入场。
|
||
|
|
|
||
|
|
4. **信息透明度高**: 状态表格功能使交易者能够一目了然地看到每个指标的当前状态,提高了策略的可解释性和用户信任度。
|
||
|
|
|
||
|
|
5. **参数可定制**: 代码中所有关键指标参数都通过input函数设置,使交易者能够根据不同市场和时间框架调整策略,增强了策略的灵活性。
|
||
|
|
|
||
|
|
6. **可视化效果优秀**: 策略不仅通过表格显示指标状态,还绘制了布林带和50日均线,并用明显的标记标示买卖信号点,使交易者能够直观理解市场状态和交易逻辑。
|
||
|
|
|
||
|
|
7. **资金管理集成**: 策略默认使用账户15%的资金进行每次交易,并考虑了0.075%的交易成本,体现了完整的交易系统设计思想。
|
||
|
|
|
||
|
|
#### 策略风险
|
||
|
|
|
||
|
|
尽管该策略融合了多个指标以提高稳健性,但仍存在以下潜在风险:
|
||
|
|
|
||
|
|
1. **参数敏感性**: 各指标的参数设置(如RSI长度、布林带乘数等)对策略性能有显著影响。不适当的参数可能导致过度交易或错过重要信号。解决方法是进行回测优化,找到适合特定市场的最佳参数组合。
|
||
|
|
|
||
|
|
2. **指标间相关性**: 某些指标之间可能存在高度相关性(如MACD和价格趋势),这可能导致信号重复计算,降低了多维分析的有效性。解决方法是引入相关性较低的替代指标,如相对波动指数或资金流量指标。
|
||
|
|
|
||
|
|
3. **市场环境依赖**: 该策略在趋势明确的市场中表现较好,但在横盘整理或快速转向的市场中可能产生频繁的虚假信号。解决方法是增加市场环境判断组件,在不同市场状态下调整策略参数或暂停交易。
|
||
|
|
|
||
|
|
4. **固定阈值局限性**: 策略使用固定阈值(如RSI的30/70)判断信号,这在不同市场环境下可能不够灵活。解决方法是采用自适应阈值,如基于历史波动率或市场状态动态调整指标阈值。
|
||
|
|
|
||
|
|
5. **缺乏止损机制**: 代码中没有明确的止损策略,可能导致在错误信号后持续亏损。解决方法是添加基于ATR或固定百分比的止损机制,保护资金安全。
|
||
|
|
|
||
|
|
6. **数据滞后问题**: 多数技术指标都是滞后指标,可能导致入场点不理想。解决方法是增加一些领先指标或价格行为分析,提前捕捉市场转折点。
|
||
|
|
|
||
|
|
#### 策略优化方向
|
||
|
|
|
||
|
|
分析该策略的代码结构和逻辑,可以提出以下几个值得深入探索的优化方向:
|
||
|
|
|
||
|
|
1. **自适应指标参数**: 当前策略使用固定参数,可以优化为根据市场波动性自动调整参数。例如,在高波动市场中增加布林带乘数或延长RSI周期,这将使策略更好地适应不同市场环境,提高稳定性。
|
||
|
|
|
||
|
|
2. **加权信号系统**: 当前策略对所有指标赋予相同权重,可以优化为根据各指标在当前市场环境中的表现赋予不同权重。例如,在趋势市场中增加MACD和价格趋势的权重,在震荡市场中增加RSI和布林带的权重,这将提高信号的准确性。
|
||
|
|
|
||
|
|
3. **时间框架协调**: 引入多时间框架分析,要求短期和长期时间框架的信号一致时才执行交易。这种优化能够过滤掉更多噪声信号,捕捉更可靠的趋势变化。
|
||
|
|
|
||
|
|
4. **动态止盈止损**: 添加基于ATR或布林带宽度的动态止盈止损机制,在不同波动率环境下自动调整风险控制参数,这将大大提高策略的风险回报比。
|
||
|
|
|
||
|
|
5. **市场环境分类**: 增加市场环境识别模块,在不同类型的市场(趋势、震荡、暴力)中使用不同的交易逻辑或参数设置,这将减少在不适合的市场环境中交易的风险。
|
||
|
|
|
||
|
|
6. **机器学习集成**: 使用机器学习算法优化各指标的权重和阈值,根据历史数据自动找出最佳组合。这种方法可以克服人为参数设置的局限性,挖掘出更复杂的市场模式。
|
||
|
|
|
||
|
|
7. **增加辅助过滤条件**: 引入交易量平衡指标、市场波动周期分析等辅助工具,进一步提高信号质量。特别是加入对大型经济数据发布或重要事件的过滤,避免在高风险时期交易。
|
||
|
|
|
||
|
|
#### 总结
|
||
|
|
|
||
|
|
多指标合成多维决策交易系统是一个集成了多种技术分析工具的全面量化策略。通过要求多数指标共振确认,该策略有效地过滤了市场噪音,提高了交易信号的可靠性。其核心优势在于多维分析框架和信息透明度,使交易者能够基于多元数据做出更加客观的决策。
|
||
|
|
|
||
|
|
然而,该策略也面临参数敏感性、指标相关性和市场适应性等挑战。通过引入自适应参数、加权信号系统、多时间框架协调和动态风险管理等优化措施,策略的性能有望得到显著提升。
|
||
|
|
|
||
|
|
最终,这个策略的价值在于它提供了一个坚实的量化交易框架,交易者可以在此基础上根据个人风险偏好和市场理解进行个性化调整。对于寻求系统化、规则化交易方法的投资者来说,这是一个值得研究和实践的策略模板。 ||
|
||
|
|
|
||
|
|
#### Overview
|
||
|
|
|
||
|
|
The Multi-Indicator Composite Multi-Dimensional Decision Trading System is a quantitative strategy that combines multiple technical indicators to generate trading signals. This system analyzes five key indicators (RSI, MACD, Bollinger Bands, volume, and price trend) to make trading decisions. When at least three indicators show bullish signals, the strategy issues a buy command; when at least three indicators show bearish signals, it issues a sell command. This multi-dimensional analysis approach filters out false signals that might be produced by individual indicators, thereby increasing the reliability of trading decisions. The strategy also features an intuitive status table that displays the current state of each indicator in real-time, allowing traders to clearly understand the multi-dimensional state of the market.
|
||
|
|
|
||
|
|
#### Strategy Principle
|
||
|
|
|
||
|
|
The core principle of this strategy is based on the concept of multi-indicator resonance, operating through the following steps:
|
||
|
|
|
||
|
|
1. **Indicator Calculation**: The strategy first calculates five key indicators:
|
||
|
|
- RSI (Relative Strength Index): Using an 18-period setting to evaluate price momentum
|
||
|
|
- MACD (Moving Average Convergence Divergence): Using 12/26/9 period combination to identify trend changes
|
||
|
|
- Bollinger Bands: Using 20-period, 2.5 standard deviation settings to assess price volatility
|
||
|
|
- Volume: Compared with the 20-period moving average to evaluate trading activity
|
||
|
|
- Price Trend: Using a 50-period moving average to determine the medium-term trend direction
|
||
|
|
|
||
|
|
2. **Signal Condition Definition**: Specific bullish and bearish conditions are set for each indicator:
|
||
|
|
- RSI: Below 30 is bullish, above 70 is bearish
|
||
|
|
- MACD: MACD line above signal line is bullish, vice versa is bearish
|
||
|
|
- Bollinger Bands: Price within the bands is bullish, price below the lower band is bearish
|
||
|
|
- Volume: Higher than 20-day average volume is bullish, lower is bearish
|
||
|
|
- Price Trend: Above 50-day moving average is bullish, below is bearish
|
||
|
|
|
||
|
|
3. **Multi-Indicator Composition**: The code calculates the number of bullish and bearish signals, forming a multi-dimensional buy signal when at least three indicators show bullish conditions, and a multi-dimensional sell signal when at least three indicators show bearish conditions.
|
||
|
|
|
||
|
|
4. **Trade Execution**: Enter a long position when buy conditions are met, enter a short position when sell conditions are met.
|
||
|
|
|
||
|
|
The advantage of this strategy lies in its non-reliance on a single indicator, instead requiring multiple indicators to confirm simultaneously. This "majority voting" mechanism greatly reduces the possibility of misjudgment.
|
||
|
|
|
||
|
|
#### Strategy Advantages
|
||
|
|
|
||
|
|
Deep analysis of this multi-indicator composite strategy code reveals the following significant advantages:
|
||
|
|
|
||
|
|
1. **Multi-dimensional Filtering Mechanism**: By requiring at least three out of five indicators to produce consistent signals, it effectively reduces misleading signals that might be generated by a single indicator, significantly improving trading precision.
|
||
|
|
|
||
|
|
2. **Strong Adaptability**: Combining momentum indicators (RSI), trend indicators (MACD, moving averages), and volatility indicators (Bollinger Bands) allows the strategy to adapt to different market environments, including trending and oscillating markets.
|
||
|
|
|
||
|
|
3. **Built-in Risk Control**: The Bollinger Bands component can identify extreme price behaviors, and RSI can detect overbought and oversold conditions. These built-in filters help avoid entering the market under unfavorable conditions.
|
||
|
|
|
||
|
|
4. **High Information Transparency**: The status table function allows traders to clearly see the current state of each indicator at a glance, improving the strategy's explainability and user trust.
|
||
|
|
|
||
|
|
5. **Customizable Parameters**: All key indicator parameters in the code are set via the input function, allowing traders to adjust the strategy according to different markets and time frames, enhancing the strategy's flexibility.
|
||
|
|
|
||
|
|
6. **Excellent Visualization**: The strategy not only displays indicator status through tables but also plots Bollinger Bands and the 50-day moving average, marking buy and sell signal points with obvious markers, allowing traders to intuitively understand market conditions and trading logic.
|
||
|
|
|
||
|
|
7. **Integrated Fund Management**: The strategy defaults to using 15% of the account's funds for each trade and considers a 0.075% trading cost, reflecting a complete trading system design philosophy.
|
||
|
|
|
||
|
|
#### Strategy Risks
|
||
|
|
|
||
|
|
Despite integrating multiple indicators to improve robustness, the following potential risks still exist:
|
||
|
|
|
||
|
|
1. **Parameter Sensitivity**: The parameter settings of various indicators (such as RSI length, Bollinger Band multiplier, etc.) significantly impact strategy performance. Inappropriate parameters may lead to overtrading or missing important signals. The solution is to conduct backtesting optimization to find the best parameter combination for specific markets.
|
||
|
|
|
||
|
|
2. **Correlation Between Indicators**: Some indicators may be highly correlated (such as MACD and price trend), which may lead to signal duplication, reducing the effectiveness of multi-dimensional analysis. The solution is to introduce alternative indicators with lower correlation, such as relative volatility index or money flow indicators.
|
||
|
|
|
||
|
|
3. **Market Environment Dependency**: This strategy performs better in markets with clear trends but may produce frequent false signals in sideways consolidation or rapidly reversing markets. The solution is to add a market environment judgment component to adjust strategy parameters or pause trading in different market states.
|
||
|
|
|
||
|
|
4. **Fixed Threshold Limitations**: The strategy uses fixed thresholds (such as RSI's 30/70) to judge signals, which may not be flexible enough in different market environments. The solution is to adopt adaptive thresholds, such as dynamically adjusting indicator thresholds based on historical volatility or market conditions.
|
||
|
|
|
||
|
|
5. **Lack of Stop-Loss Mechanism**: There is no explicit stop-loss strategy in the code, which may lead to continuous losses after incorrect signals. The solution is to add a stop-loss mechanism based on ATR or a fixed percentage to protect capital safety.
|
||
|
|
|
||
|
|
6. **Data Lag Issue**: Most technical indicators are lagging indicators, which may lead to suboptimal entry points. The solution is to add some leading indicators or price action analysis to capture market turning points in advance.
|
||
|
|
|
||
|
|
#### Strategy Optimization Directions
|
||
|
|
|
||
|
|
Analyzing the code structure and logic of this strategy, the following optimization directions worth exploring can be proposed:
|
||
|
|
|
||
|
|
1. **Adaptive Indicator Parameters**: The current strategy uses fixed parameters, which can be optimized to automatically adjust parameters based on market volatility. For example, increasing the Bollinger Band multiplier or extending the RSI period in highly volatile markets will make the strategy better adapt to different market environments and improve stability.
|
||
|
|
|
||
|
|
2. **Weighted Signal System**: The current strategy assigns equal weight to all indicators, which can be optimized to assign different weights based on the performance of each indicator in the current market environment. For example, increasing the weight of MACD and price trend in trending markets, and increasing the weight of RSI and Bollinger Bands in oscillating markets, will improve signal accuracy.
|
||
|
|
|
||
|
|
3. **Timeframe Coordination**: Introducing multi-timeframe analysis, requiring consistent signals from both short-term and long-term timeframes before executing trades. This optimization can filter out more noise signals and capture more reliable trend changes.
|
||
|
|
|
||
|
|
4. **Dynamic Take-Profit and Stop-Loss**: Adding a dynamic take-profit and stop-loss mechanism based on ATR or Bollinger Band width, automatically adjusting risk control parameters in different volatility environments, will greatly improve the strategy's risk-reward ratio.
|
||
|
|
|
||
|
|
5. **Market Environment Classification**: Adding a market environment recognition module to use different trading logic or parameter settings in different types of markets (trending, oscillating, violent), will reduce the risk of trading in unsuitable market environments.
|
||
|
|
|
||
|
|
6. **Machine Learning Integration**: Using machine learning algorithms to optimize the weights and thresholds of various indicators, automatically finding the best combination based on historical data. This method can overcome the limitations of manual parameter settings and uncover more complex market patterns.
|
||
|
|
|
||
|
|
7. **Additional Auxiliary Filtering Conditions**: Introducing auxiliary tools such as volume balance indicators and market volatility cycle analysis to further improve signal quality. Particularly adding filters for major economic data releases or important events to avoid trading during high-risk periods.
|
||
|
|
|
||
|
|
#### Conclusion
|
||
|
|
|
||
|
|
The Multi-Indicator Composite Multi-Dimensional Decision Trading System is a comprehensive quantitative strategy that integrates multiple technical analysis tools. By requiring confirmation from multiple indicators, this strategy effectively filters market noise and improves the reliability of trading signals. Its core advantages lie in its multi-dimensional analysis framework and information transparency, allowing traders to make more objective decisions based on multifaceted data.
|
||
|
|
|
||
|
|
However, the strategy also faces challenges such as parameter sensitivity, indicator correlation, and market adaptability. Through introducing adaptive parameters, weighted signal systems, multi-timeframe coordination, and dynamic risk management, the performance of the strategy can be significantly improved.
|
||
|
|
|
||
|
|
Ultimately, the value of this strategy lies in providing a solid quantitative trading framework that traders can customize based on personal risk preferences and market understanding. For investors seeking systematic, rule-based trading methods, this is a strategy template worth studying and implementing.[/trans]
|
||
|
|
|
||
|
|
|
||
|
|
|
||
|
|
> Source (PineScript)
|
||
|
|
|
||
|
|
``` pinescript
|
||
|
|
/*backtest
|
||
|
|
start: 2024-03-15 18:40:00
|
||
|
|
end: 2024-12-21 00:00:00
|
||
|
|
period: 2h
|
||
|
|
basePeriod: 2h
|
||
|
|
exchanges: [{"eid":"Binance","currency":"ETH_USDT"}]
|
||
|
|
*/
|
||
|
|
|
||
|
|
//@version=6
|
||
|
|
strategy("3/5 Indicator Strategy with Table", overlay=true, default_qty_type=strategy.percent_of_equity, default_qty_value=15, commission_type=strategy.commission.percent, commission_value=0.075)
|
||
|
|
|
||
|
|
// —————— Input Parameters —————— //
|
||
|
|
rsiLength = input.int(18, "RSI Length", minval=1)
|
||
|
|
macdFast = input.int(12, "MACD Fast", minval=1)
|
||
|
|
macdSlow = input.int(26, "MACD Slow", minval=1)
|
||
|
|
macdSignal = input.int(9, "MACD Signal", minval=1)
|
||
|
|
bbLength = input.int(20, "BB Length", minval=1)
|
||
|
|
bbMult = input.float(2.5, "BB Multiplier", minval=0.1)
|
||
|
|
|
||
|
|
// —————— Indicator Calculations ——————
|
||
|
|
// Bollinger Bands
|
||
|
|
bbBasis = ta.sma(close, bbLength)
|
||
|
|
dev = bbMult * ta.stdev(close, bbLength)
|
||
|
|
upperBB = bbBasis + dev
|
||
|
|
lowerBB = bbBasis - dev
|
||
|
|
|
||
|
|
// MACD
|
||
|
|
[macdLine, signalLine, histLine] = ta.macd(close, macdFast, macdSlow, macdSignal)
|
||
|
|
|
||
|
|
// RSI
|
||
|
|
rsi = ta.rsi(close, rsiLength)
|
||
|
|
|
||
|
|
// —————— Indicator Conditions ——————
|
||
|
|
rsiBullish = rsi < 30
|
||
|
|
rsiBearish = rsi > 70
|
||
|
|
|
||
|
|
macdBullish = macdLine > signalLine
|
||
|
|
macdBearish = macdLine < signalLine
|
||
|
|
|
||
|
|
bbBullish = close > lowerBB and close < upperBB
|
||
|
|
bbBearish = close < lowerBB
|
||
|
|
|
||
|
|
volumeBullish = volume > ta.sma(volume, 20)
|
||
|
|
volumeBearish = volume < ta.sma(volume, 20)
|
||
|
|
|
||
|
|
priceTrendBullish = close > ta.sma(close, 50)
|
||
|
|
priceTrendBearish = close < ta.sma(close, 50)
|
||
|
|
|
||
|
|
// —————— Signal Logic ——————
|
||
|
|
bullishSignals = ( (rsiBullish ? 1 : 0) + (macdBullish ? 1 : 0) + (bbBullish ? 1 : 0) + (volumeBullish ? 1 : 0) + (priceTrendBullish ? 1 : 0))
|
||
|
|
|
||
|
|
bearishSignals = ( (rsiBearish ? 1 : 0) + (macdBearish ? 1 : 0) + (bbBearish ? 1 : 0) + (volumeBearish ? 1 : 0) + (priceTrendBearish ? 1 : 0))
|
||
|
|
|
||
|
|
longCondition = bullishSignals >= 3
|
||
|
|
shortCondition = bearishSignals >= 3
|
||
|
|
|
||
|
|
// —————— Status Table ——————
|
||
|
|
var table statusTable = table.new(position.top_right, 2, 6, border_width=1)
|
||
|
|
if barstate.islastconfirmedhistory
|
||
|
|
// Clear previous data
|
||
|
|
table.cell(statusTable, 0, 0, "Indicator", text_size=size.small, bgcolor=color.gray)
|
||
|
|
table.cell(statusTable, 1, 0, "Status", text_size=size.small, bgcolor=color.gray)
|
||
|
|
|
||
|
|
// RSI Status
|
||
|
|
table.cell(statusTable, 0, 1, "RSI", text_size=size.small)
|
||
|
|
table.cell(statusTable, 1, 1, rsiBullish ? "Bullish" : "Bearish",
|
||
|
|
text_color=rsiBullish ? color.green : color.red, text_size=size.small)
|
||
|
|
|
||
|
|
// MACD Status
|
||
|
|
table.cell(statusTable, 0, 2, "MACD", text_size=size.small)
|
||
|
|
table.cell(statusTable, 1, 2, macdBullish ? "Bullish" : "Bearish",
|
||
|
|
text_color=macdBullish ? color.green : color.red, text_size=size.small)
|
||
|
|
|
||
|
|
// Bollinger Bands Status
|
||
|
|
table.cell(statusTable, 0, 3, "BBands", text_size=size.small)
|
||
|
|
table.cell(statusTable, 1, 3, bbBullish ? "Bullish" : "Bearish",
|
||
|
|
text_color=bbBullish ? color.green : color.red, text_size=size.small)
|
||
|
|
|
||
|
|
// Volume Status
|
||
|
|
table.cell(statusTable, 0, 4, "Volume", text_size=size.small)
|
||
|
|
table.cell(statusTable, 1, 4, volumeBullish ? "Bullish" : "Bearish",
|
||
|
|
text_color=volumeBullish ? color.green : color.red, text_size=size.small)
|
||
|
|
|
||
|
|
// Trend Status
|
||
|
|
table.cell(statusTable, 0, 5, "Trend", text_size=size.small)
|
||
|
|
table.cell(statusTable, 1, 5, priceTrendBullish ? "Bullish" : "Bearish",
|
||
|
|
text_color=priceTrendBullish ? color.green : color.red, text_size=size.small)
|
||
|
|
|
||
|
|
// —————— Strategy Execution ——————
|
||
|
|
if longCondition
|
||
|
|
strategy.entry("Long", strategy.long)
|
||
|
|
|
||
|
|
if shortCondition
|
||
|
|
strategy.entry("Short", strategy.short)
|
||
|
|
|
||
|
|
// —————— Simplified Plots ——————
|
||
|
|
plot(bbBasis, "BB Basis", #2962FF)
|
||
|
|
plot(upperBB, "BB Upper", color.red)
|
||
|
|
plot(lowerBB, "BB Lower", color.green)
|
||
|
|
plot(ta.sma(close, 50), "50 SMA", color.orange)
|
||
|
|
|
||
|
|
// —————— Signal Markers ——————
|
||
|
|
plotshape(longCondition, "Buy", shape.labelup, location.belowbar, color=color.new(color.green, 0), text="BUY", textcolor=color.white)
|
||
|
|
plotshape(shortCondition, "Sell", shape.labeldown, location.abovebar, color=color.new(color.red, 0), text="SELL", textcolor=color.white)
|
||
|
|
```
|
||
|
|
|
||
|
|
> Detail
|
||
|
|
|
||
|
|
https://www.fmz.com/strategy/483935
|
||
|
|
|
||
|
|
> Last Modified
|
||
|
|
|
||
|
|
2025-02-27 09:41:04
|