281 lines
21 KiB
Markdown
281 lines
21 KiB
Markdown

|
|
||
|
|
> Name
|
||
|
|
|
||
|
|
多指标共识策略优化型趋势交易系统结合流动性加权超趋势趋势信号和增强型波浪指标-Multi-Indicator-Consensus-Trend-Trading-System-Combining-Liquidity-Weighted-Supertrend-Trend-Signals-and-Enhanced-Wavetrend-Oscillator
|
||
|
|
|
||
|
|
> Author
|
||
|
|
|
||
|
|
ianzeng123
|
||
|
|
|
||
|
|
> Strategy Description
|
||
|
|
|
||
|
|
|
||
|
|
|
||
|
|
|
||
|
|
|
||
|
|
|
||
|
|
[trans]
|
||
|
|
|
||
|
|
#### 概述
|
||
|
|
|
||
|
|
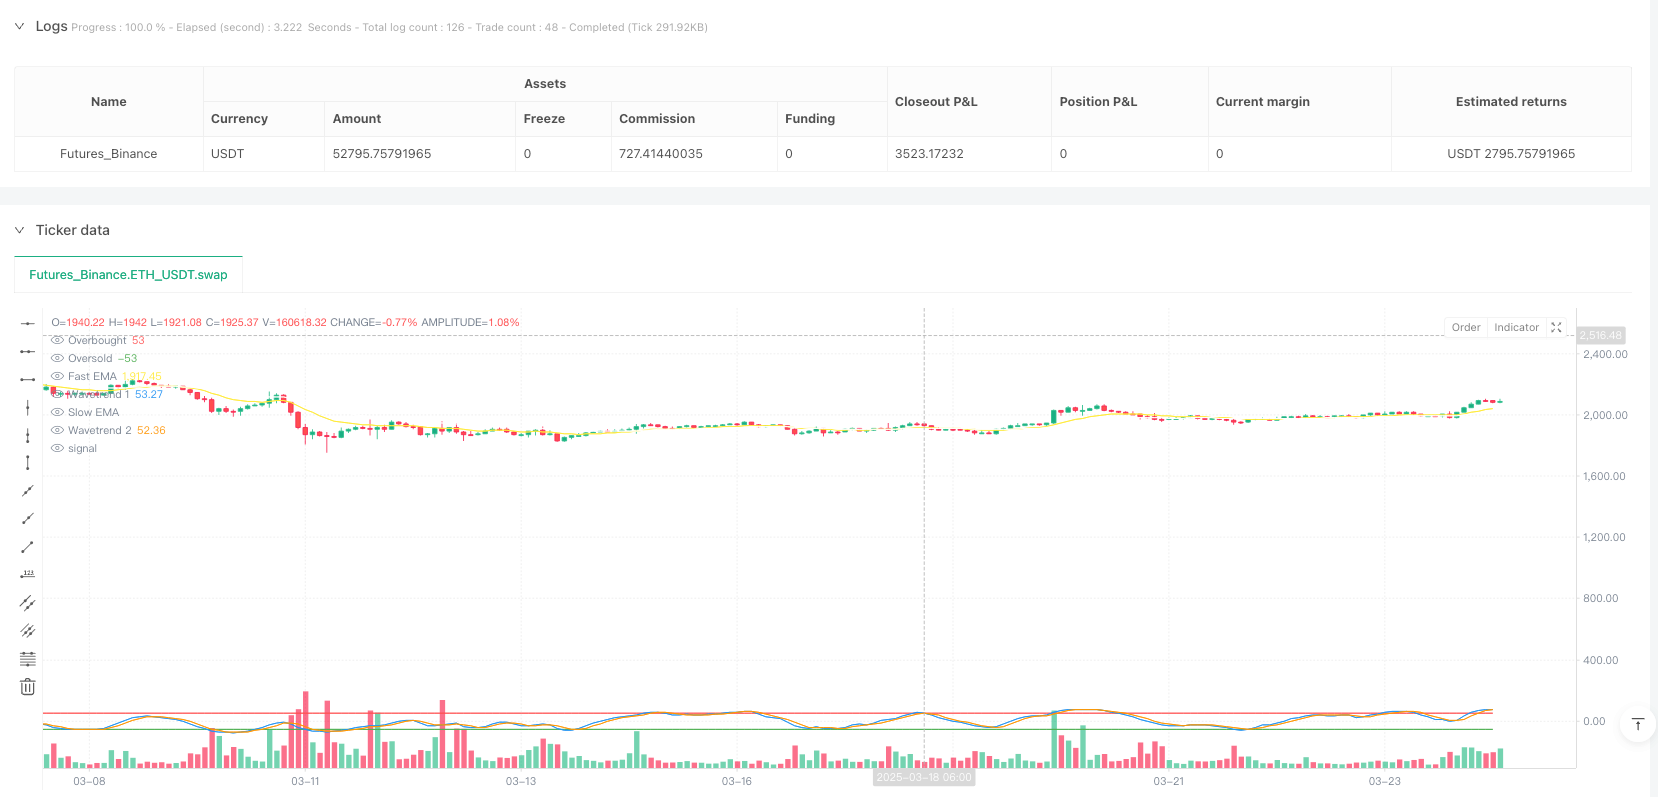
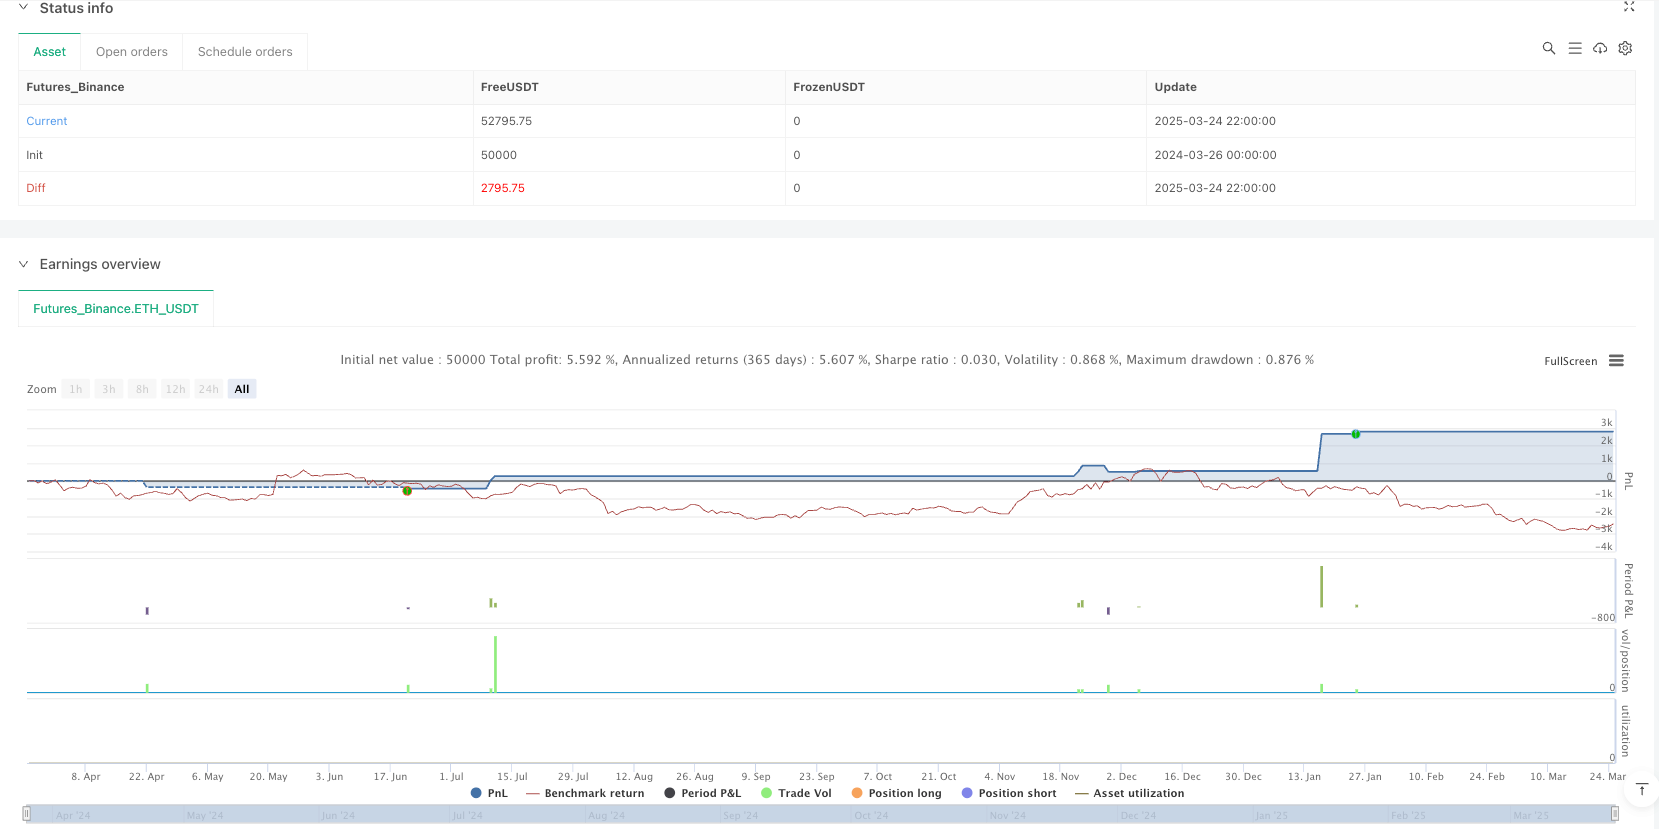
本策略是一种多指标共识型交易系统,通过结合三个强大的技术指标来优化交易决策:流动性加权超趋势(LWST)、双均线趋势信号系统以及增强型波浪指标。该策略的核心思想是只有当至少两个指标达成共识时才执行交易,这种方法显著降低了假信号的风险。该系统同时支持做多和做空操作,并配备了完整的风险管理机制,包括止损和止盈功能,以保护交易资本。
|
||
|
|
|
||
|
|
#### 策略原理
|
||
|
|
|
||
|
|
该策略的工作原理基于三个独立但相互补充的技术指标系统:
|
||
|
|
|
||
|
|
1. **流动性加权超趋势(LWST)**:这是对传统超趋势指标的创新改进,它融合了市场流动性因素。系统首先计算交易量的简单移动平均线(SMA),然后使用当前交易量与SMA的比率创建一个动态的流动性权重。这个权重应用于真实波幅(ATR)计算,从而形成上下轨道带。价格突破这些轨道带时,会产生趋势信号,该信号被简化为正值(1)表示上涨趋势,负值(-1)表示下跌趋势。
|
||
|
|
|
||
|
|
2. **双均线趋势信号系统**:该系统使用两条指数移动平均线(EMA)来识别市场趋势。它计算快速EMA和慢速EMA(周期为快速EMA的两倍)之间的百分比差异。当这个差异超过用户设定的阈值时,系统会产生相应的趋势信号。
|
||
|
|
|
||
|
|
3. **增强型波浪指标**:这是一种振荡器,用于识别市场的超买和超卖状态。它通过计算多个技术组件来构建,包括典型价格(hlc3)、指数移动平均线(EMA)、波动性测量以及最终的波浪指标值。当指标超过预设的超买/超卖阈值时,系统会产生交易信号。
|
||
|
|
|
||
|
|
策略的核心在于"共识机制",它统计三个指标中有多少个产生了看涨信号。当至少两个指标达成共识(即产生相同方向的信号)时,系统才会执行交易。这极大地减少了单一指标可能导致的假信号风险。
|
||
|
|
|
||
|
|
#### 策略优势
|
||
|
|
|
||
|
|
1. **多重确认机制**:策略要求至少两个指标共同确认交易信号,这显著降低了假信号的风险,提高了交易的准确性。
|
||
|
|
|
||
|
|
2. **流动性适应性**:通过将交易量因素纳入超趋势计算,策略能够根据市场的流动性状况动态调整灵敏度,使其更适应不同的市场环境。
|
||
|
|
|
||
|
|
3. **全面的市场覆盖**:三个指标分别覆盖了趋势跟踪、动量分析和超买/超卖判断,从多个维度分析市场,提供更全面的市场视角。
|
||
|
|
|
||
|
|
4. **内置风险管理**:策略包含了止损和止盈功能,可以根据用户设定的百分比自动计算止损和止盈位置,有效控制每笔交易的风险。
|
||
|
|
|
||
|
|
5. **可视化界面**:代码实现了详细的图形界面,包括信号标记、指标线条以及实时信息表格,方便交易者直观地理解和监控策略运行状况。
|
||
|
|
|
||
|
|
6. **高度定制性**:策略提供了多个参数设置选项,允许交易者根据自己的风险偏好和市场观点进行调整,以适应不同的交易风格和市场条件。
|
||
|
|
|
||
|
|
#### 策略风险
|
||
|
|
|
||
|
|
1. **参数敏感性**:策略性能高度依赖于参数设置。不同的市场环境可能需要不同的参数组合,错误的参数设置可能导致过度交易或错失机会。为减轻这一风险,建议在实盘交易前进行充分的回测和参数优化。
|
||
|
|
|
||
|
|
2. **市场适应性限制**:尽管策略融合了多个指标,但在某些特定市场条件下(如极端波动或区间震荡)仍可能表现不佳。解决方法是增加市场环境过滤器,只在适合的市场环境中激活策略。
|
||
|
|
|
||
|
|
3. **信号延迟**:由于策略依赖于多个指标达成共识,可能会导致信号产生延迟,错过最佳入场点。这可以通过调整各个指标的参数来平衡灵敏度和可靠性。
|
||
|
|
|
||
|
|
4. **止损风险**:固定百分比的止损可能在高波动性市场中过于紧密,导致被轻易触发。建议实施动态止损机制,根据市场波动性自动调整止损距离。
|
||
|
|
|
||
|
|
5. **过度依赖技术指标**:策略完全依赖技术指标,忽略了基本面和市场情绪等因素。可以考虑融合一些基本面过滤器或市场情绪指标来增强策略的鲁棒性。
|
||
|
|
|
||
|
|
#### 策略优化方向
|
||
|
|
|
||
|
|
1. **自适应参数系统**:实现一个能够根据市场条件自动调整参数的系统。例如,可以根据市场波动性自动调整ATR乘数和止损百分比,使策略更好地适应不同的市场环境。
|
||
|
|
|
||
|
|
2. **时间过滤器**:增加交易时间过滤功能,避免在市场开盘和收盘时段等波动较大的时间段进行交易,从而减少假信号的影响。
|
||
|
|
|
||
|
|
3. **加权共识机制**:目前的共识机制简单地对三个指标的信号进行计数。可以实现一个加权系统,根据各个指标在不同市场环境下的历史表现分配不同的权重,进一步提高信号的准确性。
|
||
|
|
|
||
|
|
4. **动态止损/止盈**:将固定百分比的止损/止盈改为基于市场波动性的动态计算,如使用ATR的倍数来设置止损距离,这样可以更好地适应市场的实际波动情况。
|
||
|
|
|
||
|
|
5. **市场环境分类**:增加市场环境分类系统,将市场状态分为趋势、震荡和不确定三种,并根据不同的市场环境采用不同的交易策略参数或甚至不同的交易逻辑。
|
||
|
|
|
||
|
|
6. **交易量确认**:增加交易量确认机制,要求交易信号发生时同时伴随有足够的交易量支持,这可以进一步减少假信号的风险。
|
||
|
|
|
||
|
|
#### 总结
|
||
|
|
|
||
|
|
多指标共识策略优化型趋势交易系统是一种集成了流动性加权超趋势、双均线趋势信号和增强型波浪指标的综合性交易策略。通过要求多个指标达成共识才执行交易,该策略显著提高了交易信号的可靠性。同时,它融合了交易量因素,能够根据市场流动性状况动态调整灵敏度,并配备了完整的风险管理机制,为交易者提供了一个相对全面、稳健的交易系统。
|
||
|
|
|
||
|
|
该策略的主要优势在于其多重确认机制和流动性适应性,但也存在参数敏感性和潜在的信号延迟等风险。通过实施自适应参数系统、加权共识机制和动态风险管理等优化措施,可以进一步提升该策略的性能和鲁棒性。总的来说,这是一个设计合理、结构完整的交易系统,适合有一定技术分析基础的交易者使用。 ||
|
||
|
|
|
||
|
|
#### Overview
|
||
|
|
|
||
|
|
This strategy is a multi-indicator consensus trading system that optimizes trading decisions by combining three powerful technical indicators: Liquidity-Weighted Supertrend (LWST), a dual moving average trend signal system, and an Enhanced Wavetrend Oscillator. The core concept is to execute trades only when at least two indicators reach consensus, significantly reducing the risk of false signals. The system supports both long and short operations and comes equipped with comprehensive risk management mechanisms, including stop-loss and take-profit functions to protect trading capital.
|
||
|
|
|
||
|
|
#### Strategy Principles
|
||
|
|
|
||
|
|
The strategy operates based on three independent but complementary technical indicator systems:
|
||
|
|
|
||
|
|
1. **Liquidity-Weighted Supertrend (LWST)**: This is an innovative improvement to the traditional Supertrend indicator that incorporates market liquidity factors. The system first calculates a simple moving average (SMA) of trading volume, then creates a dynamic liquidity weight using the ratio of current volume to the SMA. This weight is applied to the Average True Range (ATR) calculation to form upper and lower bands. When price breaks through these bands, trend signals are generated, simplified to positive values (1) for uptrends and negative values (-1) for downtrends.
|
||
|
|
|
||
|
|
2. **Dual Moving Average Trend Signal System**: This system uses two exponential moving averages (EMAs) to identify market trends. It calculates the percentage difference between a fast EMA and a slow EMA (with a period twice that of the fast EMA). When this difference exceeds a user-defined threshold, the system generates corresponding trend signals.
|
||
|
|
|
||
|
|
3. **Enhanced Wavetrend Oscillator**: This is an oscillator used to identify overbought and oversold market conditions. It is constructed by calculating multiple technical components, including typical price (hlc3), exponential moving averages (EMA), volatility measurements, and final wavetrend indicator values. When the indicator exceeds preset overbought/oversold thresholds, the system generates trading signals.
|
||
|
|
|
||
|
|
The core of the strategy is the "consensus mechanism," which counts how many of the three indicators are generating bullish signals. Trades are only executed when at least two indicators reach consensus (i.e., produce signals in the same direction). This greatly reduces the risk of false signals that might occur with a single indicator.
|
||
|
|
|
||
|
|
#### Strategy Advantages
|
||
|
|
|
||
|
|
1. **Multiple Confirmation Mechanism**: The strategy requires at least two indicators to jointly confirm trading signals, significantly reducing the risk of false signals and improving trading accuracy.
|
||
|
|
|
||
|
|
2. **Liquidity Adaptability**: By incorporating volume factors into the Supertrend calculation, the strategy can dynamically adjust sensitivity based on market liquidity conditions, making it more adaptable to different market environments.
|
||
|
|
|
||
|
|
3. **Comprehensive Market Coverage**: The three indicators respectively cover trend following, momentum analysis, and overbought/oversold judgment, analyzing the market from multiple dimensions and providing a more comprehensive market perspective.
|
||
|
|
|
||
|
|
4. **Built-in Risk Management**: The strategy includes stop-loss and take-profit functions that automatically calculate stop-loss and take-profit levels based on user-defined percentages, effectively controlling the risk of each trade.
|
||
|
|
|
||
|
|
5. **Visual Interface**: The code implements a detailed graphical interface, including signal markers, indicator lines, and real-time information tables, allowing traders to intuitively understand and monitor the strategy's operation.
|
||
|
|
|
||
|
|
6. **High Customizability**: The strategy offers multiple parameter setting options, allowing traders to adjust according to their risk preferences and market views, adapting to different trading styles and market conditions.
|
||
|
|
|
||
|
|
#### Strategy Risks
|
||
|
|
|
||
|
|
1. **Parameter Sensitivity**: Strategy performance is highly dependent on parameter settings. Different market environments may require different parameter combinations, and incorrect parameter settings may lead to overtrading or missed opportunities. To mitigate this risk, it is recommended to conduct thorough backtesting and parameter optimization before live trading.
|
||
|
|
|
||
|
|
2. **Market Adaptability Limitations**: Despite integrating multiple indicators, the strategy may still perform poorly under certain specific market conditions (such as extreme volatility or range-bound markets). The solution is to add market environment filters to activate the strategy only in suitable market environments.
|
||
|
|
|
||
|
|
3. **Signal Delay**: Since the strategy depends on multiple indicators reaching consensus, it may cause signal generation delays, missing optimal entry points. This can be balanced by adjusting the parameters of each indicator to balance sensitivity and reliability.
|
||
|
|
|
||
|
|
4. **Stop-Loss Risk**: Fixed percentage stop-losses may be too tight in highly volatile markets, causing them to be easily triggered. It is recommended to implement dynamic stop-loss mechanisms that automatically adjust stop-loss distances based on market volatility.
|
||
|
|
|
||
|
|
5. **Over-reliance on Technical Indicators**: The strategy completely relies on technical indicators, ignoring fundamental factors and market sentiment. Consider integrating some fundamental filters or market sentiment indicators to enhance the strategy's robustness.
|
||
|
|
|
||
|
|
#### Strategy Optimization Directions
|
||
|
|
|
||
|
|
1. **Adaptive Parameter System**: Implement a system that automatically adjusts parameters based on market conditions. For example, automatically adjust ATR multipliers and stop-loss percentages based on market volatility to better adapt to different market environments.
|
||
|
|
|
||
|
|
2. **Time Filters**: Add trading time filtering functionality to avoid trading during highly volatile periods such as market opening and closing, thereby reducing the impact of false signals.
|
||
|
|
|
||
|
|
3. **Weighted Consensus Mechanism**: Currently, the consensus mechanism simply counts the signals from the three indicators. A weighted system could be implemented, assigning different weights to each indicator based on their historical performance in different market environments, further improving signal accuracy.
|
||
|
|
|
||
|
|
4. **Dynamic Stop-Loss/Take-Profit**: Change fixed percentage stop-loss/take-profit to dynamic calculations based on market volatility, such as using ATR multiples to set stop-loss distances, better adapting to actual market volatility.
|
||
|
|
|
||
|
|
5. **Market Environment Classification**: Add a market environment classification system that categorizes market states as trending, oscillating, or uncertain, and apply different trading strategy parameters or even different trading logic based on different market environments.
|
||
|
|
|
||
|
|
6. **Volume Confirmation**: Add volume confirmation mechanisms requiring sufficient volume support when trading signals occur, further reducing the risk of false signals.
|
||
|
|
|
||
|
|
#### Summary
|
||
|
|
|
||
|
|
The Multi-Indicator Consensus Trend Trading System is a comprehensive trading strategy that integrates Liquidity-Weighted Supertrend, Dual Moving Average Trend Signals, and Enhanced Wavetrend Oscillator. By requiring multiple indicators to reach consensus before executing trades, this strategy significantly improves the reliability of trading signals. Additionally, it incorporates volume factors to dynamically adjust sensitivity based on market liquidity conditions and is equipped with comprehensive risk management mechanisms, providing traders with a relatively comprehensive and robust trading system.
|
||
|
|
|
||
|
|
The strategy's main advantages lie in its multiple confirmation mechanisms and liquidity adaptability, but it also faces risks such as parameter sensitivity and potential signal delays. By implementing adaptive parameter systems, weighted consensus mechanisms, and dynamic risk management, the performance and robustness of this strategy can be further enhanced. Overall, this is a well-designed, structurally complete trading system suitable for traders with a certain foundation in technical analysis.[/trans]
|
||
|
|
|
||
|
|
|
||
|
|
|
||
|
|
> Source (PineScript)
|
||
|
|
|
||
|
|
``` pinescript
|
||
|
|
/*backtest
|
||
|
|
start: 2024-03-26 00:00:00
|
||
|
|
end: 2025-03-25 00:00:00
|
||
|
|
period: 2h
|
||
|
|
basePeriod: 2h
|
||
|
|
exchanges: [{"eid":"Futures_Binance","currency":"ETH_USDT"}]
|
||
|
|
*/
|
||
|
|
|
||
|
|
//@version=5
|
||
|
|
strategy("Multi-Indicator Consensus Strategy", overlay=true, initial_capital=100000, default_qty_type=strategy.percent_of_equity, default_qty_value=100)
|
||
|
|
|
||
|
|
// =================== Input Parameters ===================
|
||
|
|
// Liquidity Weighted Supertrend
|
||
|
|
lwst_period = input.int(10, "LWST Period", minval=1, tooltip="Period for ATR calculation")
|
||
|
|
lwst_multiplier = input.float(3.0, "LWST Multiplier", minval=0.1, tooltip="Multiplier for ATR bands")
|
||
|
|
lwst_length = input.int(20, "Volume SMA Length", minval=1, tooltip="Length for volume SMA")
|
||
|
|
|
||
|
|
// Trend Signals
|
||
|
|
trend_length = input.int(14, "Trend Length", minval=1, tooltip="Length for EMA calculation")
|
||
|
|
trend_threshold = input.float(0.5, "Trend Threshold", minval=0.1, tooltip="Percentage threshold for trend signals")
|
||
|
|
|
||
|
|
// Enhanced Wavetrend
|
||
|
|
wt_channel_length = input.int(9, "WT Channel Length", minval=1, tooltip="Smoothing period for initial calculations")
|
||
|
|
wt_average_length = input.int(12, "WT Average Length", minval=1, tooltip="Smoothing period for final signal")
|
||
|
|
wt_ma_length = input.int(3, "WT MA Length", minval=1, tooltip="Moving average length for signal line")
|
||
|
|
wt_overbought = input.float(53, "WT Overbought", minval=0, tooltip="Level to identify overbought conditions")
|
||
|
|
wt_oversold = input.float(-53, "WT Oversold", minval=-100, tooltip="Level to identify oversold conditions")
|
||
|
|
|
||
|
|
// Risk Management
|
||
|
|
sl_percent = input.float(2.0, "Stop Loss %", minval=0.1, tooltip="Stop loss percentage from entry")
|
||
|
|
tp_percent = input.float(4.0, "Take Profit %", minval=0.1, tooltip="Take profit percentage from entry")
|
||
|
|
|
||
|
|
// =================== Indicator 1: Liquidity Weighted Supertrend ===================
|
||
|
|
// Volume-weighted component for dynamic sensitivity
|
||
|
|
vol_sma = ta.sma(volume, lwst_length)
|
||
|
|
vol_weight = volume / vol_sma
|
||
|
|
|
||
|
|
// ATR-based bands with volume weighting
|
||
|
|
atr = ta.atr(lwst_period)
|
||
|
|
upperBand = hl2 + lwst_multiplier * atr * vol_weight
|
||
|
|
lowerBand = hl2 - lwst_multiplier * atr * vol_weight
|
||
|
|
|
||
|
|
// Trend determination based on price action
|
||
|
|
var float lwst_trend = 0.0
|
||
|
|
lwst_trend := close > lwst_trend[1] ? 1 : close < lwst_trend[1] ? -1 : lwst_trend[1]
|
||
|
|
|
||
|
|
// =================== Indicator 2: Trend Signals ===================
|
||
|
|
// Dual EMA system for trend detection
|
||
|
|
fast_ema = ta.ema(close, trend_length)
|
||
|
|
slow_ema = ta.ema(close, trend_length * 2)
|
||
|
|
trend_diff = (fast_ema - slow_ema) / slow_ema * 100
|
||
|
|
trend_signal = trend_diff > trend_threshold ? 1 : trend_diff < -trend_threshold ? -1 : 0
|
||
|
|
|
||
|
|
// =================== Indicator 3: Enhanced Wavetrend ===================
|
||
|
|
// Calculate Wavetrend components
|
||
|
|
ap = hlc3 // Typical price
|
||
|
|
esa = ta.ema(ap, wt_channel_length) // Smoothed price
|
||
|
|
d = ta.ema(math.abs(ap - esa), wt_channel_length) // Average volatility
|
||
|
|
ci = (ap - esa) / (0.015 * d) // Base oscillator
|
||
|
|
tci = ta.ema(ci, wt_average_length) // Smoothed oscillator
|
||
|
|
|
||
|
|
// Generate main and signal lines
|
||
|
|
wt1 = tci
|
||
|
|
wt2 = ta.sma(wt1, wt_ma_length)
|
||
|
|
|
||
|
|
// Generate Wavetrend Signal based on overbought/oversold conditions
|
||
|
|
wt_signal = 0
|
||
|
|
wt_signal := wt1 > wt_overbought and wt2 > wt_overbought ? -1 :
|
||
|
|
wt1 < wt_oversold and wt2 < wt_oversold ? 1 :
|
||
|
|
wt_signal[1]
|
||
|
|
|
||
|
|
// =================== Consensus Signal Generation ===================
|
||
|
|
// Count bullish signals (1 point for each bullish indicator)
|
||
|
|
var int consensus_count = 0
|
||
|
|
consensus_count := (lwst_trend == 1 ? 1 : 0) +
|
||
|
|
(trend_signal == 1 ? 1 : 0) +
|
||
|
|
(wt_signal == 1 ? 1 : 0)
|
||
|
|
|
||
|
|
// Generate trading signals when majority (2+ indicators) agree
|
||
|
|
bool buy_signal = consensus_count >= 2
|
||
|
|
bool sell_signal = consensus_count <= -2
|
||
|
|
|
||
|
|
// =================== Trade Execution ===================
|
||
|
|
// Long position entry and exit with risk management
|
||
|
|
if (buy_signal and strategy.position_size <= 0)
|
||
|
|
strategy.entry("Long", strategy.long)
|
||
|
|
strategy.exit("Long TP/SL", "Long",
|
||
|
|
profit = close * tp_percent / 100,
|
||
|
|
loss = close * sl_percent / 100)
|
||
|
|
|
||
|
|
// Short position entry and exit with risk management
|
||
|
|
if (sell_signal and strategy.position_size >= 0)
|
||
|
|
strategy.entry("Short", strategy.short)
|
||
|
|
strategy.exit("Short TP/SL", "Short",
|
||
|
|
profit = close * tp_percent / 100,
|
||
|
|
loss = close * sl_percent / 100)
|
||
|
|
|
||
|
|
// =================== Visualization ===================
|
||
|
|
// Signal markers for entry points
|
||
|
|
plotshape(buy_signal ? low : na, "Buy Signal", shape.triangleup, location.belowbar, color.green, size=size.small)
|
||
|
|
plotshape(sell_signal ? high : na, "Sell Signal", shape.triangledown, location.abovebar, color.red, size=size.small)
|
||
|
|
|
||
|
|
// Indicator lines
|
||
|
|
plot(wt1, "Wavetrend 1", color.blue, linewidth=1)
|
||
|
|
plot(wt2, "Wavetrend 2", color.orange, linewidth=1)
|
||
|
|
plot(wt_overbought, "Overbought", color.red, linewidth=1)
|
||
|
|
plot(wt_oversold, "Oversold", color.green, linewidth=1)
|
||
|
|
plot(fast_ema, "Fast EMA", color.yellow, linewidth=1)
|
||
|
|
plot(slow_ema, "Slow EMA", color.white, linewidth=1)
|
||
|
|
plot(lwst_trend == 1 ? upperBand : na, "Upper Band", color.green, linewidth=2)
|
||
|
|
plot(lwst_trend == -1 ? lowerBand : na, "Lower Band", color.red, linewidth=2)
|
||
|
|
|
||
|
|
// =================== Information Table ===================
|
||
|
|
// Real-time display of indicator signals
|
||
|
|
var table info = table.new(position.top_right, 2, 4)
|
||
|
|
table.cell(info, 0, 0, "Indicator", bgcolor=color.gray, text_color=color.white)
|
||
|
|
table.cell(info, 1, 0, "Signal", bgcolor=color.gray, text_color=color.white)
|
||
|
|
table.cell(info, 0, 1, "LWST", text_color=color.white)
|
||
|
|
table.cell(info, 1, 1, str.tostring(lwst_trend), text_color=lwst_trend == 1 ? color.green : color.red)
|
||
|
|
table.cell(info, 0, 2, "Trend", text_color=color.white)
|
||
|
|
table.cell(info, 1, 2, str.tostring(trend_signal), text_color=trend_signal == 1 ? color.green : color.red)
|
||
|
|
table.cell(info, 0, 3, "Wavetrend", text_color=color.white)
|
||
|
|
table.cell(info, 1, 3, str.tostring(wt_signal), text_color=wt_signal == 1 ? color.green : color.red)
|
||
|
|
|
||
|
|
```
|
||
|
|
|
||
|
|
> Detail
|
||
|
|
|
||
|
|
https://www.fmz.com/strategy/488237
|
||
|
|
|
||
|
|
> Last Modified
|
||
|
|
|
||
|
|
2025-03-26 10:57:00
|