181 lines
6.7 KiB
Markdown
181 lines
6.7 KiB
Markdown

|
|
|||
|
|
> Name
|
|||
|
|
|
|||
|
|
多参数交叉趋势动量策略-Multi-Parameter-Crossover-Trend-Momentum-Strategy
|
|||
|
|
|
|||
|
|
> Author
|
|||
|
|
|
|||
|
|
ianzeng123
|
|||
|
|
|
|||
|
|
> Strategy Description
|
|||
|
|
|
|||
|
|
|
|||
|
|
|
|||
|
|
|
|||
|
|
|
|||
|
|
|
|||
|
|
[trans]
|
|||
|
|
|
|||
|
|
#### 概述
|
|||
|
|
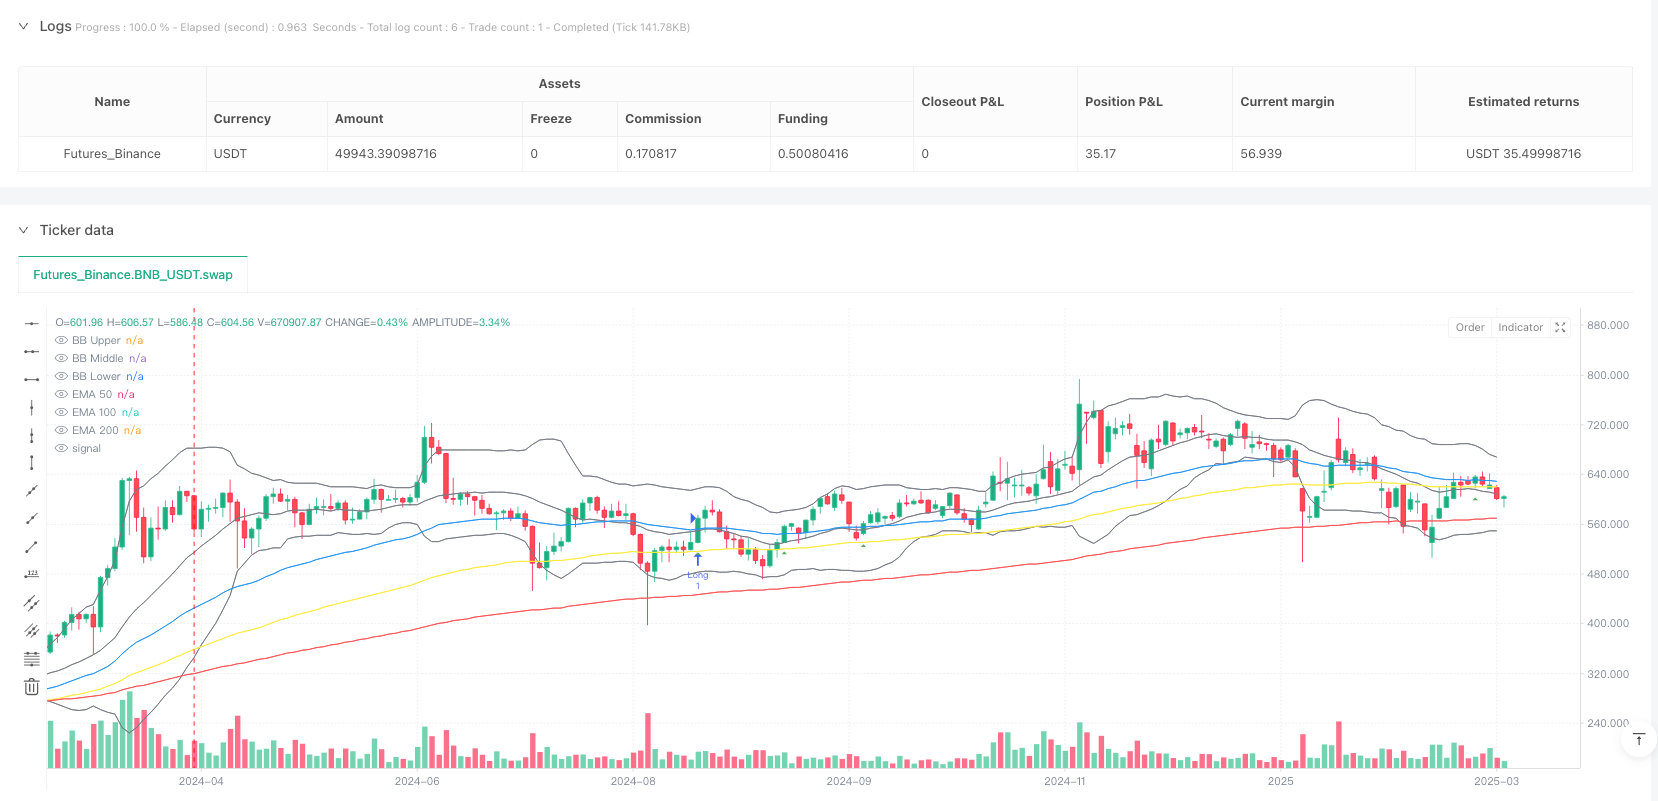
这是一种复杂的多指标交易策略,结合指数移动平均线(EMA)、相对强弱指数(RSI)、移动平均线收敛divergence(MACD)和布林带(Bollinger Bands)四种技术分析工具,旨在通过多重信号验证的方式识别潜在的交易入场点。该策略专注于捕捉趋势性价格运动,并通过严格的信号过滤机制降低错误信号的可能性。
|
|||
|
|
|
|||
|
|
#### 策略原理
|
|||
|
|
策略的核心原理基于四个关键技术指标的综合分析:
|
|||
|
|
1. 使用三条不同周期的指数移动平均线(50、100、200)判断整体趋势方向
|
|||
|
|
2. 利用RSI指标评估市场动量和超买超卖情况
|
|||
|
|
3. 通过MACD线和信号线的交叉判断趋势动量
|
|||
|
|
4. 结合布林带上下轨作为额外的价格波动参考
|
|||
|
|
|
|||
|
|
具体入场逻辑包括:
|
|||
|
|
- 做多条件:
|
|||
|
|
- 收盘价上穿50日EMA
|
|||
|
|
- 50日EMA高于100日EMA,且100日EMA高于200日EMA
|
|||
|
|
- RSI介于50-70之间
|
|||
|
|
- MACD线高于信号线
|
|||
|
|
|
|||
|
|
- 做空条件:
|
|||
|
|
- 收盘价下穿50日EMA
|
|||
|
|
- 50日EMA低于100日EMA,且100日EMA低于200日EMA
|
|||
|
|
- RSI介于30-50之间
|
|||
|
|
- MACD线低于信号线
|
|||
|
|
|
|||
|
|
#### 策略优势
|
|||
|
|
1. 多指标验证:通过四种不同指标的综合,显著提高信号的可靠性
|
|||
|
|
2. 趋势追踪能力强:使用三重EMA结构有效识别市场主导趋势
|
|||
|
|
3. 动量判断精准:RSI和MACD结合提供更精确的入场时机
|
|||
|
|
4. 风险控制:严格的入场条件降低了错误交易的概率
|
|||
|
|
5. 可视化清晰:策略提供清晰的视觉入场信号和趋势指示
|
|||
|
|
|
|||
|
|
#### 策略风险
|
|||
|
|
1. 多重指标复杂性可能导致信号延迟
|
|||
|
|
2. 在震荡市场中可能产生较多无效信号
|
|||
|
|
3. 固定参数可能不适应所有市场环境
|
|||
|
|
4. 未设置止损机制存在潜在较大回撤风险
|
|||
|
|
|
|||
|
|
#### 策略优化方向
|
|||
|
|
1. 引入自适应参数调整机制
|
|||
|
|
2. 增加止损和止盈策略
|
|||
|
|
3. 根据不同市场周期动态调整入场阈值
|
|||
|
|
4. 结合波动率指标进一步验证入场信号
|
|||
|
|
5. 评估并优化指标参数的最佳组合
|
|||
|
|
|
|||
|
|
#### 总结
|
|||
|
|
这是一种高度系统化的多参数交叉趋势动量策略,通过四种技术指标的复合验证,旨在提供更加精准和可靠的交易信号。尽管策略具有显著优势,但仍需要持续优化和风险管理。||
|
|||
|
|
|
|||
|
|
#### Overview
|
|||
|
|
This is a complex multi-indicator trading strategy that combines four technical analysis tools: Exponential Moving Average (EMA), Relative Strength Index (RSI), Moving Average Convergence Divergence (MACD), and Bollinger Bands. The strategy aims to identify potential entry points by verifying signals through multiple indicators, focusing on capturing trend-driven price movements with a strict signal filtering mechanism.
|
|||
|
|
|
|||
|
|
#### Strategy Principle
|
|||
|
|
The core principle is based on comprehensive analysis of four key technical indicators:
|
|||
|
|
1. Using three EMA lines of different periods to determine overall trend direction
|
|||
|
|
2. Using RSI to assess market momentum and overbought/oversold conditions
|
|||
|
|
3. Judging trend momentum through MACD line and signal line crossovers
|
|||
|
|
4. Combining Bollinger Bands upper and lower rails as additional price volatility reference
|
|||
|
|
|
|||
|
|
Specific entry logic includes:
|
|||
|
|
- Long entry conditions:
|
|||
|
|
- Close price crosses above 50-day EMA
|
|||
|
|
- 50-day EMA higher than 100-day EMA, and 100-day EMA higher than 200-day EMA
|
|||
|
|
- RSI between 50-70
|
|||
|
|
- MACD line above signal line
|
|||
|
|
|
|||
|
|
- Short entry conditions:
|
|||
|
|
- Close price crosses below 50-day EMA
|
|||
|
|
- 50-day EMA lower than 100-day EMA, and 100-day EMA lower than 200-day EMA
|
|||
|
|
- RSI between 30-50
|
|||
|
|
- MACD line below signal line
|
|||
|
|
|
|||
|
|
#### Strategy Advantages
|
|||
|
|
1. Multi-indicator verification significantly improves signal reliability
|
|||
|
|
2. Strong trend tracking capability using triple EMA structure
|
|||
|
|
3. Precise momentum judgment through RSI and MACD combination
|
|||
|
|
4. Effective risk control with strict entry conditions
|
|||
|
|
5. Clear visual entry signals and trend indications
|
|||
|
|
|
|||
|
|
#### Strategy Risks
|
|||
|
|
1. Complex multi-indicator approach may cause signal delays
|
|||
|
|
2. Potential multiple invalid signals in range-bound markets
|
|||
|
|
3. Fixed parameters might not adapt to all market environments
|
|||
|
|
4. Lack of stop-loss mechanism risks significant drawdowns
|
|||
|
|
|
|||
|
|
#### Strategy Optimization Directions
|
|||
|
|
1. Introduce adaptive parameter adjustment mechanism
|
|||
|
|
2. Add stop-loss and take-profit strategies
|
|||
|
|
3. Dynamically adjust entry thresholds based on market cycles
|
|||
|
|
4. Incorporate volatility indicators for further signal verification
|
|||
|
|
5. Evaluate and optimize the best combination of indicator parameters
|
|||
|
|
|
|||
|
|
#### Conclusion
|
|||
|
|
This is a highly systematic multi-parameter crossover trend momentum strategy that aims to provide more accurate and reliable trading signals through compound verification of four technical indicators. Despite its significant advantages, continuous optimization and risk management remain crucial.[/trans]
|
|||
|
|
|
|||
|
|
|
|||
|
|
|
|||
|
|
> Source (PineScript)
|
|||
|
|
|
|||
|
|
``` pinescript
|
|||
|
|
/*backtest
|
|||
|
|
start: 2024-04-02 00:00:00
|
|||
|
|
end: 2025-04-01 00:00:00
|
|||
|
|
period: 2d
|
|||
|
|
basePeriod: 2d
|
|||
|
|
exchanges: [{"eid":"Futures_Binance","currency":"BNB_USDT"}]
|
|||
|
|
*/
|
|||
|
|
|
|||
|
|
//@version=5
|
|||
|
|
strategy("Multi-Indicator Trading Strategy", overlay=true)
|
|||
|
|
|
|||
|
|
// Input variables
|
|||
|
|
len1 = input(50, "EMA 50")
|
|||
|
|
len2 = input(100, "EMA 100")
|
|||
|
|
len3 = input(200, "EMA 200")
|
|||
|
|
rsiLength = input(14, "RSI Length")
|
|||
|
|
rsiOverbought = input(70, "RSI Overbought")
|
|||
|
|
rsiOversold = input(30, "RSI Oversold")
|
|||
|
|
|
|||
|
|
// Indicators
|
|||
|
|
ema50 = ta.ema(close, len1)
|
|||
|
|
ema100 = ta.ema(close, len2)
|
|||
|
|
ema200 = ta.ema(close, len3)
|
|||
|
|
rsi = ta.rsi(close, rsiLength)
|
|||
|
|
[macdLine, signalLine, histLine] = ta.macd(close, 12, 26, 9)
|
|||
|
|
[middle, upper, lower] = ta.bb(close, 20, 2)
|
|||
|
|
|
|||
|
|
// Trading signals
|
|||
|
|
longCondition = ta.crossover(close, ema50) and ema50 > ema100 and ema100 > ema200 and rsi > 50 and rsi < rsiOverbought and macdLine > signalLine
|
|||
|
|
|
|||
|
|
shortCondition = ta.crossunder(close, ema50) and
|
|||
|
|
ema50 < ema100 and
|
|||
|
|
ema100 < ema200 and
|
|||
|
|
rsi < 50 and
|
|||
|
|
rsi > rsiOversold and
|
|||
|
|
macdLine < signalLine
|
|||
|
|
|
|||
|
|
// Plots
|
|||
|
|
plot(ema50, "EMA 50", color.blue)
|
|||
|
|
plot(ema100, "EMA 100", color.yellow)
|
|||
|
|
plot(ema200, "EMA 200", color.red)
|
|||
|
|
plot(upper, "BB Upper", color.gray)
|
|||
|
|
plot(middle, "BB Middle", color.gray)
|
|||
|
|
plot(lower, "BB Lower", color.gray)
|
|||
|
|
|
|||
|
|
// Signals
|
|||
|
|
plotshape(longCondition, "Long", shape.triangleup, location.belowbar, color.green)
|
|||
|
|
plotshape(shortCondition, "Short", shape.triangledown, location.abovebar, color.red)
|
|||
|
|
|
|||
|
|
// Strategy
|
|||
|
|
if (longCondition)
|
|||
|
|
strategy.entry("Long", strategy.long)
|
|||
|
|
|
|||
|
|
if (shortCondition)
|
|||
|
|
strategy.entry("Short", strategy.short)
|
|||
|
|
|
|||
|
|
```
|
|||
|
|
|
|||
|
|
> Detail
|
|||
|
|
|
|||
|
|
https://www.fmz.com/strategy/489201
|
|||
|
|
|
|||
|
|
> Last Modified
|
|||
|
|
|
|||
|
|
2025-04-02 16:39:00
|