182 lines
13 KiB
Markdown
182 lines
13 KiB
Markdown

|
|
||
|
|
> Name
|
||
|
|
|
||
|
|
基于9EMA动态仓位的5分钟双收盘价强势突破策略9EMA-Dynamic-Position-Sizing-Strategy-with-Two-5-Minute-Close-Breakouts
|
||
|
|
|
||
|
|
> Author
|
||
|
|
|
||
|
|
ChaoZhang
|
||
|
|
|
||
|
|
> Strategy Description
|
||
|
|
|
||
|
|
|
||
|
|
[trans]
|
||
|
|
|
||
|
|
## 策略概述
|
||
|
|
|
||
|
|
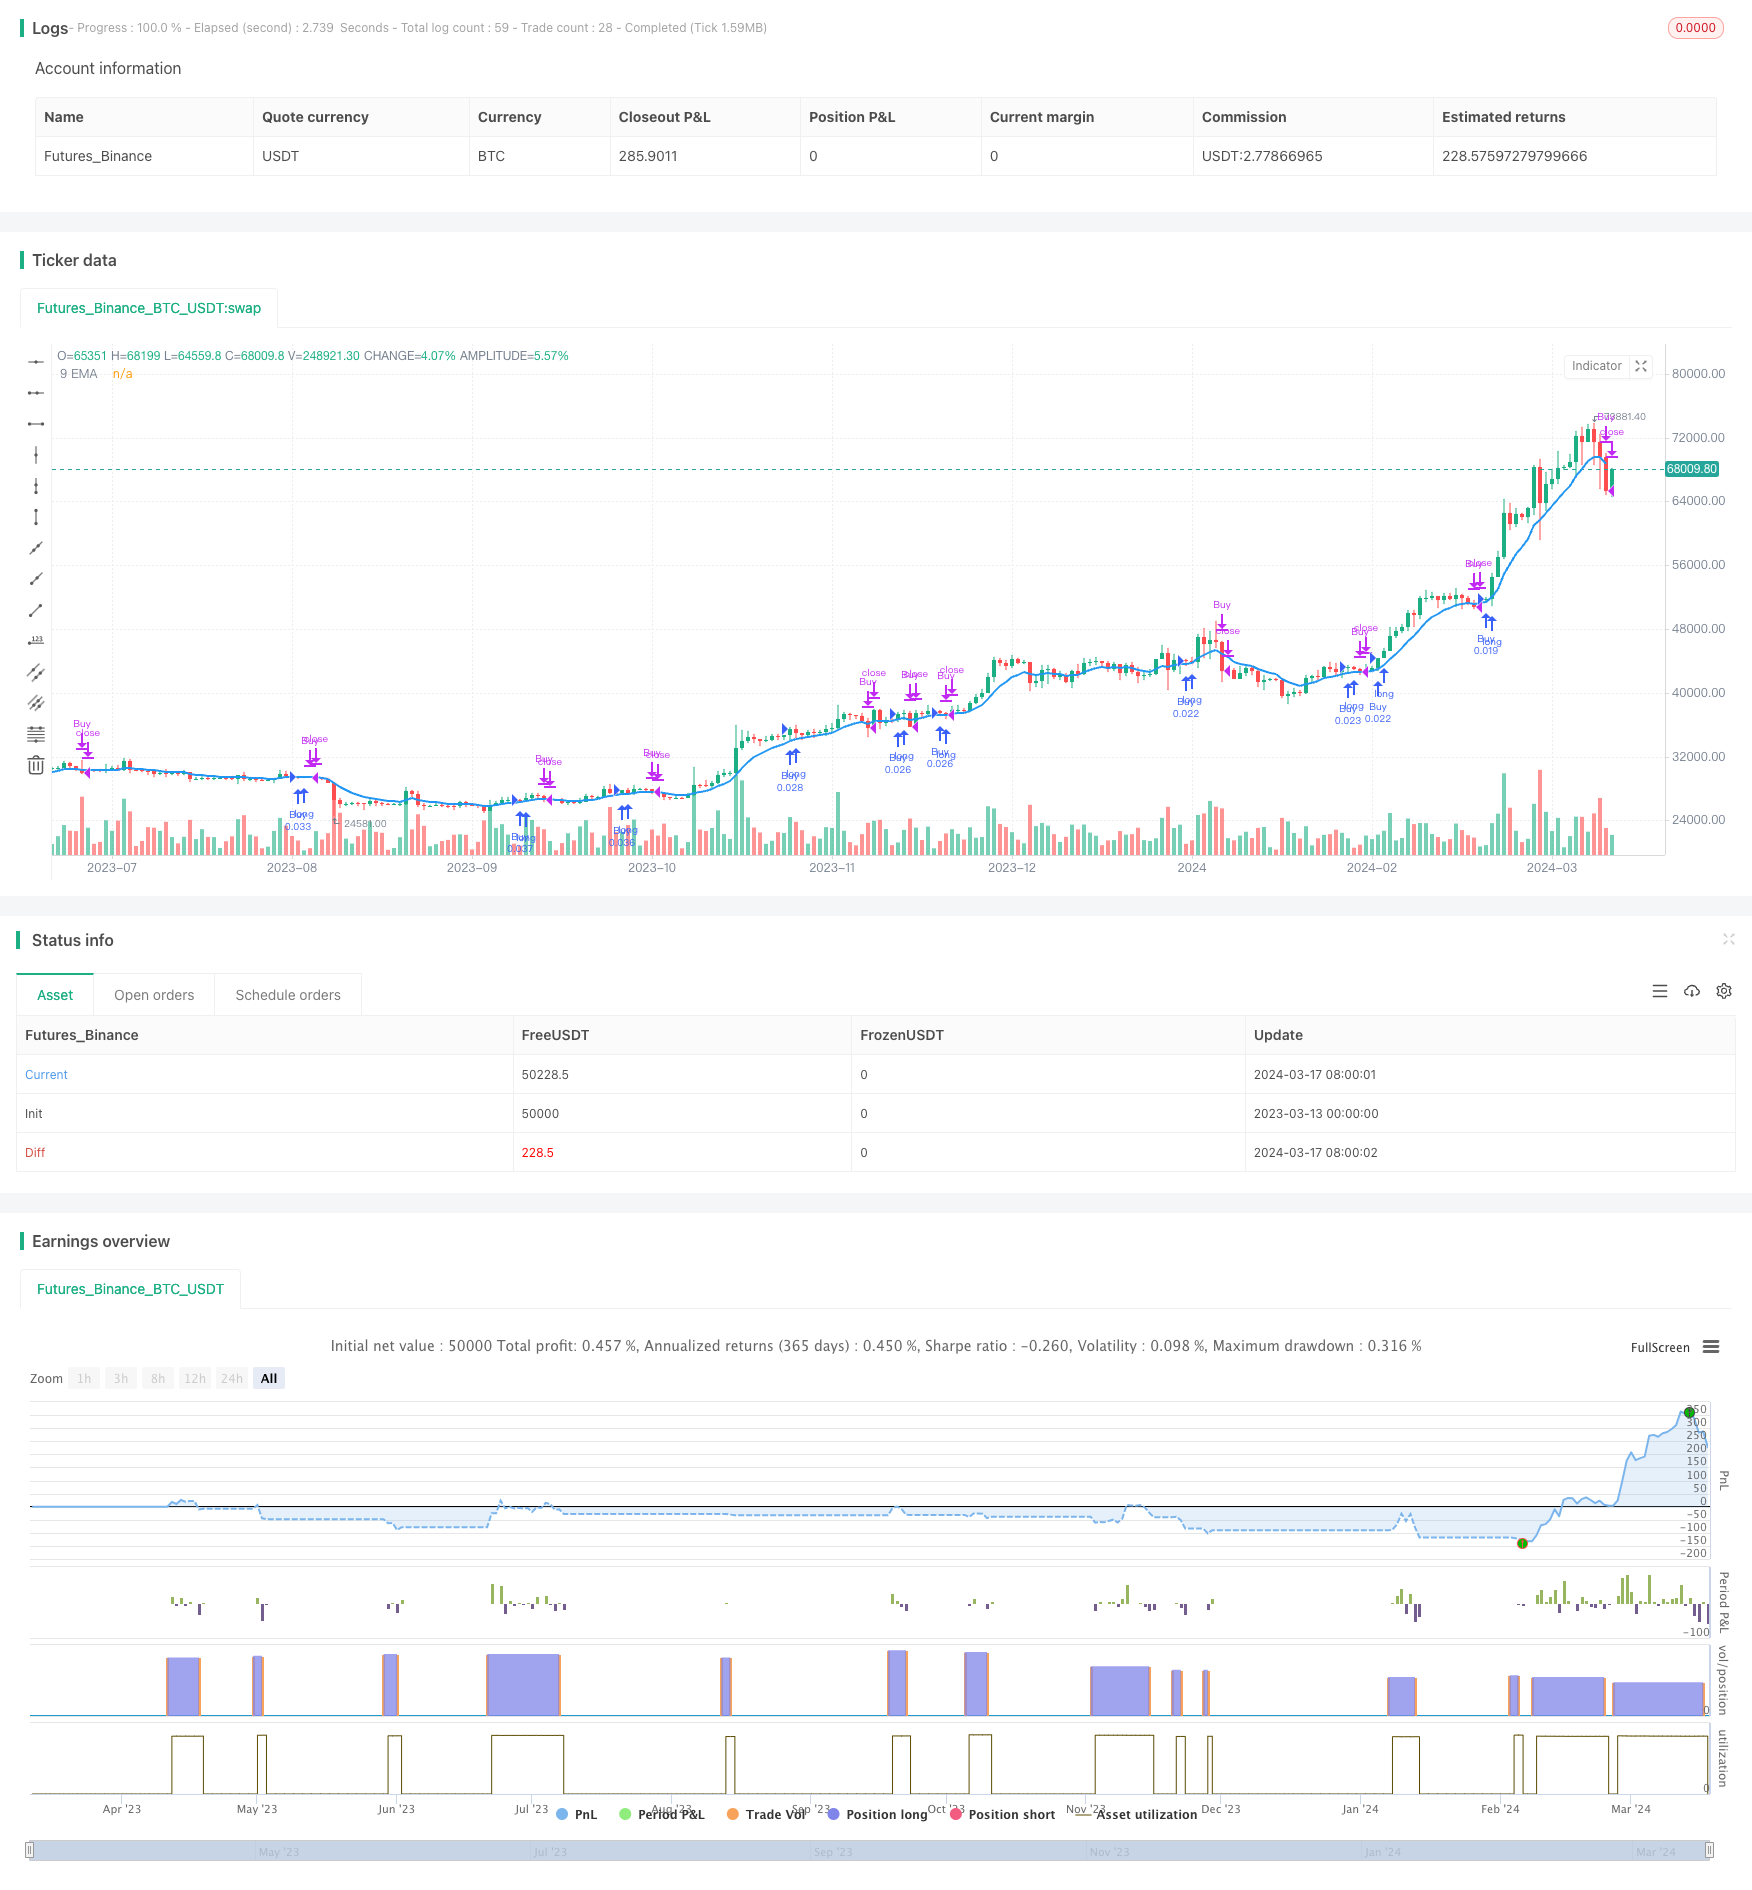
该策略采用9周期指数移动平均线(9EMA)作为趋势判断依据,在交易日开盘10分钟内,如果连续两根5分钟K线的收盘价都非常接近最高价(大于等于最高价的99%),且收盘价位于9EMA之上,则认为出现了强势突破信号,此时以当前收盘价计算仓位大小,开仓做多。持仓直到出现第一根收盘价跌破9EMA的5分钟K线时平仓。
|
||
|
|
|
||
|
|
## 策略原理
|
||
|
|
|
||
|
|
该策略基于以下原理:
|
||
|
|
|
||
|
|
1. 在交易日开盘阶段,如果市场出现强势突破走势,通常意味着后市有望延续强势上涨。
|
||
|
|
2. 9EMA是一个相对敏感的趋势判断指标,价格站上9EMA往往意味着多头占据优势。
|
||
|
|
3. 连续两根K线收盘价都非常接近最高价,说明多头力量强劲,买盘积极性高。
|
||
|
|
4. 在强势趋势出现后,采用固定资金额来确定仓位大小,既可以控制风险,又能充分利用趋势行情。
|
||
|
|
5. 当价格跌破9EMA时,往往意味着趋势出现了转折,此时及时平仓,可以最大限度地保护利润。
|
||
|
|
|
||
|
|
该策略通过捕捉交易日开盘阶段的强势突破行情,以动态仓位的方式参与,力求以较小风险博取较大收益。同时,该策略也采用了严格的止损条件,一旦趋势反转即果断平仓,控制回撤。
|
||
|
|
|
||
|
|
## 策略优势
|
||
|
|
|
||
|
|
1. 交易时间集中在开盘前10分钟,把握早盘行情,交易频率低,可操作性强。
|
||
|
|
2. 采用连续两根K线突破的方式来确认趋势,可以有效过滤假突破,提高信号可靠性。
|
||
|
|
3. 仓位大小根据突破点的价格水平动态调整,可以自动适应不同时期的行情特点,风险可控。
|
||
|
|
4. 止损条件明确,严格执行,可以有效控制单次交易的最大亏损。
|
||
|
|
5. 策略逻辑简单,容易理解和执行,适合大多数交易者使用。
|
||
|
|
|
||
|
|
## 策略风险
|
||
|
|
|
||
|
|
1. 开盘阶段虽然经常出现趋势性机会,但有时也会出现较大的波动和反复,面临一定的假突破风险。
|
||
|
|
2. 策略在连续两根K线满足条件时即开仓,如果开仓后行情出现快速反转,仍有可能面临一定亏损。
|
||
|
|
3. 固定资金额的仓位控制方式虽然简单,但在行情剧烈波动时,策略的收益率波动可能也会较大。
|
||
|
|
4. 该策略只能捕捉到单边上涨行情,对于震荡行情和下跌趋势行情,并不适用。
|
||
|
|
|
||
|
|
针对上述风险,可以考虑从以下方面进行优化和改进:
|
||
|
|
|
||
|
|
1. 加入开盘价与前一日收盘价之间的关系作为过滤条件,提高趋势判断的准确性。
|
||
|
|
2. 优化止损条件,例如加入移动止损或者条件单止损,以进一步降低单次交易的风险敞口。
|
||
|
|
3. 在趋势延续阶段,可以考虑采用金字塔加仓的方法,提高总体收益率。
|
||
|
|
4. 尝试将该策略与其他适用于震荡行情或下跌趋势的策略进行组合,提高策略的适应性。
|
||
|
|
|
||
|
|
## 优化方向
|
||
|
|
|
||
|
|
1. 引入更多有效的趋势判断指标,如MACD、布林带等,综合多个指标来确认趋势信号,提高开仓信号的可靠性,降低假突破风险。
|
||
|
|
2. 对开仓时间窗口进行优化,可以考虑将10分钟的时间窗口缩短至5分钟或者延长至15分钟,通过回测对比,找出最佳的开仓时间。这样可以在把握趋势的同时,尽量降低初期波动的影响。
|
||
|
|
3. 在仓位控制方面,可以考虑引入波动率因子,例如根据ATR(平均真实波动幅度)来动态调整每次开仓的资金比例,在波动较大时减少仓位,波动较小时加大仓位,使策略更好地适应不同的市场节奏。
|
||
|
|
4. 优化止损条件,在保持原有9EMA止损逻辑的基础上,可以加入移动止损策略,即在价格向有利方向移动一定比例后,将止损位上移至成本价或者开仓价附近,从而降低回撤,锁定部分利润。
|
||
|
|
5. 考虑加入一些过滤条件,例如成交量、波动率等,在开仓信号出现时,判断这些指标是否同步向好,以进一步确认趋势的有效性。这样可以帮助策略规避一些陷阱和假信号。
|
||
|
|
|
||
|
|
通过以上优化,该策略有望在趋势捕捉的同时,更好地控制风险,提高策略收益的稳定性和可持续性。当然,任何优化都需要通过严格的回测来验证其有效性,并根据实际情况进行动态调整。
|
||
|
|
|
||
|
|
## 总结
|
||
|
|
|
||
|
|
该策略以9EMA为核心,通过连续两根5分钟K线收盘价强势突破9EMA的方式,在交易日开盘10分钟内捕捉强势上涨行情,并采用固定资金额动态调整仓位的方式进行交易。该策略逻辑简单明了,易于理解和执行,适合大多数交易者使用。同时,该策略也存在一定的局限性和风险,例如对于震荡行情和下跌趋势行情的适应性不足,以及开仓后的快速反转风险等。针对这些问题,可以从趋势判断、仓位控制、止损优化、过滤条件等方面进行改进和优化,使策略能够更好地把握市场机会,控制风险。总的来说,该策略思路清晰,可塑性较强,值得进一步探索和实践。
|
||
|
|
|
||
|
|
||
|
||
|
|
|
||
|
|
## Strategy Overview
|
||
|
|
|
||
|
|
This strategy uses the 9-period Exponential Moving Average (9EMA) as the basis for trend determination. Within the first 10 minutes of the trading day, if there are two consecutive 5-minute candles with closing prices very close to the high (greater than or equal to 99% of the high) and above the 9EMA, it is considered a strong breakout signal. At this point, the position size is calculated based on the current closing price, and a long position is opened. The position is held until the first 5-minute candle with a close below the 9EMA, at which point the position is closed.
|
||
|
|
|
||
|
|
## Strategy Principles
|
||
|
|
|
||
|
|
This strategy is based on the following principles:
|
||
|
|
|
||
|
|
1. During the opening stage of a trading day, if the market shows a strong breakout trend, it usually indicates that the upward trend is likely to continue.
|
||
|
|
2. The 9EMA is a relatively sensitive indicator for trend determination, and prices above the 9EMA often indicate bullish dominance.
|
||
|
|
3. Two consecutive candles with closing prices very close to the high indicate strong bullish momentum and high buying enthusiasm.
|
||
|
|
4. After a strong trend emerges, using a fixed monetary amount to determine position size can both control risk and fully utilize the trend.
|
||
|
|
5. When the price falls below the 9EMA, it often indicates a reversal of the trend. Closing the position at this point can protect profits to the greatest extent.
|
||
|
|
|
||
|
|
This strategy aims to capture strong breakout moves during the opening period of a trading day and participates with dynamic position sizing, seeking to achieve high returns with low risk. At the same time, the strategy also employs strict stop-loss conditions, promptly closing positions once the trend reverses to control drawdowns.
|
||
|
|
|
||
|
|
## Strategy Advantages
|
||
|
|
|
||
|
|
1. Trading is concentrated within the first 10 minutes of the opening, capturing early market moves with low trading frequency and strong operability.
|
||
|
|
2. Using two consecutive candles to confirm the trend can effectively filter out false breakouts and improve signal reliability.
|
||
|
|
3. Position size is dynamically adjusted based on the price level at the breakout point, automatically adapting to the characteristics of different market periods with controllable risk.
|
||
|
|
4. Stop-loss conditions are clear and strictly executed, effectively controlling the maximum loss of a single trade.
|
||
|
|
5. The strategy logic is simple and easy to understand and execute, suitable for most traders to use.
|
||
|
|
|
||
|
|
## Strategy Risks
|
||
|
|
|
||
|
|
1. Although trending opportunities often emerge during the opening period, there can also be significant fluctuations and reversals at times, facing a certain risk of false breakouts.
|
||
|
|
2. The strategy enters a position when two consecutive candles meet the conditions. If the market quickly reverses after entry, there is still a possibility of facing certain losses.
|
||
|
|
3. Although the fixed monetary amount position sizing method is simple, the strategy's return volatility may also be relatively large when the market fluctuates dramatically.
|
||
|
|
4. This strategy can only capture unilateral upward trends and is not suitable for ranging markets or downward trending markets.
|
||
|
|
|
||
|
|
To address the above risks, the following aspects can be considered for optimization and improvement:
|
||
|
|
|
||
|
|
1. Incorporate the relationship between the opening price and the previous day's closing price as a filtering condition to improve the accuracy of trend determination.
|
||
|
|
2. Optimize stop-loss conditions, such as adding trailing stops or conditional stops, to further reduce the risk exposure of a single trade.
|
||
|
|
3. Consider using a pyramid approach to add positions during the trend continuation phase to increase overall returns.
|
||
|
|
4. Try combining this strategy with other strategies suitable for ranging or downward trending markets to improve the adaptability of the strategy.
|
||
|
|
|
||
|
|
## Optimization Directions
|
||
|
|
|
||
|
|
1. Introduce more effective trend determination indicators, such as MACD, Bollinger Bands, etc., to confirm trend signals based on multiple indicators, improving the reliability of entry signals and reducing the risk of false breakouts.
|
||
|
|
2. Optimize the entry time window. Consider shortening the time window from 10 minutes to 5 minutes or extending it to 15 minutes. Through backtesting comparisons, find the optimal entry time. This can capture trends while minimizing the impact of initial fluctuations.
|
||
|
|
3. In terms of position sizing, consider introducing a volatility factor. For example, dynamically adjust the percentage of funds for each entry based on the Average True Range (ATR). Decrease position size when volatility is high and increase position size when volatility is low, allowing the strategy to better adapt to different market rhythms.
|
||
|
|
4. Optimize stop-loss conditions. While maintaining the original 9EMA stop-loss logic, a trailing stop strategy can be added. That is, after the price moves in a favorable direction by a certain percentage, move the stop-loss level to near the cost price or entry price, thereby reducing drawdowns and locking in partial profits.
|
||
|
|
5. Consider adding some filtering conditions, such as trading volume, volatility, etc. When an entry signal appears, determine whether these indicators are simultaneously favorable to further confirm the validity of the trend. This can help the strategy avoid some traps and false signals.
|
||
|
|
|
||
|
|
Through the above optimizations, the strategy is expected to better control risks while capturing trends, improving the stability and sustainability of strategy returns. Of course, any optimization needs to be validated through rigorous backtesting and dynamically adjusted based on actual conditions.
|
||
|
|
|
||
|
|
## Summary
|
||
|
|
|
||
|
|
This strategy uses the 9EMA as the core and captures strong upward trends within the first 10 minutes of a trading day by having two consecutive 5-minute candles with closing prices strongly breaking above the 9EMA. It trades using a fixed monetary amount to dynamically adjust position size. The strategy logic is simple and straightforward, easy to understand and execute, and suitable for most traders to use. At the same time, the strategy also has certain limitations and risks, such as insufficient adaptability to ranging markets and downward trending markets, as well as the risk of rapid reversals after opening positions. To address these issues, improvements and optimizations can be made in terms of trend determination, position sizing, stop-loss optimization, filtering conditions, etc., to enable the strategy to better capture market opportunities and control risks. Overall, this strategy has a clear thought process and strong plasticity, and is worth further exploration and practice.
|
||
|
|
|
||
|
|
[/trans]
|
||
|
|
|
||
|
|
|
||
|
|
|
||
|
|
> Source (PineScript)
|
||
|
|
|
||
|
|
``` pinescript
|
||
|
|
/*backtest
|
||
|
|
start: 2023-03-13 00:00:00
|
||
|
|
end: 2024-03-18 00:00:00
|
||
|
|
period: 1d
|
||
|
|
basePeriod: 1h
|
||
|
|
exchanges: [{"eid":"Futures_Binance","currency":"BTC_USDT"}]
|
||
|
|
*/
|
||
|
|
|
||
|
|
//@version=5
|
||
|
|
strategy("Two 5min Closes Above 9EMA Strategy with Dynamic Position Size", overlay=true)
|
||
|
|
|
||
|
|
// Define the fixed amount for position sizing
|
||
|
|
fixedAmount = 1000
|
||
|
|
|
||
|
|
// Calculate the 9-period EMA
|
||
|
|
ema9 = ta.ema(close, 9)
|
||
|
|
|
||
|
|
// Define time constraints (9:30 AM to 9:40 AM EST, adjust for your timezone)
|
||
|
|
sessionStart = 0930
|
||
|
|
sessionEnd = 0940
|
||
|
|
timeCondition = (hour * 100 + minute) >= sessionStart and (hour * 100 + minute) < sessionEnd
|
||
|
|
|
||
|
|
// Detect two consecutive 5-min bars where close is near 0.99 times the high and above 9 EMA
|
||
|
|
closeNearHighAndAboveEMA = close >= high * 0.99 and close > ema9
|
||
|
|
twoConsecutiveBars = closeNearHighAndAboveEMA and closeNearHighAndAboveEMA[1]
|
||
|
|
|
||
|
|
// Entry condition: Within the first 10 minutes of the day and two consecutive bars match criteria
|
||
|
|
entryCondition = twoConsecutiveBars
|
||
|
|
|
||
|
|
// Exit condition: First 5-min close below 9 EMA after entry
|
||
|
|
exitCondition = close < ema9
|
||
|
|
|
||
|
|
// Plot EMA for visualization
|
||
|
|
plot(ema9, color=color.blue, linewidth=2, title="9 EMA")
|
||
|
|
|
||
|
|
// Calculate position size
|
||
|
|
positionSize = fixedAmount / close
|
||
|
|
|
||
|
|
// Strategy execution
|
||
|
|
if (entryCondition)
|
||
|
|
strategy.entry("Buy", strategy.long, qty=positionSize)
|
||
|
|
|
||
|
|
if (exitCondition)
|
||
|
|
strategy.close("Buy")
|
||
|
|
|
||
|
|
```
|
||
|
|
|
||
|
|
> Detail
|
||
|
|
|
||
|
|
https://www.fmz.com/strategy/445449
|
||
|
|
|
||
|
|
> Last Modified
|
||
|
|
|
||
|
|
2024-03-19 15:03:56
|