191 lines
10 KiB
Markdown
191 lines
10 KiB
Markdown

|
|
||
|
|
> Name
|
||
|
|
|
||
|
|
基于布林带移动平均线和相对强弱指数的短线交易策略-Short-Term-Trading-Strategy-Based-on-Bollinger-Bands-Moving-Average-and-RSI
|
||
|
|
|
||
|
|
> Author
|
||
|
|
|
||
|
|
ChaoZhang
|
||
|
|
|
||
|
|
> Strategy Description
|
||
|
|
|
||
|
|
|
||
|
|
|
||
|
|
[trans]
|
||
|
|
#### 概述
|
||
|
|
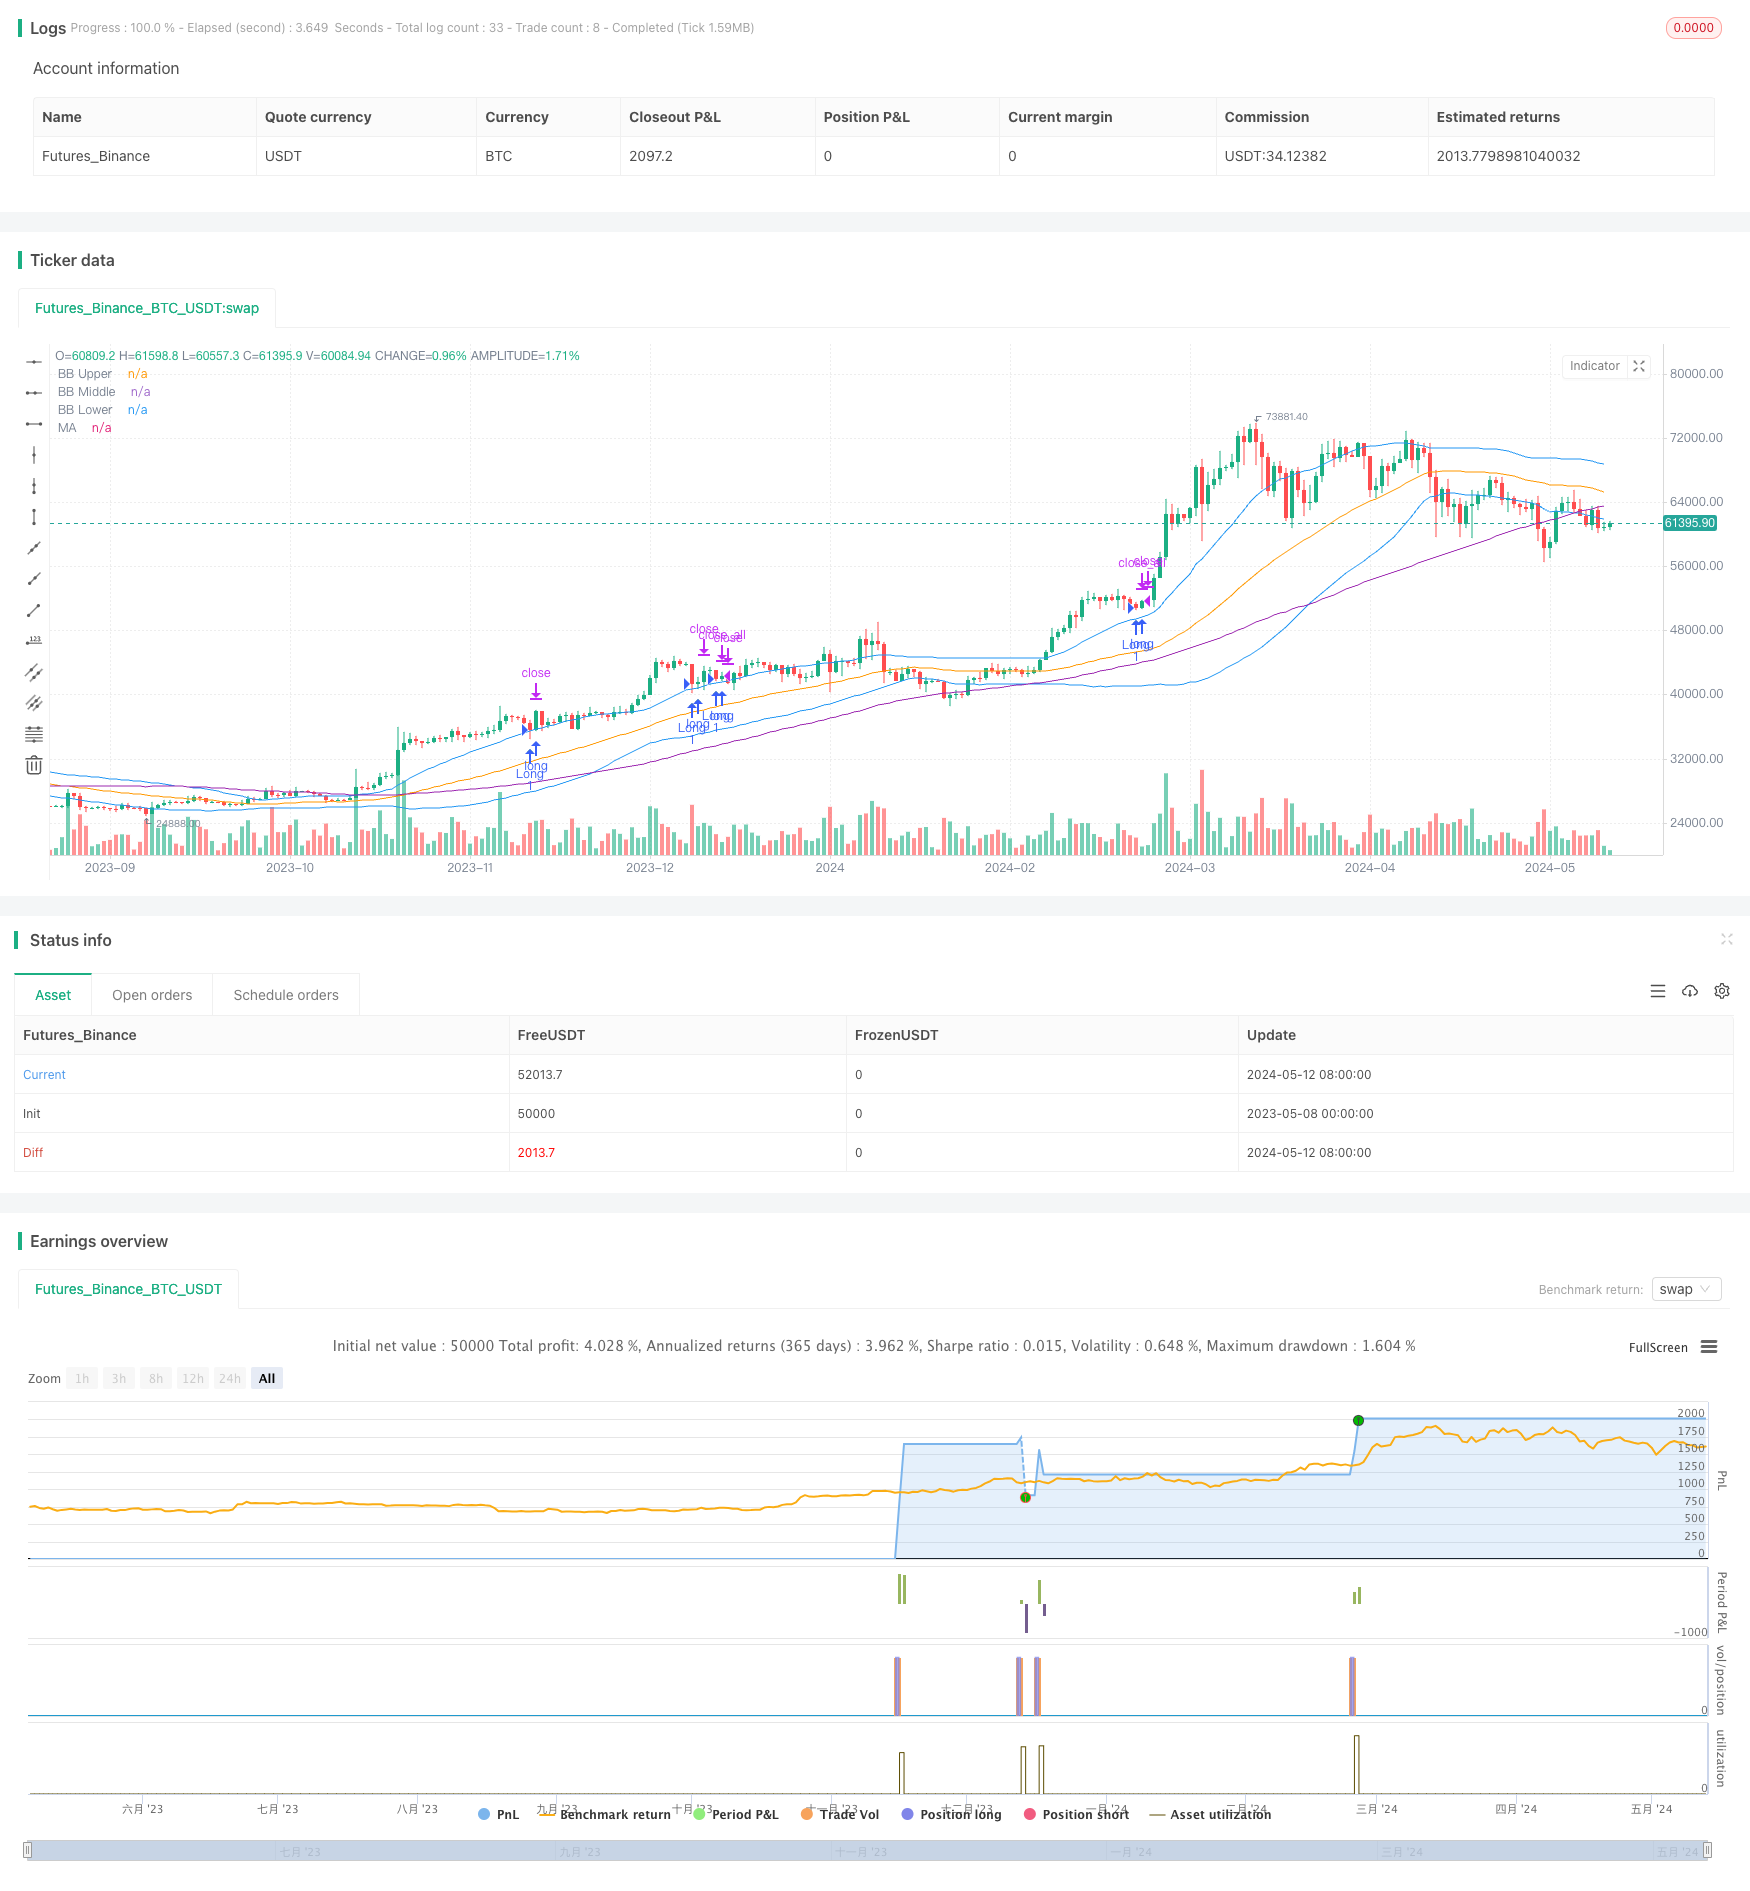
该策略旨在利用布林带(BB)、移动平均线(MA)和相对强弱指数(RSI)的组合来捕捉短期价格波动,从而进行多头交易。当价格高于上轨和移动平均线,且RSI指标显示超卖状态时,策略进行多头入场。策略通过百分比止损和止盈来管理风险和锁定利润,并根据交易者的Bybit账户等级调整入场价格,以考虑佣金的影响。
|
||
|
|
|
||
|
|
#### 策略原理
|
||
|
|
该策略基于以下原理:
|
||
|
|
1. 布林带:当价格突破上轨时,表明市场可能出现上涨趋势。
|
||
|
|
2. 移动平均线:价格高于移动平均线,说明当前处于上涨趋势。
|
||
|
|
3. 相对强弱指数:当RSI低于超卖阈值时,表明市场可能出现反转,价格可能上涨。
|
||
|
|
|
||
|
|
策略通过结合这三个指标,当价格突破布林带上轨、高于移动平均线,且RSI处于超卖区域时,认为市场可能出现上涨机会,因此进行多头入场。同时,策略设置止损和止盈价格,以控制风险和锁定利润。
|
||
|
|
|
||
|
|
#### 策略优势
|
||
|
|
1. 结合多个指标:该策略综合考虑了布林带、移动平均线和RSI,提供了更全面的市场分析。
|
||
|
|
2. 趋势跟踪:通过布林带和移动平均线,策略能够识别当前的市场趋势。
|
||
|
|
3. 超卖信号:利用RSI指标识别潜在的超卖情况,捕捉可能的反转机会。
|
||
|
|
4. 风险管理:策略设置了基于百分比的止损和止盈,有助于控制风险和锁定利润。
|
||
|
|
5. 佣金考虑:根据交易者的Bybit账户等级调整入场价格,以考虑佣金的影响。
|
||
|
|
|
||
|
|
#### 策略风险
|
||
|
|
1. 错误信号:任何技术指标都有可能产生错误信号,导致策略进行不必要的交易。
|
||
|
|
2. 市场波动:短期内市场可能出现剧烈波动,导致止损被触发或错过潜在利润。
|
||
|
|
3. 趋势逆转:策略假设当前趋势将持续,但实际上趋势可能突然逆转,导致损失。
|
||
|
|
4. 佣金影响:虽然策略考虑了佣金,但频繁交易仍可能导致佣金成本增加,影响整体收益。
|
||
|
|
|
||
|
|
#### 策略优化方向
|
||
|
|
1. 参数优化:对布林带、移动平均线和RSI的参数进行优化,以适应不同的市场状况。
|
||
|
|
2. 多空结合:可以考虑加入空头交易条件,以充分利用不同的市场机会。
|
||
|
|
3. 动态止损止盈:根据市场波动性动态调整止损和止盈水平,以更好地控制风险和锁定利润。
|
||
|
|
4. 组合其他指标:考虑引入其他技术指标,如MACD、ATR等,以提高策略的可靠性。
|
||
|
|
5. 资金管理:优化资金管理方法,如根据风险调整头寸大小,以提高策略的风险调整后收益。
|
||
|
|
|
||
|
|
#### 总结
|
||
|
|
该策略利用布林带、移动平均线和RSI的组合,识别短期多头交易机会。它通过布林带和移动平均线确定趋势,利用RSI识别超卖情况,并设置止损止盈以管理风险。策略考虑了佣金的影响,并根据交易者的Bybit账户等级进行调整。尽管该策略具有一定优势,但仍存在错误信号、市场波动和趋势逆转等风险。未来可以通过参数优化、多空结合、动态止损止盈、组合其他指标和优化资金管理等方向对策略进行优化,以提高其性能和适应性。
|
||
|
|
|
||
|
|
||
|
||
|
|
|
||
|
|
#### Overview
|
||
|
|
This strategy aims to capture short-term price movements by utilizing a combination of Bollinger Bands (BB), Moving Average (MA), and Relative Strength Index (RSI) for long trading. The strategy enters long positions when the price is above the upper band and moving average, and the RSI indicates an oversold condition. It manages risk and locks in profits through percentage-based stop loss and take profit levels, and adjusts entry prices based on the trader's Bybit account level to account for commissions.
|
||
|
|
|
||
|
|
#### Strategy Principles
|
||
|
|
The strategy is based on the following principles:
|
||
|
|
1. Bollinger Bands: When the price breaks above the upper band, it suggests a potential uptrend in the market.
|
||
|
|
2. Moving Average: A price above the moving average indicates a current uptrend.
|
||
|
|
3. Relative Strength Index: When the RSI is below the oversold threshold, it suggests a potential market reversal and price increase.
|
||
|
|
|
||
|
|
By combining these three indicators, the strategy identifies potential long entry opportunities when the price breaks above the upper Bollinger Band, is above the moving average, and the RSI is in the oversold region. It also sets stop loss and take profit prices to control risk and lock in profits.
|
||
|
|
|
||
|
|
#### Strategy Advantages
|
||
|
|
1. Multiple indicators: The strategy considers Bollinger Bands, Moving Average, and RSI, providing a more comprehensive market analysis.
|
||
|
|
2. Trend following: By using Bollinger Bands and Moving Average, the strategy can identify the current market trend.
|
||
|
|
3. Oversold signals: The RSI indicator helps identify potential oversold conditions and catch potential reversal opportunities.
|
||
|
|
4. Risk management: The strategy incorporates percentage-based stop loss and take profit levels to control risk and lock in profits.
|
||
|
|
5. Commission consideration: It adjusts entry prices based on the trader's Bybit account level to account for commissions.
|
||
|
|
|
||
|
|
#### Strategy Risks
|
||
|
|
1. False signals: Any technical indicator can generate false signals, leading to unnecessary trades.
|
||
|
|
2. Market volatility: The market may experience severe short-term fluctuations, triggering stop losses or missing potential profits.
|
||
|
|
3. Trend reversal: The strategy assumes the current trend will continue, but trends can suddenly reverse, resulting in losses.
|
||
|
|
4. Commission impact: Although the strategy accounts for commissions, frequent trading can still increase commission costs, affecting overall profitability.
|
||
|
|
|
||
|
|
#### Strategy Optimization Directions
|
||
|
|
1. Parameter optimization: Optimize the parameters for Bollinger Bands, Moving Average, and RSI to adapt to different market conditions.
|
||
|
|
2. Long and short combination: Consider adding short trading conditions to fully utilize different market opportunities.
|
||
|
|
3. Dynamic stop loss and take profit: Adjust stop loss and take profit levels dynamically based on market volatility to better control risk and lock in profits.
|
||
|
|
4. Combining other indicators: Introduce other technical indicators, such as MACD, ATR, etc., to enhance the strategy's reliability.
|
||
|
|
5. Money management: Optimize money management methods, such as adjusting position sizes based on risk, to improve risk-adjusted returns.
|
||
|
|
|
||
|
|
#### Summary
|
||
|
|
This strategy utilizes a combination of Bollinger Bands, Moving Average, and RSI to identify short-term long trading opportunities. It determines trends using Bollinger Bands and Moving Average, identifies oversold conditions with RSI, and sets stop loss and take profit levels to manage risk. The strategy considers commission impact and adjusts based on the trader's Bybit account level. While the strategy has certain advantages, it still faces risks such as false signals, market volatility, and trend reversals. Future optimizations can include parameter optimization, combining long and short positions, dynamic stop loss and take profit, incorporating other indicators, and optimizing money management to improve the strategy's performance and adaptability.
|
||
|
|
[/trans]
|
||
|
|
|
||
|
|
|
||
|
|
|
||
|
|
> Source (PineScript)
|
||
|
|
|
||
|
|
``` pinescript
|
||
|
|
/*backtest
|
||
|
|
start: 2023-05-08 00:00:00
|
||
|
|
end: 2024-05-13 00:00:00
|
||
|
|
period: 1d
|
||
|
|
basePeriod: 1h
|
||
|
|
exchanges: [{"eid":"Futures_Binance","currency":"BTC_USDT"}]
|
||
|
|
*/
|
||
|
|
|
||
|
|
//@BryanAaron
|
||
|
|
|
||
|
|
//@version=5
|
||
|
|
strategy("Bybit . BB Short-Term Trading Strategy - Long Only", overlay=true)
|
||
|
|
|
||
|
|
// Input parameters
|
||
|
|
bbLength = input(45, title="BB Length")
|
||
|
|
bbMultiplier = input(1.0, title="BB Multiplier")
|
||
|
|
maLength = input(90, title="MA Length")
|
||
|
|
rsiLength = input(5, title="RSI Length")
|
||
|
|
rsiUpperThreshold = input(85, title="RSI Upper Threshold")
|
||
|
|
rsiLowerThreshold = input(45, title="RSI Lower Threshold")
|
||
|
|
slPerc = input(2.0, title="Stop Loss %")
|
||
|
|
tpPerc = input(4.0, title="Take Profit %")
|
||
|
|
bybitAccountLevel = input.string("VIP 0", title="Bybit Account Level", options=["VIP 0", "VIP 1", "VIP 2", "VIP 3", "VIP 4"])
|
||
|
|
|
||
|
|
// Calculate Bollinger Bands
|
||
|
|
[bbMiddle, bbUpper, bbLower] = ta.bb(close, bbLength, bbMultiplier)
|
||
|
|
|
||
|
|
// Calculate moving average
|
||
|
|
ma = ta.sma(close, maLength)
|
||
|
|
|
||
|
|
// Calculate RSI
|
||
|
|
rsi = ta.rsi(close, rsiLength)
|
||
|
|
|
||
|
|
// Trading conditions
|
||
|
|
longCondition = close > bbUpper and close > ma and rsi < rsiLowerThreshold
|
||
|
|
shortCondition = close < bbLower and close < ma and rsi > rsiUpperThreshold
|
||
|
|
|
||
|
|
// Entry and exit signals
|
||
|
|
var bool longEntry = false
|
||
|
|
var bool shortEntry = false
|
||
|
|
|
||
|
|
if (longCondition and not longEntry)
|
||
|
|
longEntry := true
|
||
|
|
shortEntry := false
|
||
|
|
else if (shortCondition and not shortEntry)
|
||
|
|
shortEntry := true
|
||
|
|
longEntry := false
|
||
|
|
else if (not longCondition and not shortCondition)
|
||
|
|
longEntry := false
|
||
|
|
shortEntry := false
|
||
|
|
|
||
|
|
// Set commission based on Bybit account level
|
||
|
|
commissionPerc = switch bybitAccountLevel
|
||
|
|
"VIP 0" => 0.075
|
||
|
|
"VIP 1" => 0.065
|
||
|
|
"VIP 2" => 0.055
|
||
|
|
"VIP 3" => 0.045
|
||
|
|
"VIP 4" => 0.035
|
||
|
|
=> 0.075
|
||
|
|
|
||
|
|
// Adjust entry prices based on commission
|
||
|
|
longEntryPrice = close * (1 + commissionPerc / 100)
|
||
|
|
shortEntryPrice = close * (1 - commissionPerc / 100)
|
||
|
|
|
||
|
|
// Calculate stop loss and take profit prices
|
||
|
|
longStopPrice = longEntryPrice * (1 - slPerc / 100)
|
||
|
|
longProfitPrice = longEntryPrice * (1 + tpPerc / 100)
|
||
|
|
shortStopPrice = shortEntryPrice * (1 + slPerc / 100)
|
||
|
|
shortProfitPrice = shortEntryPrice * (1 - tpPerc / 100)
|
||
|
|
|
||
|
|
// Plot signals
|
||
|
|
plotshape(longEntry, title="Long Entry", location=location.belowbar, style=shape.triangleup, size=size.small, color=color.green)
|
||
|
|
plotshape(shortEntry, title="Short Entry", location=location.abovebar, style=shape.triangledown, size=size.small, color=color.red)
|
||
|
|
|
||
|
|
// Entry and exit
|
||
|
|
if (longEntry)
|
||
|
|
strategy.entry("Long", strategy.long, limit=longEntryPrice, stop=longStopPrice, comment="Long Entry")
|
||
|
|
strategy.exit("Long TP/SL", from_entry="Long", limit=longProfitPrice, stop=longStopPrice, comment="Long Exit")
|
||
|
|
else if (shortEntry)
|
||
|
|
strategy.entry("Short", strategy.short, limit=shortEntryPrice, stop=shortStopPrice, comment="Short Entry")
|
||
|
|
strategy.exit("Short TP/SL", from_entry="Short", limit=shortProfitPrice, stop=shortStopPrice, comment="Short Exit")
|
||
|
|
else
|
||
|
|
strategy.close_all(comment="Close All")
|
||
|
|
|
||
|
|
// Plot Bollinger Bands
|
||
|
|
plot(bbUpper, color=color.blue, title="BB Upper")
|
||
|
|
plot(bbMiddle, color=color.orange, title="BB Middle")
|
||
|
|
plot(bbLower, color=color.blue, title="BB Lower")
|
||
|
|
|
||
|
|
// Plot moving average
|
||
|
|
plot(ma, color=color.purple, title="MA")
|
||
|
|
```
|
||
|
|
|
||
|
|
> Detail
|
||
|
|
|
||
|
|
https://www.fmz.com/strategy/451390
|
||
|
|
|
||
|
|
> Last Modified
|
||
|
|
|
||
|
|
2024-05-14 15:40:44
|