154 lines
7.8 KiB
Markdown
154 lines
7.8 KiB
Markdown

|
|
||
|
|
> Name
|
||
|
|
|
||
|
|
基于布林带和相对强弱指数的动态区间突破交易策略-Dynamic-Range-Breakout-Trading-Strategy-Based-on-Bollinger-Bands-and-RSI
|
||
|
|
|
||
|
|
> Author
|
||
|
|
|
||
|
|
ianzeng123
|
||
|
|
|
||
|
|
> Strategy Description
|
||
|
|
|
||
|
|
|
||
|
|
|
||
|
|
|
||
|
|
|
||
|
|
|
||
|
|
|
||
|
|
[trans]
|
||
|
|
#### 概述
|
||
|
|
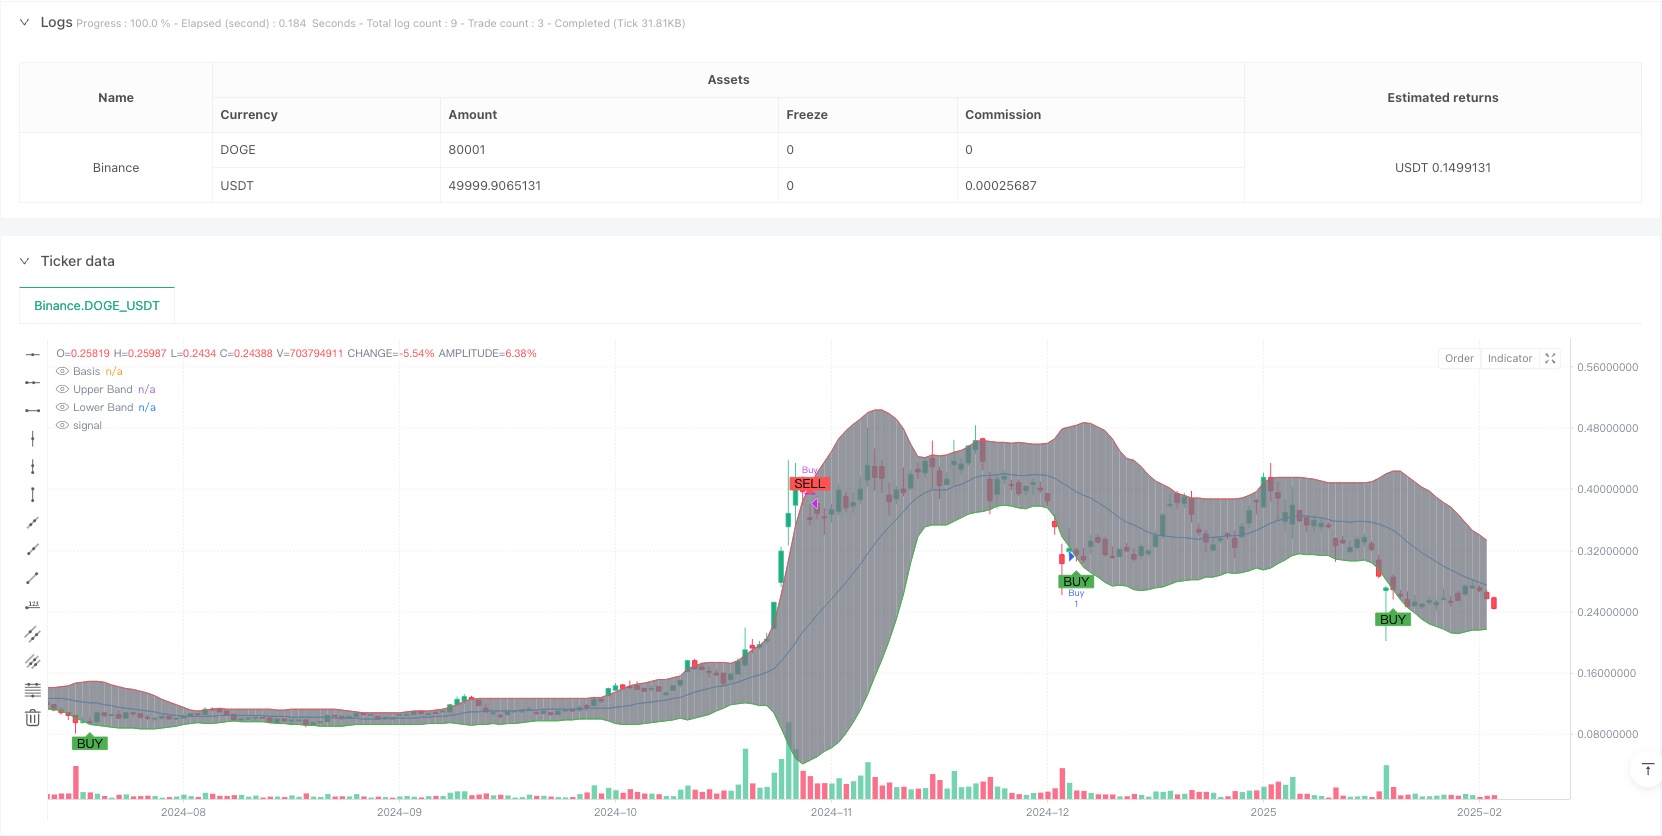
该策略是一个结合布林带(Bollinger Bands)和相对强弱指数(RSI)的动态区间交易系统。它通过监测价格与布林带的交叉以及RSI的超买超卖水平来捕捉市场的转折点。策略核心思想是在市场超卖时寻找反弹机会,在市场超买时及时止盈。
|
||
|
|
|
||
|
|
#### 策略原理
|
||
|
|
策略采用20周期的布林带和14周期的RSI指标作为核心技术指标。布林带由三条线组成:中轨(20周期简单移动平均线)、上轨(中轨+2倍标准差)和下轨(中轨-2倍标准差)。买入信号在两个条件同时满足时触发:价格从下向上突破布林带下轨,且RSI低于45(常规30的1.5倍)。卖出信号则在价格向下突破上轨且RSI高于70时触发。这种设计既考虑了价格走势,又结合了动量指标,有效降低了假突破的风险。
|
||
|
|
|
||
|
|
#### 策略优势
|
||
|
|
1. 动态适应性强:布林带会根据市场波动率自动调整区间宽度,使策略能够适应不同市场环境。
|
||
|
|
2. 多重确认机制:通过结合价格突破和RSI指标,降低了虚假信号的风险。
|
||
|
|
3. 风险控制合理:布林带提供了清晰的支撑压力位,便于设置止损止盈。
|
||
|
|
4. 参数设置灵活:可以根据不同市场特征调整布林带乘数和RSI阈值。
|
||
|
|
5. 可视化效果好:策略在图表上标注了清晰的买卖信号,便于分析和回测。
|
||
|
|
|
||
|
|
#### 策略风险
|
||
|
|
1. 震荡市场风险:在横盘震荡市场中可能产生频繁的假突破信号。
|
||
|
|
建议:可以添加趋势过滤器,只在趋势明确时开仓。
|
||
|
|
|
||
|
|
2. 滞后性风险:移动平均线计算导致的滞后性可能影响信号及时性。
|
||
|
|
建议:可以考虑使用较短周期的指标作为辅助确认。
|
||
|
|
|
||
|
|
3. 过度优化风险:参数优化可能导致过度拟合历史数据。
|
||
|
|
建议:在不同时间周期和市场环境下进行充分测试。
|
||
|
|
|
||
|
|
#### 策略优化方向
|
||
|
|
1. 添加趋势过滤器:可以引入ADX或者长期移动平均线来判断趋势强度,只在趋势明确时交易。
|
||
|
|
|
||
|
|
2. 优化止损设置:可以基于ATR动态设置止损位置,提高风险控制的灵活性。
|
||
|
|
|
||
|
|
3. 引入成交量确认:加入成交量分析,在突破时需要放量确认,提高信号可靠性。
|
||
|
|
|
||
|
|
4. 完善仓位管理:根据市场波动率和账户风险度自动调整开仓规模。
|
||
|
|
|
||
|
|
#### 总结
|
||
|
|
这是一个结合技术分析经典指标的成熟策略,通过布林带和RSI的配合使用,既能把握大趋势,又能控制风险。策略设计理念清晰,实现方式简洁,具有良好的实用性。虽然存在一些固有的风险,但通过合理的参数设置和风险管理措施,可以构建一个稳健的交易系统。建议交易者在实盘使用前,充分测试并根据具体市场特征进行优化。 ||
|
||
|
|
|
||
|
|
#### Overview
|
||
|
|
This strategy is a dynamic range trading system combining Bollinger Bands and Relative Strength Index (RSI). It captures market turning points by monitoring price crossovers with Bollinger Bands and RSI overbought/oversold levels. The core idea is to seek rebound opportunities in oversold markets and take profits in overbought conditions.
|
||
|
|
|
||
|
|
#### Strategy Principles
|
||
|
|
The strategy employs 20-period Bollinger Bands and 14-period RSI as core technical indicators. Bollinger Bands consist of three lines: middle band (20-period SMA), upper band (middle + 2SD), and lower band (middle - 2SD). Buy signals are triggered when two conditions are met simultaneously: price crosses above the lower band and RSI is below 45 (1.5 times the standard 30). Sell signals occur when price crosses below the upper band and RSI is above 70. This design considers both price trends and momentum indicators, effectively reducing false breakout risks.
|
||
|
|
|
||
|
|
#### Strategy Advantages
|
||
|
|
1. Strong Dynamic Adaptation: Bollinger Bands automatically adjust range width based on market volatility, enabling strategy adaptation to different market environments.
|
||
|
|
2. Multiple Confirmation Mechanism: Combining price breakouts and RSI reduces false signal risks.
|
||
|
|
3. Reasonable Risk Control: Bollinger Bands provide clear support/resistance levels for stop-loss and take-profit placement.
|
||
|
|
4. Flexible Parameter Settings: Bollinger Band multiplier and RSI thresholds can be adjusted for different market characteristics.
|
||
|
|
5. Good Visualization: Strategy clearly marks buy/sell signals on charts for analysis and backtesting.
|
||
|
|
|
||
|
|
#### Strategy Risks
|
||
|
|
1. Sideways Market Risk: May generate frequent false breakout signals in ranging markets.
|
||
|
|
Suggestion: Add trend filters to only trade in clear trends.
|
||
|
|
|
||
|
|
2. Lag Risk: Moving average calculations may affect signal timeliness.
|
||
|
|
Suggestion: Consider using shorter-period indicators for confirmation.
|
||
|
|
|
||
|
|
3. Over-optimization Risk: Parameter optimization may lead to overfitting historical data.
|
||
|
|
Suggestion: Test thoroughly across different timeframes and market conditions.
|
||
|
|
|
||
|
|
#### Strategy Optimization Directions
|
||
|
|
1. Add Trend Filters: Introduce ADX or long-term moving averages to assess trend strength and only trade in clear trends.
|
||
|
|
|
||
|
|
2. Optimize Stop Loss Settings: Implement dynamic stop-loss placement based on ATR for more flexible risk control.
|
||
|
|
|
||
|
|
3. Incorporate Volume Confirmation: Add volume analysis requiring increased volume on breakouts for improved signal reliability.
|
||
|
|
|
||
|
|
4. Enhanced Position Management: Automatically adjust position sizes based on market volatility and account risk levels.
|
||
|
|
|
||
|
|
#### Summary
|
||
|
|
This mature strategy combines classic technical analysis indicators, using Bollinger Bands and RSI to capture major trends while controlling risks. The strategy design is clear, implementation is concise, and it demonstrates good practicality. While inherent risks exist, a robust trading system can be built through appropriate parameter settings and risk management measures. Traders are advised to thoroughly test and optimize according to specific market characteristics before live trading.[/trans]
|
||
|
|
|
||
|
|
|
||
|
|
|
||
|
|
> Source (PineScript)
|
||
|
|
|
||
|
|
``` pinescript
|
||
|
|
/*backtest
|
||
|
|
start: 2024-02-21 00:00:00
|
||
|
|
end: 2025-02-19 08:00:00
|
||
|
|
period: 1d
|
||
|
|
basePeriod: 1d
|
||
|
|
exchanges: [{"eid":"Binance","currency":"DOGE_USDT"}]
|
||
|
|
*/
|
||
|
|
|
||
|
|
//@version=5
|
||
|
|
strategy("Bollinger Bands + RSI Strategy", overlay=true)
|
||
|
|
|
||
|
|
// Bollinger Bands Parameters
|
||
|
|
length = input.int(20, title="Bollinger Length")
|
||
|
|
src = close
|
||
|
|
mult = input.float(2.0, title="Bollinger Multiplier")
|
||
|
|
basis = ta.sma(src, length)
|
||
|
|
dev = mult * ta.stdev(src, length)
|
||
|
|
upper = basis + dev
|
||
|
|
lower = basis - dev
|
||
|
|
|
||
|
|
// RSI Parameters
|
||
|
|
rsiLength = input.int(14, title="RSI Length")
|
||
|
|
rsiOverbought = input.int(70, title="RSI Overbought Level", minval=50)
|
||
|
|
rsiOversold = input.int(30, title="RSI Oversold Level", maxval=50)
|
||
|
|
rsiValue = ta.rsi(src, rsiLength)
|
||
|
|
|
||
|
|
// Buy and Sell Conditions
|
||
|
|
buyCondition = ta.crossover(src, lower) and rsiValue < 1.5 * rsiOversold
|
||
|
|
sellCondition = ta.crossunder(src, upper) and rsiValue > rsiOverbought
|
||
|
|
|
||
|
|
// Plot Bollinger Bands
|
||
|
|
plot(basis, color=color.blue, title="Basis")
|
||
|
|
p1 = plot(upper, color=color.red, title="Upper Band")
|
||
|
|
p2 = plot(lower, color=color.green, title="Lower Band")
|
||
|
|
fill(p1, p2, color=color.gray, transp=90)
|
||
|
|
|
||
|
|
// Plot RSI
|
||
|
|
//hline(rsiOverbought, "Overbought", color=color.red)
|
||
|
|
//hline(rsiOversold, "Oversold", color=color.green)
|
||
|
|
|
||
|
|
// Execute Orders
|
||
|
|
if (buyCondition)
|
||
|
|
strategy.entry("Buy", strategy.long)
|
||
|
|
|
||
|
|
if (sellCondition)
|
||
|
|
strategy.close("Buy")
|
||
|
|
|
||
|
|
// Display signals on the chart
|
||
|
|
plotshape(series=buyCondition, title="Buy Signal", location=location.belowbar, color=color.green, style=shape.labelup, text="BUY")
|
||
|
|
plotshape(series=sellCondition, title="Sell Signal", location=location.abovebar, color=color.red, style=shape.labeldown, text="SELL")
|
||
|
|
|
||
|
|
```
|
||
|
|
|
||
|
|
> Detail
|
||
|
|
|
||
|
|
https://www.fmz.com/strategy/483035
|
||
|
|
|
||
|
|
> Last Modified
|
||
|
|
|
||
|
|
2025-02-27 17:17:13
|