260 lines
11 KiB
Markdown
260 lines
11 KiB
Markdown

|
|
||
|
|
> Name
|
||
|
|
|
||
|
|
双重RSI策略结合背离与交叉的高级趋势捕捉系统-Dual-RSI-Strategy-Advanced-Trend-Capture-System-Combining-Divergence-and-Crossover
|
||
|
|
|
||
|
|
> Author
|
||
|
|
|
||
|
|
ChaoZhang
|
||
|
|
|
||
|
|
> Strategy Description
|
||
|
|
|
||
|
|
|
||
|
|
|
||
|
|
[trans]
|
||
|
|
|
||
|
|
#### 概述
|
||
|
|
|
||
|
|
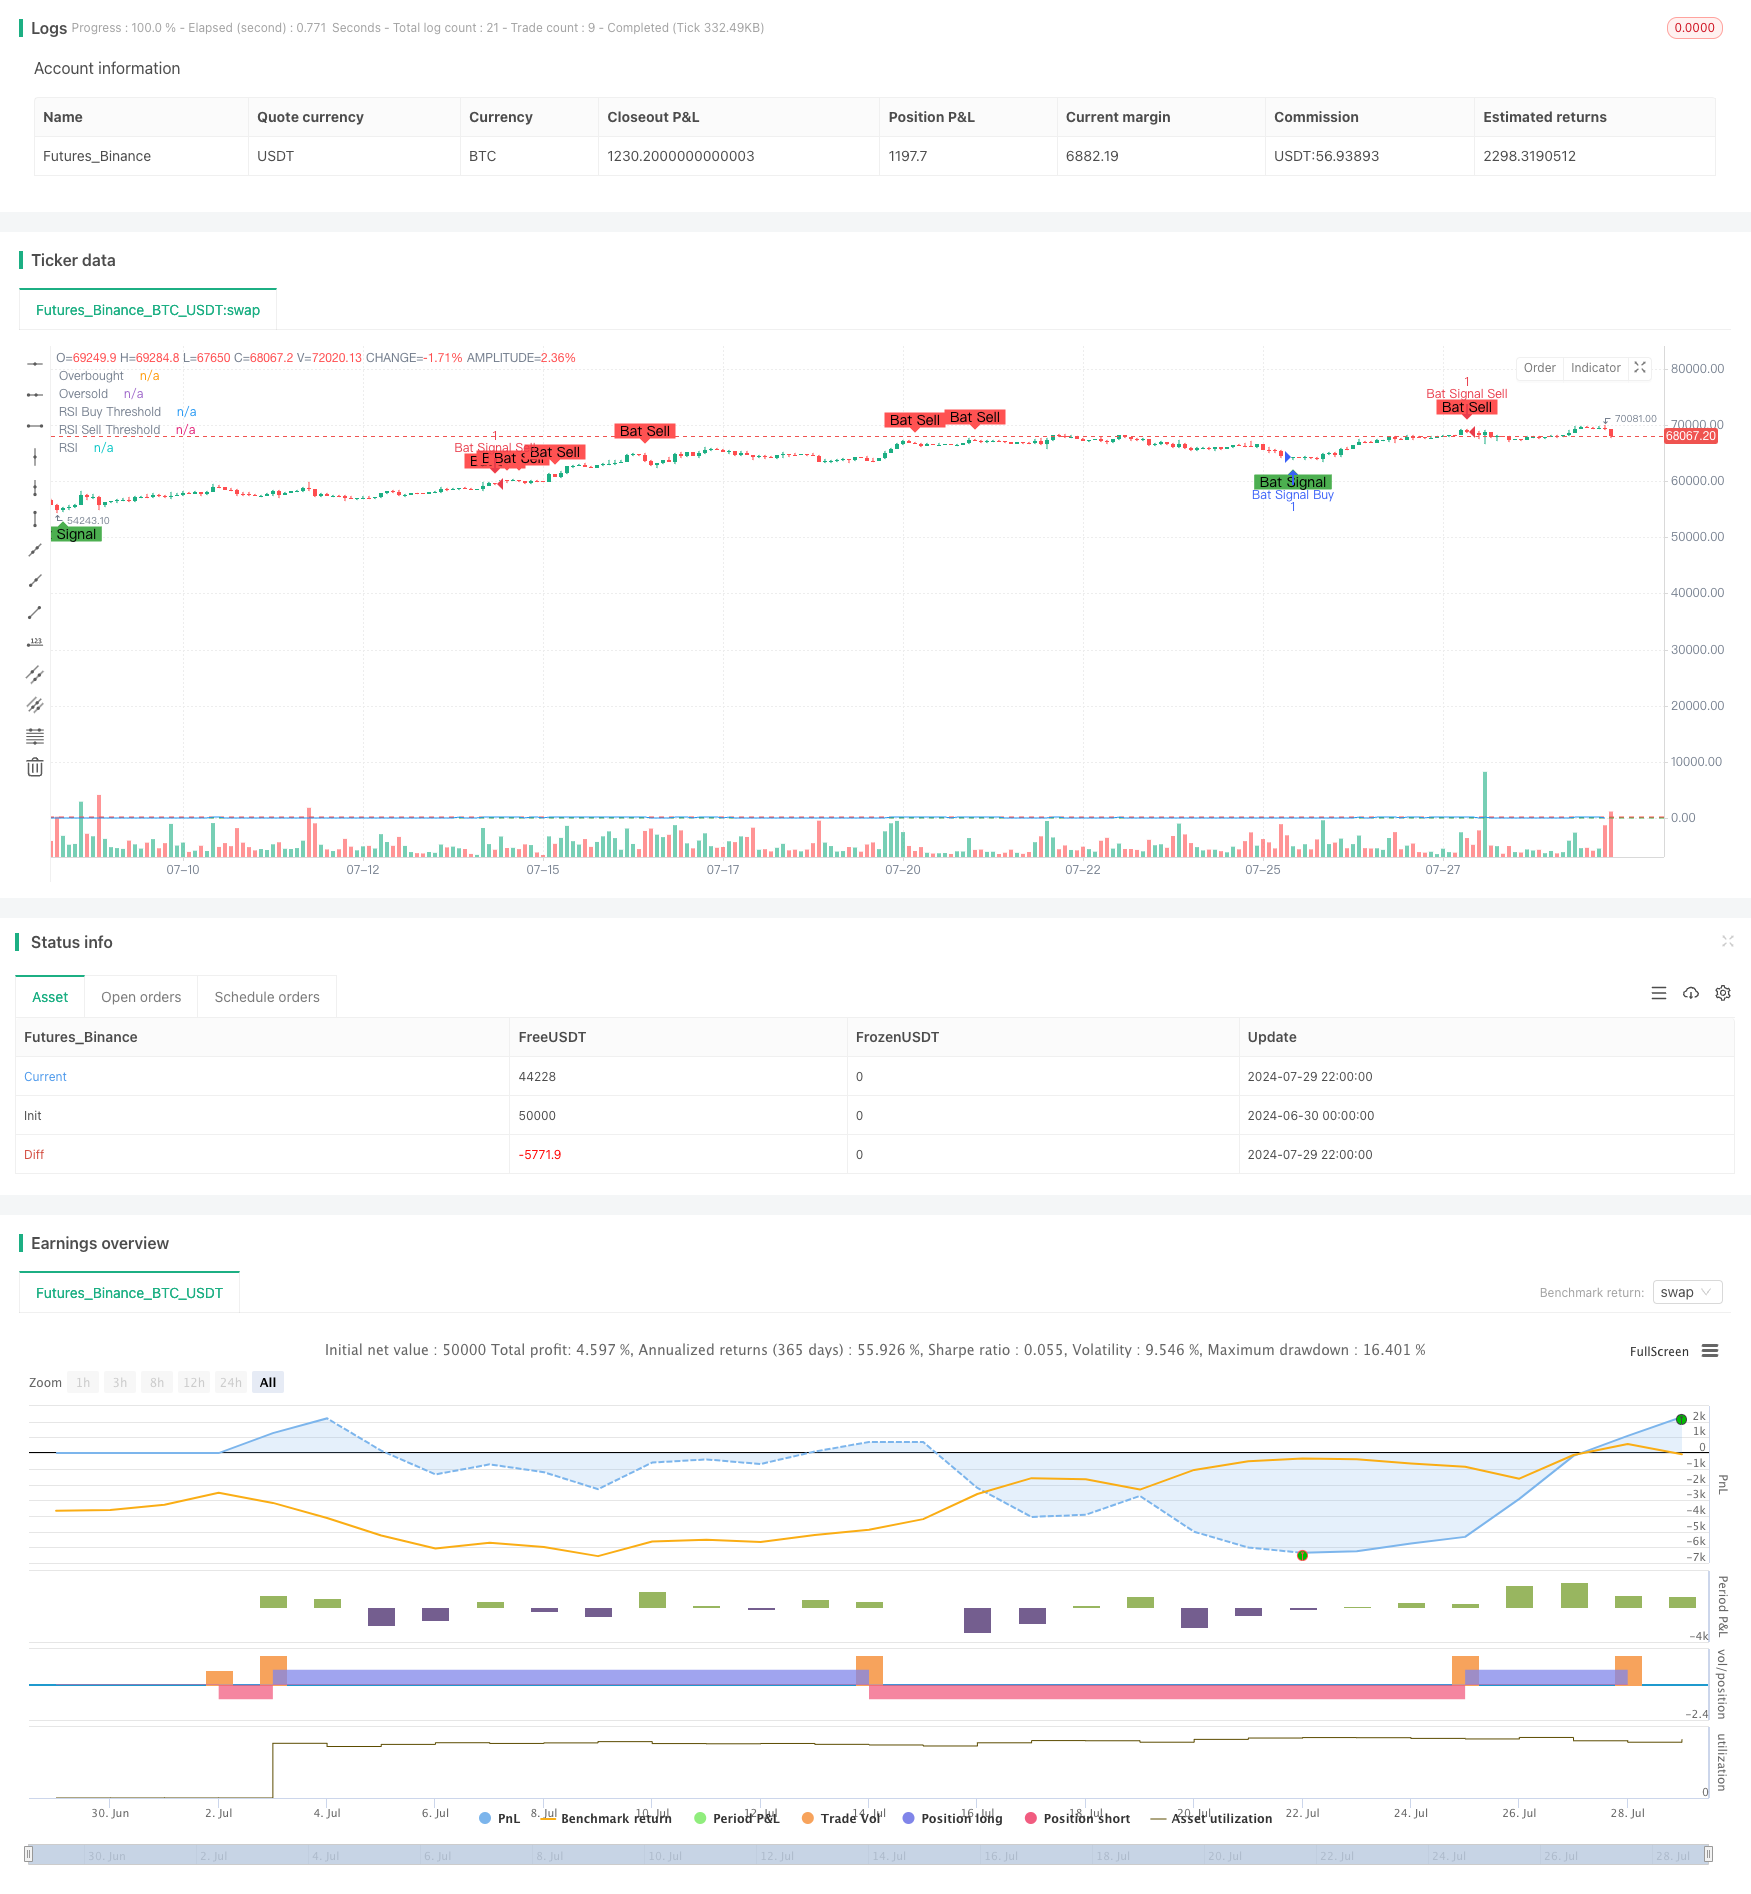
双重RSI策略是一种结合了RSI背离和RSI交叉两种经典交易方法的高级量化交易策略。该策略通过同时监测RSI指标的背离和交叉信号,旨在捕捉市场中更可靠的买卖点。策略的核心思想是,只有当RSI背离和RSI交叉同时出现时,才会触发交易信号,这种双重确认机制有助于提高交易的准确性和可靠性。
|
||
|
|
|
||
|
|
#### 策略原理
|
||
|
|
|
||
|
|
1. RSI背离:
|
||
|
|
- 看涨背离:当价格创新低,但RSI未创新低时形成。
|
||
|
|
- 看跌背离:当价格创新高,但RSI未创新高时形成。
|
||
|
|
|
||
|
|
2. RSI交叉:
|
||
|
|
- 买入信号:RSI从超卖区(30以下)向上突破。
|
||
|
|
- 卖出信号:RSI从超买区(70以上)向下突破。
|
||
|
|
|
||
|
|
3. 信号生成:
|
||
|
|
- 买入条件:同时满足RSI看涨背离和RSI向上突破超卖线。
|
||
|
|
- 卖出条件:同时满足RSI看跌背离和RSI向下突破超买线。
|
||
|
|
|
||
|
|
4. 参数设置:
|
||
|
|
- RSI周期:14(可调)
|
||
|
|
- 超买线:70(可调)
|
||
|
|
- 超卖线:30(可调)
|
||
|
|
- 背离查找周期:90个K线(可调)
|
||
|
|
|
||
|
|
#### 策略优势
|
||
|
|
|
||
|
|
1. 高可靠性:通过结合RSI背离和交叉两种信号,大大提高了交易信号的可靠性,降低了假信号的风险。
|
||
|
|
|
||
|
|
2. 趋势把握:能够有效捕捉市场趋势的转折点,适合中长期交易。
|
||
|
|
|
||
|
|
3. 灵活性强:策略的关键参数均可调整,适应不同市场环境和交易品种。
|
||
|
|
|
||
|
|
4. 风险控制:通过严格的双重确认机制,有效控制了交易风险。
|
||
|
|
|
||
|
|
5. 可视化支持:策略提供了清晰的图表标记,便于交易者直观理解市场状况。
|
||
|
|
|
||
|
|
#### 策略风险
|
||
|
|
|
||
|
|
1. 滞后性:由于需要双重确认,可能会错过一些快速行情的早期阶段。
|
||
|
|
|
||
|
|
2. 过度依赖RSI:在某些市场条件下,单一指标可能无法全面反映市场状况。
|
||
|
|
|
||
|
|
3. 参数敏感性:不同的参数设置可能导致截然不同的交易结果,需要仔细优化。
|
||
|
|
|
||
|
|
4. 假信号风险:尽管双重确认机制降低了假信号风险,但在剧烈波动的市场中仍可能出现。
|
||
|
|
|
||
|
|
5. 缺乏止损机制:策略本身没有内置止损机制,需要交易者额外设置。
|
||
|
|
|
||
|
|
#### 策略优化方向
|
||
|
|
|
||
|
|
1. 多指标结合:引入其他技术指标(如MACD、布林带)进行交叉验证,进一步提高信号可靠性。
|
||
|
|
|
||
|
|
2. 自适应参数:根据市场波动率动态调整RSI周期和阈值,以适应不同市场环境。
|
||
|
|
|
||
|
|
3. 加入止损机制:设计基于ATR或固定百分比的止损策略,控制单笔交易风险。
|
||
|
|
|
||
|
|
4. 时间过滤:加入交易时间窗口限制,避免在不利时段进行交易。
|
||
|
|
|
||
|
|
5. 波动率过滤:在低波动率环境下抑制交易信号,降低假突破风险。
|
||
|
|
|
||
|
|
6. 量价结合:引入成交量分析,提高信号的可信度。
|
||
|
|
|
||
|
|
7. 机器学习优化:使用机器学习算法优化参数选择,提高策略的适应性。
|
||
|
|
|
||
|
|
#### 总结
|
||
|
|
|
||
|
|
双重RSI策略通过巧妙结合RSI背离和交叉信号,创造了一个强大而灵活的交易系统。它不仅能够有效捕捉市场趋势的重要转折点,还通过双重确认机制显著提高了交易信号的可靠性。虽然策略存在一定的滞后性和参数敏感性等风险,但通过合理的优化和风险管理,这些问题都可以得到有效缓解。未来,通过引入多指标交叉验证、自适应参数和机器学习等先进技术,该策略还有很大的提升空间。对于寻求稳健、可靠交易系统的量化交易者来说,双重RSI策略无疑是一个值得深入研究和实践的选择。
|
||
|
|
|
||
|
|
||
|
||
|
|
|
||
|
|
#### Overview
|
||
|
|
|
||
|
|
The Dual RSI Strategy is an advanced quantitative trading approach that combines two classic RSI-based trading methods: RSI divergence and RSI crossover. This strategy aims to capture more reliable buy and sell signals in the market by simultaneously monitoring both divergence and crossover signals from the RSI indicator. The core idea is to generate trading signals only when both RSI divergence and RSI crossover occur simultaneously, providing a double confirmation mechanism that enhances the accuracy and reliability of trades.
|
||
|
|
|
||
|
|
#### Strategy Principles
|
||
|
|
|
||
|
|
1. RSI Divergence:
|
||
|
|
- Bullish Divergence: Occurs when price makes a new low, but RSI fails to make a new low.
|
||
|
|
- Bearish Divergence: Occurs when price makes a new high, but RSI fails to make a new high.
|
||
|
|
|
||
|
|
2. RSI Crossover:
|
||
|
|
- Buy Signal: RSI crosses above the oversold level (30).
|
||
|
|
- Sell Signal: RSI crosses below the overbought level (70).
|
||
|
|
|
||
|
|
3. Signal Generation:
|
||
|
|
- Buy Condition: Bullish RSI divergence AND RSI crosses above the oversold level.
|
||
|
|
- Sell Condition: Bearish RSI divergence AND RSI crosses below the overbought level.
|
||
|
|
|
||
|
|
4. Parameter Settings:
|
||
|
|
- RSI Period: 14 (adjustable)
|
||
|
|
- Overbought Level: 70 (adjustable)
|
||
|
|
- Oversold Level: 30 (adjustable)
|
||
|
|
- Divergence Lookback Period: 90 bars (adjustable)
|
||
|
|
|
||
|
|
#### Strategy Advantages
|
||
|
|
|
||
|
|
1. High Reliability: By combining RSI divergence and crossover signals, the strategy significantly improves the reliability of trading signals and reduces the risk of false signals.
|
||
|
|
|
||
|
|
2. Trend Capture: Effectively identifies market trend reversal points, suitable for medium to long-term trading.
|
||
|
|
|
||
|
|
3. Flexibility: Key parameters are adjustable, allowing adaptation to different market environments and trading instruments.
|
||
|
|
|
||
|
|
4. Risk Control: The strict double confirmation mechanism effectively controls trading risk.
|
||
|
|
|
||
|
|
5. Visual Support: The strategy provides clear chart markings, facilitating intuitive understanding of market conditions.
|
||
|
|
|
||
|
|
#### Strategy Risks
|
||
|
|
|
||
|
|
1. Lag: Due to the need for double confirmation, the strategy may miss the early stages of some rapid market movements.
|
||
|
|
|
||
|
|
2. Over-reliance on RSI: In certain market conditions, a single indicator may not fully reflect market dynamics.
|
||
|
|
|
||
|
|
3. Parameter Sensitivity: Different parameter settings can lead to vastly different trading results, requiring careful optimization.
|
||
|
|
|
||
|
|
4. False Signal Risk: Although the double confirmation mechanism reduces false signal risk, it can still occur in highly volatile markets.
|
||
|
|
|
||
|
|
5. Lack of Stop-Loss Mechanism: The strategy itself does not include a built-in stop-loss mechanism, requiring traders to set additional risk management measures.
|
||
|
|
|
||
|
|
#### Strategy Optimization Directions
|
||
|
|
|
||
|
|
1. Multi-Indicator Integration: Introduce other technical indicators (e.g., MACD, Bollinger Bands) for cross-validation to further improve signal reliability.
|
||
|
|
|
||
|
|
2. Adaptive Parameters: Dynamically adjust RSI period and thresholds based on market volatility to adapt to different market environments.
|
||
|
|
|
||
|
|
3. Implement Stop-Loss: Design a stop-loss strategy based on ATR or fixed percentage to control single trade risk.
|
||
|
|
|
||
|
|
4. Time Filtering: Add trading time window restrictions to avoid trading during unfavorable periods.
|
||
|
|
|
||
|
|
5. Volatility Filtering: Suppress trading signals in low volatility environments to reduce false breakout risks.
|
||
|
|
|
||
|
|
6. Volume Analysis: Incorporate volume analysis to increase signal credibility.
|
||
|
|
|
||
|
|
7. Machine Learning Optimization: Use machine learning algorithms to optimize parameter selection and improve strategy adaptability.
|
||
|
|
|
||
|
|
#### Conclusion
|
||
|
|
|
||
|
|
The Dual RSI Strategy cleverly combines RSI divergence and crossover signals to create a powerful and flexible trading system. It not only effectively captures important turning points in market trends but also significantly improves the reliability of trading signals through its double confirmation mechanism. While the strategy has certain risks such as lag and parameter sensitivity, these issues can be effectively mitigated through proper optimization and risk management. In the future, by introducing advanced techniques such as multi-indicator cross-validation, adaptive parameters, and machine learning, this strategy has great potential for improvement. For quantitative traders seeking a robust and reliable trading system, the Dual RSI Strategy is undoubtedly a worthy choice for in-depth study and practice.
|
||
|
|
|
||
|
|
[/trans]
|
||
|
|
|
||
|
|
|
||
|
|
|
||
|
|
> Source (PineScript)
|
||
|
|
|
||
|
|
``` pinescript
|
||
|
|
/*backtest
|
||
|
|
start: 2024-06-30 00:00:00
|
||
|
|
end: 2024-07-30 00:00:00
|
||
|
|
period: 2h
|
||
|
|
basePeriod: 15m
|
||
|
|
exchanges: [{"eid":"Futures_Binance","currency":"BTC_USDT"}]
|
||
|
|
*/
|
||
|
|
|
||
|
|
//@version=4
|
||
|
|
strategy("Combined RSI Strategies", overlay=true)
|
||
|
|
|
||
|
|
// Input parameters for the first strategy (RSI Divergences)
|
||
|
|
len = input(14, minval=1, title="RSI Length")
|
||
|
|
ob = input(defval=70, title="Overbought", type=input.integer, minval=0, maxval=100)
|
||
|
|
os = input(defval=30, title="Oversold", type=input.integer, minval=0, maxval=100)
|
||
|
|
xbars = input(defval=90, title="Div lookback period (bars)?", type=input.integer, minval=1)
|
||
|
|
|
||
|
|
// Input parameters for the second strategy (RSI Crossover)
|
||
|
|
rsiBuyThreshold = input(30, title="RSI Buy Threshold")
|
||
|
|
rsiSellThreshold = input(70, title="RSI Sell Threshold")
|
||
|
|
|
||
|
|
// RSI calculation
|
||
|
|
rsi = rsi(close, len)
|
||
|
|
|
||
|
|
// Calculate highest and lowest bars for divergences
|
||
|
|
hb = abs(highestbars(rsi, xbars))
|
||
|
|
lb = abs(lowestbars(rsi, xbars))
|
||
|
|
|
||
|
|
// Initialize variables for divergences
|
||
|
|
var float max = na
|
||
|
|
var float max_rsi = na
|
||
|
|
var float min = na
|
||
|
|
var float min_rsi = na
|
||
|
|
var bool pivoth = na
|
||
|
|
var bool pivotl = na
|
||
|
|
var bool divbear = na
|
||
|
|
var bool divbull = na
|
||
|
|
|
||
|
|
// Update max and min values for divergences
|
||
|
|
max := hb == 0 ? close : na(max[1]) ? close : max[1]
|
||
|
|
max_rsi := hb == 0 ? rsi : na(max_rsi[1]) ? rsi : max_rsi[1]
|
||
|
|
min := lb == 0 ? close : na(min[1]) ? close : min[1]
|
||
|
|
min_rsi := lb == 0 ? rsi : na(min_rsi[1]) ? rsi : min_rsi[1]
|
||
|
|
|
||
|
|
// Compare current bar's high/low with max/min values for divergences
|
||
|
|
if close > max
|
||
|
|
max := close
|
||
|
|
if rsi > max_rsi
|
||
|
|
max_rsi := rsi
|
||
|
|
if close < min
|
||
|
|
min := close
|
||
|
|
if rsi < min_rsi
|
||
|
|
min_rsi := rsi
|
||
|
|
|
||
|
|
// Detect pivot points for divergences
|
||
|
|
pivoth := (max_rsi == max_rsi[2]) and (max_rsi[2] != max_rsi[3]) ? true : na
|
||
|
|
pivotl := (min_rsi == min_rsi[2]) and (min_rsi[2] != min_rsi[3]) ? true : na
|
||
|
|
|
||
|
|
// Detect divergences
|
||
|
|
if (max[1] > max[2]) and (rsi[1] < max_rsi) and (rsi <= rsi[1])
|
||
|
|
divbear := true
|
||
|
|
if (min[1] < min[2]) and (rsi[1] > min_rsi) and (rsi >= rsi[1])
|
||
|
|
divbull := true
|
||
|
|
|
||
|
|
// Conditions for RSI crossovers
|
||
|
|
isRSICrossAboveThreshold = crossover(rsi, rsiBuyThreshold)
|
||
|
|
isRSICrossBelowThreshold = crossunder(rsi, rsiSellThreshold)
|
||
|
|
|
||
|
|
// Combined buy and sell conditions
|
||
|
|
buyCondition = divbull and isRSICrossAboveThreshold
|
||
|
|
sellCondition = divbear and isRSICrossBelowThreshold
|
||
|
|
|
||
|
|
// Generate buy/sell signals
|
||
|
|
if buyCondition
|
||
|
|
strategy.entry("Bat Signal Buy", strategy.long)
|
||
|
|
if sellCondition
|
||
|
|
strategy.entry("Bat Signal Sell", strategy.short)
|
||
|
|
|
||
|
|
// Plot RSI
|
||
|
|
plot(rsi, "RSI", color=color.blue)
|
||
|
|
hline(ob, title="Overbought", color=color.red)
|
||
|
|
hline(os, title="Oversold", color=color.green)
|
||
|
|
hline(rsiBuyThreshold, title="RSI Buy Threshold", color=color.green)
|
||
|
|
hline(rsiSellThreshold, title="RSI Sell Threshold", color=color.red)
|
||
|
|
|
||
|
|
// Plot signals
|
||
|
|
plotshape(series=buyCondition, title="Bat Signal", location=location.belowbar, color=color.green, style=shape.labelup, text="Bat Signal")
|
||
|
|
plotshape(series=sellCondition, title="Bat Sell", location=location.abovebar, color=color.red, style=shape.labeldown, text="Bat Sell")
|
||
|
|
|
||
|
|
|
||
|
|
```
|
||
|
|
|
||
|
|
> Detail
|
||
|
|
|
||
|
|
https://www.fmz.com/strategy/458252
|
||
|
|
|
||
|
|
> Last Modified
|
||
|
|
|
||
|
|
2024-07-31 11:55:12
|