228 lines
18 KiB
Markdown
228 lines
18 KiB
Markdown

|
|
||
|
|
> Name
|
||
|
|
|
||
|
|
动态ATR网格回撤捕捉量化交易策略-Dynamic-ATR-Grid-Pullback-Capture-Quantitative-Trading-Strategy
|
||
|
|
|
||
|
|
> Author
|
||
|
|
|
||
|
|
ianzeng123
|
||
|
|
|
||
|
|
> Strategy Description
|
||
|
|
|
||
|
|
|
||
|
|
|
||
|
|
|
||
|
|
|
||
|
|
|
||
|
|
|
||
|
|
[trans]
|
||
|
|
|
||
|
|
#### 概述
|
||
|
|
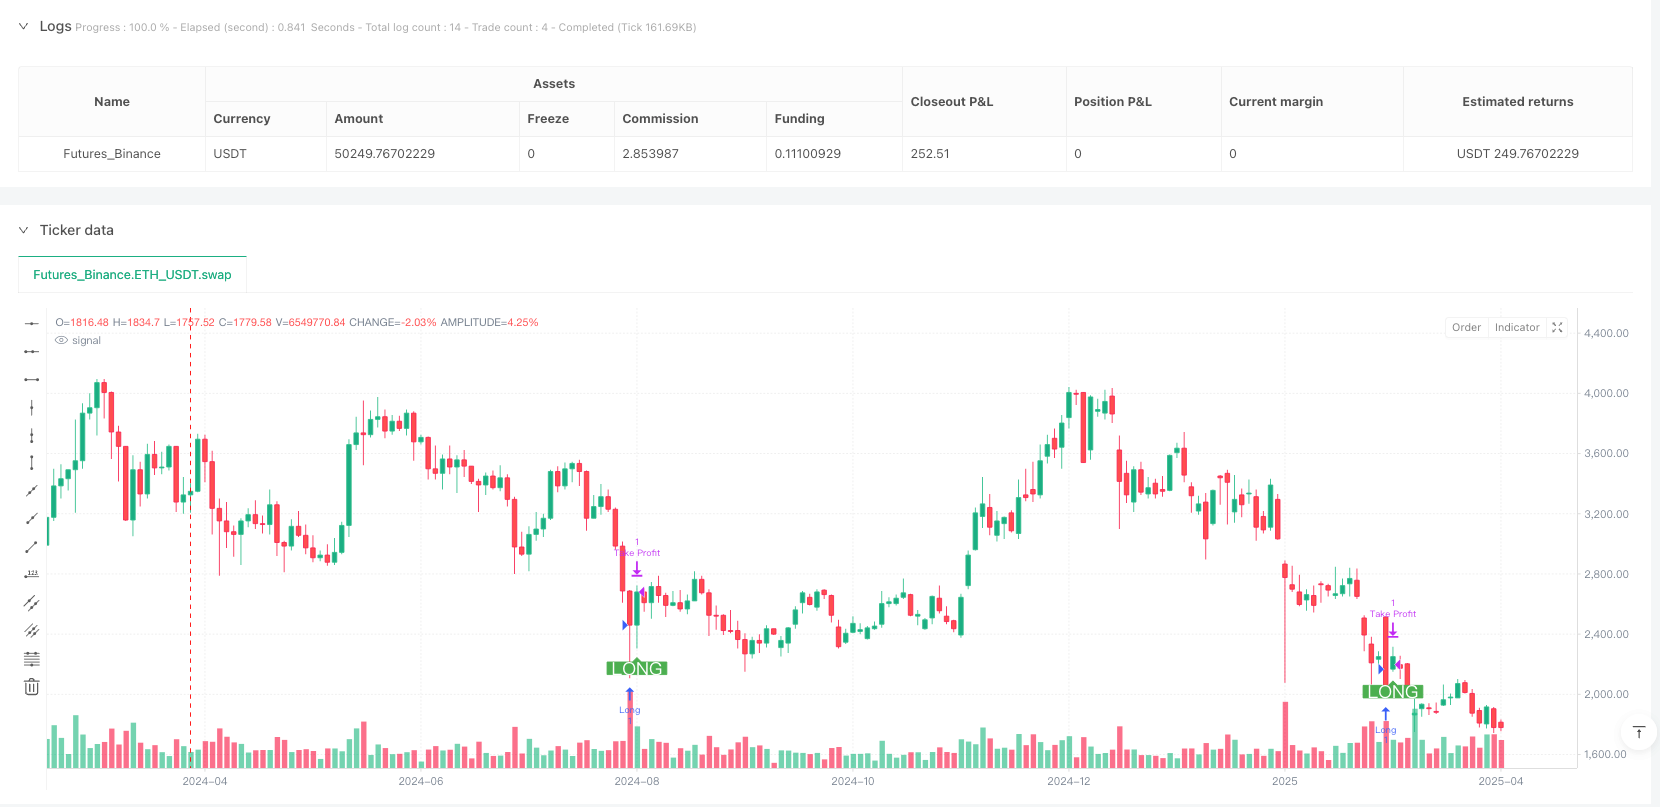
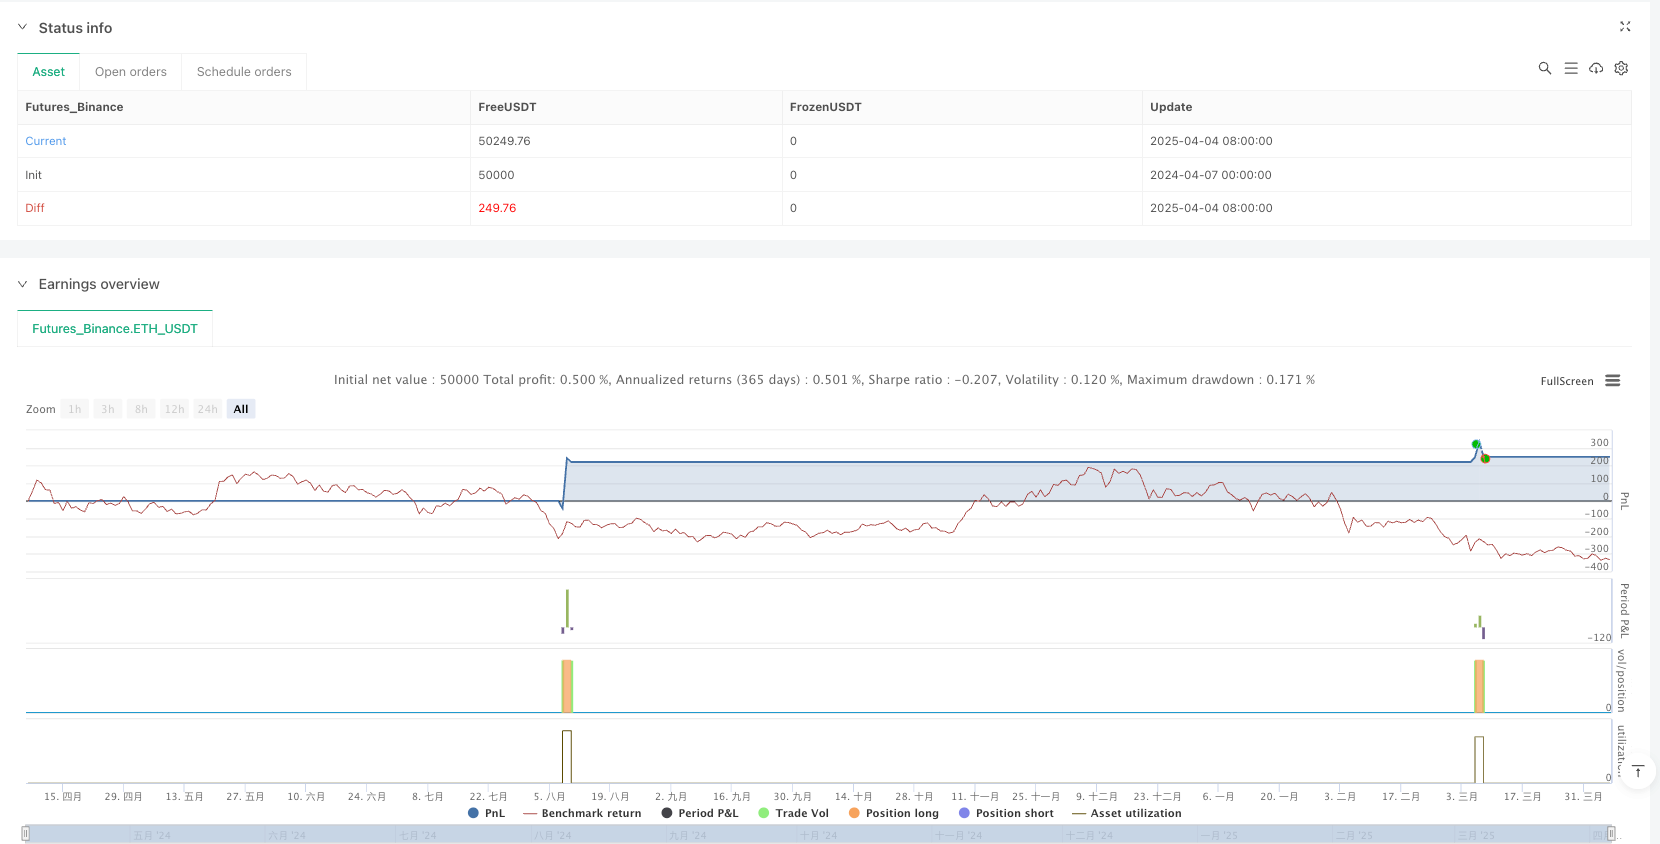
动态ATR网格回撤捕捉量化交易策略是一种专为短期交易者设计的高频交易策略,旨在捕捉市场回撤机会。该策略利用基于ATR(平均真实波幅)的动态网格系统来定义最佳入场点,确保精确的交易执行。它集成了波动率过滤和基于RSI(相对强弱指标)的确认机制,以提高信号准确性并减少错误入场。该策略专门针对短线交易进行了优化,可以根据当前市场条件动态调整交易水平。网格系统有助于捕捉回撤机会,同时通过预定义的利润目标和追踪止损机制保持严格的交易管理。
|
||
|
|
|
||
|
|
#### 策略原理
|
||
|
|
该策略的核心原理是基于ATR计算的动态网格系统与RSI过滤器的结合应用。策略首先计算10周期ATR值,然后使用网格因子(默认0.2)创建15个网格价位。这些网格价位形成了交易决策的基础框架。
|
||
|
|
|
||
|
|
交易逻辑主要分为四个关键部分:
|
||
|
|
1. **网格计算**:使用当前收盘价加上ATR值与网格因子的乘积来动态生成15个网格价位,这些价位随市场波动而调整。
|
||
|
|
2. **波动率过滤**:通过计算价格振幅与价格的比率,确保只有在市场波动性足够大时才执行交易,避免在低波动区间交易。
|
||
|
|
3. **RSI确认**:使用14周期RSI作为额外的交易确认条件。多头交易需要RSI低于30(超卖),空头交易需要RSI高于70(超买)。
|
||
|
|
4. **入场逻辑**:多头入场条件是价格低于第一个网格水平,市场波动性高于"无交易区"设定值,且RSI低于30。空头入场条件是价格高于最后一个网格水平,波动性满足条件,且RSI高于70。
|
||
|
|
|
||
|
|
一旦交易被触发,策略会设置利润目标和基于ATR的追踪止损。利润目标默认设置为0.2%,而追踪止损则使用ATR值作为偏移量,以适应市场波动性保护已获利润。
|
||
|
|
|
||
|
|
#### 策略优势
|
||
|
|
通过深入分析该策略的代码,可以总结出以下显著优势:
|
||
|
|
|
||
|
|
1. **动态适应性**:策略使用ATR计算网格水平,使其能够根据当前市场波动性动态调整。这意味着在高波动时期,网格间距会扩大,而在低波动时期,网格间距会收窄,使策略能够适应不同的市场环境。
|
||
|
|
|
||
|
|
2. **多重过滤机制**:策略结合了价格网格、波动率过滤和RSI指标作为入场条件,这种多层过滤机制显著减少了假信号,提高了交易质量。
|
||
|
|
|
||
|
|
3. **精确的入场点**:网格系统预先定义了入场水平,避免了在不理想价格水平追逐交易的情况,增强了执行纪律。
|
||
|
|
|
||
|
|
4. **风险管理集成**:策略内置了利润目标和追踪止损机制,确保每笔交易都有明确的风险管理规则,这对于高频交易尤为重要。
|
||
|
|
|
||
|
|
5. **超买超卖捕捉**:通过结合RSI指标,策略能够在价格超买或超卖区域进行交易,增加了逆势交易的成功率。
|
||
|
|
|
||
|
|
6. **视觉辅助**:代码中包含网格水平和交易入场标记的可视化,使交易者能够直观地观察策略运行情况,便于回测分析和策略调整。
|
||
|
|
|
||
|
|
#### 策略风险
|
||
|
|
尽管该策略设计精良,但仍存在几个需要注意的风险因素:
|
||
|
|
|
||
|
|
1. **频繁交易风险**:作为高频策略,可能产生大量交易,导致高额交易成本,尤其在手续费较高的市场。解决方法是调整网格因子和利润目标,减少交易频率或提高单笔收益。
|
||
|
|
|
||
|
|
2. **趋势市场下的逆势风险**:该策略本质上是回撤捕捉策略,在强趋势市场中可能频繁触发逆势交易,导致连续亏损。解决办法是增加趋势过滤器,在识别出强趋势时暂停逆势交易。
|
||
|
|
|
||
|
|
3. **参数敏感性**:策略效果高度依赖于ATR长度、网格因子和利润目标等参数设置。不同市场和时间周期可能需要不同的参数组合。建议进行全面的参数优化和回测。
|
||
|
|
|
||
|
|
4. **无交易区设置的敏感性**:过高的无交易区值可能导致错过良好机会,而过低的值可能导致在低波动环境下执行不理想的交易。应根据特定市场的典型波动特征调整此参数。
|
||
|
|
|
||
|
|
5. **止损机制不完善**:虽然策略包含追踪止损,但缺乏硬性止损设置,在极端市场条件下可能承受较大亏损。建议添加基于固定点数或百分比的硬性止损限制。
|
||
|
|
|
||
|
|
#### 策略优化方向
|
||
|
|
基于代码分析,该策略可以从以下几个方向进行优化:
|
||
|
|
|
||
|
|
1. **添加趋势过滤器**:整合中长期趋势指标(如移动平均线交叉或MACD),以避免在强趋势市场中进行逆势交易。这样可以显著减少亏损交易次数,因为回撤策略在顺应主趋势时通常表现更好。
|
||
|
|
|
||
|
|
2. **动态利润目标**:当前利润目标是固定的0.2%,可以改为基于ATR的动态值,使其能够在高波动时期设置更高的目标,在低波动时期设置更保守的目标。这将提高策略在不同市场条件下的适应性。
|
||
|
|
|
||
|
|
3. **时间过滤器**:添加交易时间窗口过滤,避免在波动性异常的市场开盘、收盘时段或重要经济数据公布期间交易。这可以减少由于短期异常波动导致的虚假信号。
|
||
|
|
|
||
|
|
4. **量化RSI条件**:目前RSI使用固定的30/70阈值,可以考虑使用动态阈值,如计算RSI的平均值和标准差,当RSI偏离平均值特定标准差时触发信号。这种方法可以更好地适应不同市场的RSI特性。
|
||
|
|
|
||
|
|
5. **增加交易量确认**:在入场条件中加入交易量确认,确保在交易量显著的情况下才执行交易,这可以提高信号质量,减少市场噪音导致的错误交易。
|
||
|
|
|
||
|
|
6. **优化网格密度**:当前策略使用15个固定的网格点,可以考虑根据市场波动性动态调整网格数量和密度。在高波动市场可以增加网格密度,在低波动市场可以减少网格点,提高策略的灵活性。
|
||
|
|
|
||
|
|
#### 总结
|
||
|
|
动态ATR网格回撤捕捉量化交易策略是一种结合了ATR动态网格和RSI过滤的高频交易系统,专为捕捉短期市场回撤而设计。它通过使用基于市场波动性的动态网格系统,确保在技术上合理的价格水平进行交易,同时通过RSI过滤和波动率检测提高信号质量。
|
||
|
|
|
||
|
|
该策略的主要优势在于其动态适应不同市场环境的能力和严格的交易规则,但在强趋势市场中可能面临挑战。通过添加趋势过滤器、优化网格密度和实施动态利润目标等措施,可以进一步增强策略的鲁棒性和性能。
|
||
|
|
|
||
|
|
对于有经验的短线交易者,这个策略提供了一个系统化的方法来捕捉价格回撤,特别适合波动较大的市场环境。然而,与所有交易策略一样,在实际应用前应进行充分的回测和参数优化,并结合适当的资金管理规则使用。 ||
|
||
|
|
|
||
|
|
#### Overview
|
||
|
|
The Dynamic ATR Grid Pullback Capture Quantitative Trading Strategy is a high-frequency trading system designed for short-term traders aiming to capitalize on market pullbacks. This strategy utilizes a dynamic grid system based on the Average True Range (ATR) to define optimal entry points, ensuring precise trade execution. It integrates volatility filtering and a Relative Strength Index (RSI) confirmation mechanism to enhance signal accuracy and reduce false entries. The strategy is specifically optimized for scalping by dynamically adjusting trading levels based on current market conditions. The grid-based system helps capture retracement opportunities while maintaining strict trade management through predefined profit targets and trailing stop-loss mechanisms.
|
||
|
|
|
||
|
|
#### Strategy Principles
|
||
|
|
The core principle of this strategy is the combination of a dynamic grid system calculated using ATR with an RSI filter. The strategy first calculates the 10-period ATR value, then creates 15 grid levels using a grid factor (default 0.2). These grid levels form the foundational framework for trading decisions.
|
||
|
|
|
||
|
|
The trading logic is divided into four key components:
|
||
|
|
1. **Grid Calculation**: Uses the current closing price plus the product of ATR value and grid factor to dynamically generate 15 grid levels, which adjust with market volatility.
|
||
|
|
2. **Volatility Filtering**: Ensures trades are only executed when market volatility is sufficiently high by calculating the ratio of price amplitude to price, avoiding trading in low volatility zones.
|
||
|
|
3. **RSI Confirmation**: Uses 14-period RSI as an additional trade confirmation condition. Long trades require RSI below 30 (oversold), short trades require RSI above 70 (overbought).
|
||
|
|
4. **Entry Logic**: Long entry conditions are price below the first grid level, market volatility above the "no trade zone" setting, and RSI below 30. Short entry conditions are price above the last grid level, volatility meeting conditions, and RSI above 70.
|
||
|
|
|
||
|
|
Once a trade is triggered, the strategy sets a profit target and an ATR-based trailing stop. The profit target is defaulted to 0.2%, while the trailing stop uses the ATR value as an offset to adapt to market volatility and protect accrued profits.
|
||
|
|
|
||
|
|
#### Strategy Advantages
|
||
|
|
Through in-depth analysis of the strategy's code, the following significant advantages can be summarized:
|
||
|
|
|
||
|
|
1. **Dynamic Adaptability**: The strategy uses ATR to calculate grid levels, allowing it to dynamically adjust to current market volatility. This means grid spacing widens during high volatility periods and narrows during low volatility periods, enabling the strategy to adapt to different market environments.
|
||
|
|
|
||
|
|
2. **Multiple Filtering Mechanisms**: The strategy combines price grids, volatility filtering, and RSI indicators as entry conditions. This multi-layered filtering mechanism significantly reduces false signals and improves trade quality.
|
||
|
|
|
||
|
|
3. **Precise Entry Points**: The grid system predefines entry levels, avoiding situations where trades are chased at unfavorable price levels, enhancing execution discipline.
|
||
|
|
|
||
|
|
4. **Integrated Risk Management**: The strategy has built-in profit targets and trailing stop mechanisms, ensuring each trade has clear risk management rules, which is particularly important for high-frequency trading.
|
||
|
|
|
||
|
|
5. **Overbought/Oversold Capture**: By incorporating the RSI indicator, the strategy can trade in price overbought or oversold areas, increasing the success rate of counter-trend trading.
|
||
|
|
|
||
|
|
6. **Visual Assistance**: The code includes visualization of grid levels and trade entry markers, allowing traders to intuitively observe the strategy's operation, facilitating backtest analysis and strategy adjustment.
|
||
|
|
|
||
|
|
#### Strategy Risks
|
||
|
|
Despite its sophisticated design, there are several risk factors that need attention:
|
||
|
|
|
||
|
|
1. **Frequent Trading Risk**: As a high-frequency strategy, it may generate numerous trades, leading to high transaction costs, especially in markets with high fees. The solution is to adjust the grid factor and profit target to reduce trading frequency or increase per-trade profit.
|
||
|
|
|
||
|
|
2. **Counter-trend Risk in Trending Markets**: This strategy is essentially a pullback capture strategy and may frequently trigger counter-trend trades in strong trending markets, resulting in consecutive losses. The solution is to add a trend filter to pause counter-trend trading when strong trends are identified.
|
||
|
|
|
||
|
|
3. **Parameter Sensitivity**: Strategy effectiveness is highly dependent on parameters such as ATR length, grid factor, and profit target. Different markets and timeframes may require different parameter combinations. Comprehensive parameter optimization and backtesting are recommended.
|
||
|
|
|
||
|
|
4. **No Trade Zone Setting Sensitivity**: An excessively high no-trade zone value may cause missed opportunities, while a value too low may lead to undesirable trades in low volatility environments. This parameter should be adjusted based on the typical volatility characteristics of the specific market.
|
||
|
|
|
||
|
|
5. **Imperfect Stop-Loss Mechanism**: Although the strategy includes trailing stops, it lacks hard stop-loss settings and may sustain significant losses under extreme market conditions. Adding hard stop-loss limits based on fixed points or percentages is recommended.
|
||
|
|
|
||
|
|
#### Strategy Optimization Directions
|
||
|
|
Based on code analysis, the strategy can be optimized in the following directions:
|
||
|
|
|
||
|
|
1. **Add Trend Filter**: Integrate medium to long-term trend indicators (such as moving average crossovers or MACD) to avoid counter-trend trading in strong trending markets. This can significantly reduce losing trades, as pullback strategies typically perform better when aligned with the main trend.
|
||
|
|
|
||
|
|
2. **Dynamic Profit Targets**: The current profit target is fixed at 0.2% and could be changed to a dynamic value based on ATR, allowing it to set higher targets during high volatility periods and more conservative targets during low volatility periods. This will improve strategy adaptability under different market conditions.
|
||
|
|
|
||
|
|
3. **Time Filter**: Add trading time window filtering to avoid trading during abnormal volatility market opening/closing sessions or important economic data release periods. This can reduce false signals caused by short-term abnormal volatility.
|
||
|
|
|
||
|
|
4. **Quantify RSI Conditions**: Currently, RSI uses fixed 30/70 thresholds. Consider using dynamic thresholds, such as calculating RSI's average and standard deviation, triggering signals when RSI deviates from the average by specific standard deviations. This approach can better adapt to different market RSI characteristics.
|
||
|
|
|
||
|
|
5. **Add Volume Confirmation**: Include volume confirmation in entry conditions to ensure trades are only executed when significant volume is present. This can improve signal quality and reduce erroneous trades caused by market noise.
|
||
|
|
|
||
|
|
6. **Optimize Grid Density**: The current strategy uses 15 fixed grid points. Consider dynamically adjusting the number and density of grids based on market volatility. Increase grid density in high volatility markets and reduce grid points in low volatility markets to enhance strategy flexibility.
|
||
|
|
|
||
|
|
#### Conclusion
|
||
|
|
The Dynamic ATR Grid Pullback Capture Quantitative Trading Strategy is a high-frequency trading system combining ATR dynamic grids and RSI filtering, specifically designed for capturing short-term market pullbacks. It ensures trading at technically reasonable price levels through a dynamic grid system based on market volatility, while improving signal quality through RSI filtering and volatility detection.
|
||
|
|
|
||
|
|
The strategy's main advantage lies in its ability to dynamically adapt to different market environments and its strict trading rules, though it may face challenges in strongly trending markets. By adding trend filters, optimizing grid density, and implementing dynamic profit targets, the strategy's robustness and performance can be further enhanced.
|
||
|
|
|
||
|
|
For experienced short-term traders, this strategy provides a systematic method to capture price pullbacks, particularly suitable for markets with significant volatility. However, as with all trading strategies, thorough backtesting and parameter optimization should be conducted before practical application, and it should be used in conjunction with appropriate money management rules.[/trans]
|
||
|
|
|
||
|
|
|
||
|
|
|
||
|
|
> Source (PineScript)
|
||
|
|
|
||
|
|
``` pinescript
|
||
|
|
/*backtest
|
||
|
|
start: 2024-04-07 00:00:00
|
||
|
|
end: 2025-04-06 00:00:00
|
||
|
|
period: 2d
|
||
|
|
basePeriod: 2d
|
||
|
|
exchanges: [{"eid":"Futures_Binance","currency":"ETH_USDT"}]
|
||
|
|
*/
|
||
|
|
|
||
|
|
//@version=6
|
||
|
|
strategy("Smart Grid Scalping (Pullback) Strategy[BullByte]", overlay=true, shorttitle="SGS Scalping")
|
||
|
|
|
||
|
|
// ===== Input Parameters =====
|
||
|
|
atrLength = input(10, title="ATR Length") // ATR period for volatility measurement
|
||
|
|
gridFactor = input(0.2, title="Grid Factor") // Multiplier to determine grid spacing based on ATR
|
||
|
|
profitTarget = input(0.002, title="Profit Target (0.1% = 0.001)")
|
||
|
|
noTradeZone = input(0.005, title="No Trade Zone (%)") // Defines a price range where trades are avoided
|
||
|
|
|
||
|
|
// ===== ATR Calculation =====
|
||
|
|
atrValue = ta.atr(atrLength)
|
||
|
|
|
||
|
|
// ===== Grid Level Calculation =====
|
||
|
|
gridLevels = array.new_float(15) // Create an array to hold 15 grid levels
|
||
|
|
for i = 0 to 14
|
||
|
|
array.set(gridLevels, i, close + (i + 1) * atrValue * gridFactor)
|
||
|
|
|
||
|
|
|
||
|
|
// ===== Trading Logic =====
|
||
|
|
// Additional RSI filter for extra confirmation
|
||
|
|
rsiValue = ta.rsi(close, 14)
|
||
|
|
|
||
|
|
// Conditions for entry:
|
||
|
|
// - Long: Price is below the first grid level, volatility is above the no trade zone, and RSI indicates oversold (<30).
|
||
|
|
// - Short: Price is above the last grid level, volatility is above the no trade zone, and RSI indicates overbought (>70).
|
||
|
|
longCondition = close < array.get(gridLevels, 0) and (high - low) / low > noTradeZone and rsiValue < 30
|
||
|
|
shortCondition = close > array.get(gridLevels, 14) and (high - low) / high > noTradeZone and rsiValue > 70
|
||
|
|
|
||
|
|
if (longCondition)
|
||
|
|
strategy.entry("Long", strategy.long)
|
||
|
|
|
||
|
|
if (shortCondition)
|
||
|
|
strategy.entry("Short", strategy.short)
|
||
|
|
|
||
|
|
// ===== Take Profit with Trailing Stop Logic =====
|
||
|
|
if (strategy.position_size > 0)
|
||
|
|
strategy.exit("Take Profit", "Long",
|
||
|
|
limit=close * (1 + profitTarget),
|
||
|
|
trail_price=close * (1 + profitTarget * 0.5),
|
||
|
|
trail_offset=atrValue)
|
||
|
|
|
||
|
|
if (strategy.position_size < 0)
|
||
|
|
strategy.exit("Take Profit", "Short",
|
||
|
|
limit=close * (1 - profitTarget),
|
||
|
|
trail_price=close * (1 - profitTarget * 0.5),
|
||
|
|
trail_offset=atrValue)
|
||
|
|
|
||
|
|
// ===== Plot Trade Entry Labels =====
|
||
|
|
// Plot labels only on the bar where the position is initiated
|
||
|
|
longEntry = strategy.position_size > 0 and (strategy.position_size[1] <= 0)
|
||
|
|
shortEntry = strategy.position_size < 0 and (strategy.position_size[1] >= 0)
|
||
|
|
|
||
|
|
plotshape(longEntry, location=location.belowbar,
|
||
|
|
color=color.new(color.green, 0), style=shape.labelup, text="LONG", textcolor=color.white, size=size.normal)
|
||
|
|
|
||
|
|
plotshape(shortEntry, location=location.abovebar,
|
||
|
|
color=color.new(color.red, 0), style=shape.labeldown, text="SHORT", textcolor=color.white, size=size.normal)
|
||
|
|
|
||
|
|
```
|
||
|
|
|
||
|
|
> Detail
|
||
|
|
|
||
|
|
https://www.fmz.com/strategy/489656
|
||
|
|
|
||
|
|
> Last Modified
|
||
|
|
|
||
|
|
2025-04-07 13:47:24
|