201 lines
11 KiB
Markdown
201 lines
11 KiB
Markdown

|
|
||
|
|
> Name
|
||
|
|
|
||
|
|
动态趋势跟踪与波动率过滤策略基于ADX与CI双重确认的均线交叉系统-Dynamic-Trend-Following-with-Volatility-Filtering-ADX-and-CI-Dual-Confirmed-Moving-Average-Crossover-System
|
||
|
|
|
||
|
|
> Author
|
||
|
|
|
||
|
|
ianzeng123
|
||
|
|
|
||
|
|
> Strategy Description
|
||
|
|
|
||
|
|
|
||
|
|
|
||
|
|
|
||
|
|
|
||
|
|
|
||
|
|
|
||
|
|
[trans]
|
||
|
|
#### 概述
|
||
|
|
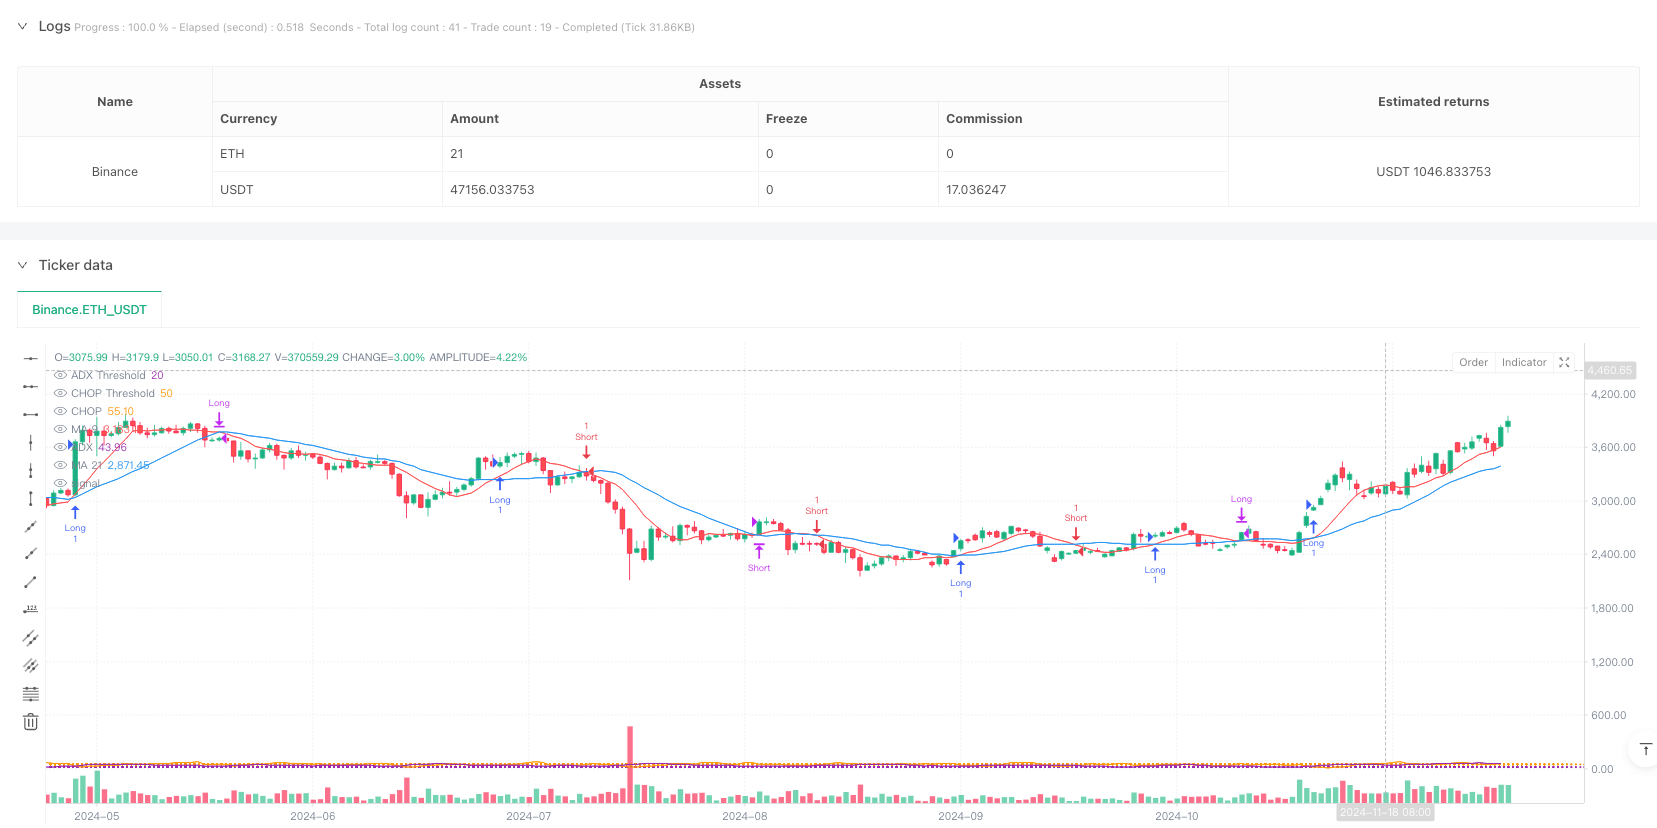
本策略是一个结合了均线交叉信号与市场状态过滤的交易系统。它通过9周期与21周期简单移动平均线(SMA)的交叉来捕捉市场趋势,同时利用平均方向指数(ADX)和混沌指数(Choppiness Index, CI)来过滤市场环境,确保只在趋势明确且波动特征良好的市场中进行交易。这种方法有效地将传统的趋势跟踪策略与现代技术指标相结合,提供了一个更加稳健的交易框架。
|
||
|
|
|
||
|
|
#### 策略原理
|
||
|
|
策略的核心逻辑包含三个关键组成部分:
|
||
|
|
1. 趋势信号生成:使用9周期和21周期SMA的交叉来确定趋势方向,形成基础的交易信号。
|
||
|
|
2. 趋势强度确认:通过ADX指标(设定阈值为20)来验证趋势的强度,确保只在趋势明确的市场环境中交易。
|
||
|
|
3. 市场波动过滤:引入混沌指数(阈值设为50)来识别市场的波动特征,避免在剧烈震荡的市场中交易。
|
||
|
|
|
||
|
|
策略采用了优化的技术指标计算方法,包括自定义的求和函数、最高值和最低值计算,以及标准化的真实波幅(TR)计算,确保了信号的准确性和计算效率。
|
||
|
|
|
||
|
|
#### 策略优势
|
||
|
|
1. 多重确认机制:通过结合均线交叉、ADX和CI三重过滤,显著提高了交易信号的可靠性。
|
||
|
|
2. 适应性强:策略参数可根据不同市场环境进行调整,具有良好的适应性。
|
||
|
|
3. 风险控制完善:通过CI指数过滤掉高波动期间,有效降低了假突破带来的风险。
|
||
|
|
4. 计算效率高:采用优化的计算方法,特别是在处理历史数据时表现出色。
|
||
|
|
|
||
|
|
#### 策略风险
|
||
|
|
1. 参数敏感性:策略效果高度依赖于ADX和CI的阈值设置,不同市场环境可能需要不同的参数配置。
|
||
|
|
2. 滞后性:由于使用了多个移动平均指标,可能存在信号滞后的问题。
|
||
|
|
3. 震荡市场表现:在横盘震荡市场中,可能会错过一些短线交易机会。
|
||
|
|
4. 计算复杂度:多重指标的计算增加了策略的复杂度,可能影响实时交易的执行效率。
|
||
|
|
|
||
|
|
#### 策略优化方向
|
||
|
|
1. 动态参数调整:引入自适应参数调整机制,根据市场状态动态调整ADX和CI的阈值。
|
||
|
|
2. 止损优化:增加动态止损机制,可以基于ATR或Volatility Bands设计更灵活的止损策略。
|
||
|
|
3. 信号确认增强:可以考虑添加成交量确认机制,进一步提高信号可靠性。
|
||
|
|
4. 计算效率提升:优化指标计算方法,特别是在处理长周期数据时的性能表现。
|
||
|
|
|
||
|
|
#### 总结
|
||
|
|
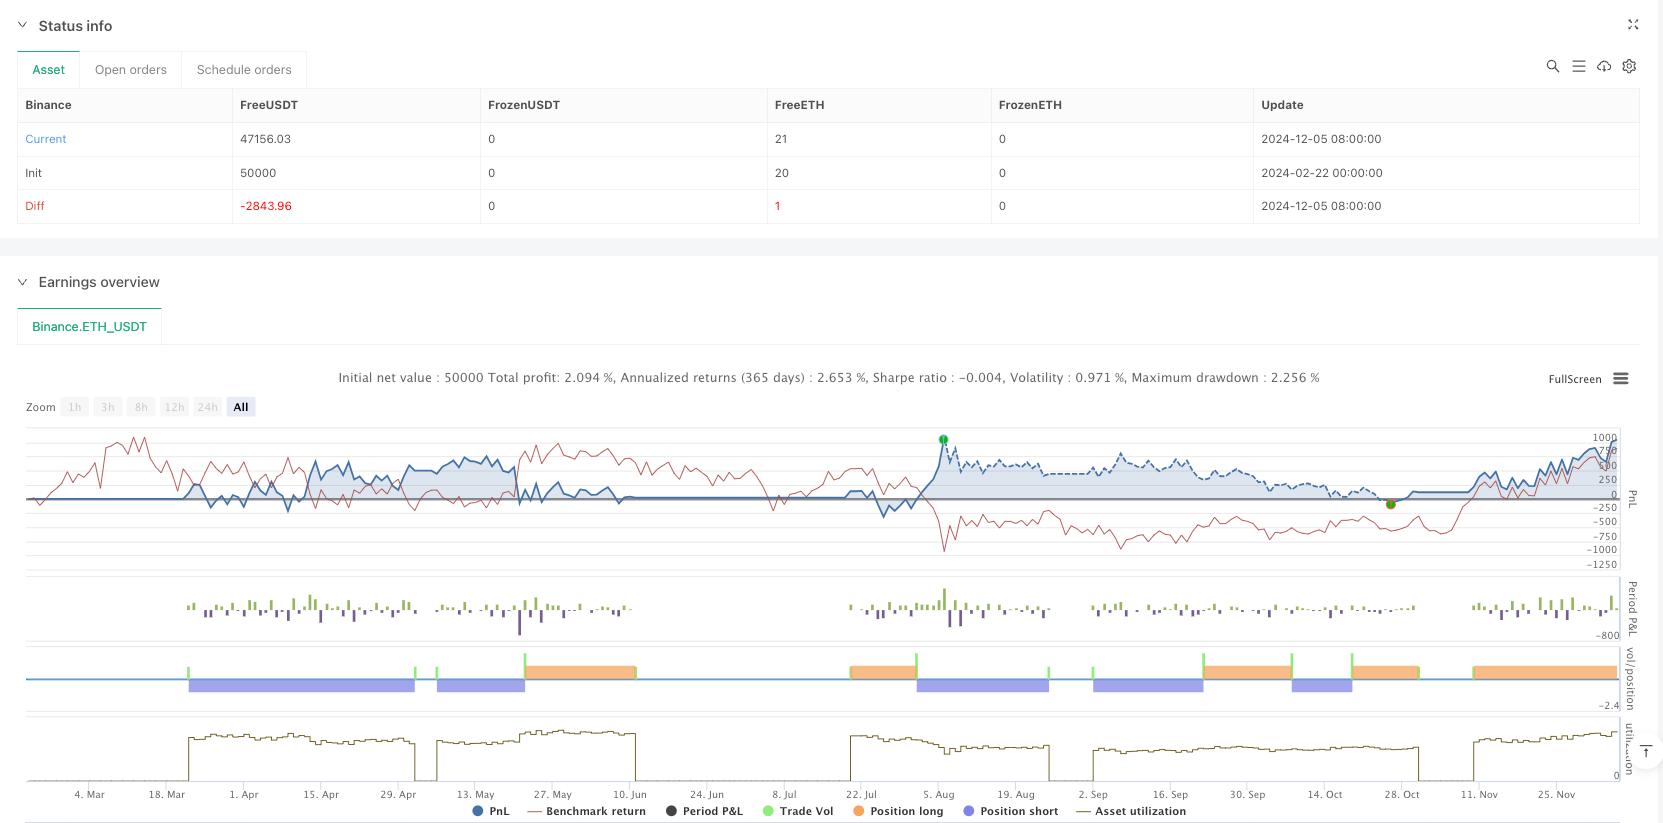
该策略通过将经典的均线交叉策略与现代技术指标相结合,构建了一个完整的交易系统。它不仅注重趋势的捕捉,还特别关注市场环境的适宜性,通过多重过滤机制提高了交易的稳定性。虽然存在一定的参数敏感性和滞后性问题,但通过提出的优化方向,策略仍有较大的改进空间。整体而言,这是一个逻辑完整、实用性强的交易策略。
|
||
|
|
|
||
|
|
||
|
||
|
|
|
||
|
|
#### Overview
|
||
|
|
This strategy combines moving average crossover signals with market state filtering. It captures market trends through the intersection of 9-period and 21-period Simple Moving Averages (SMA) while utilizing the Average Directional Index (ADX) and Choppiness Index (CI) to filter market conditions, ensuring trades are only executed in clear trending markets with favorable volatility characteristics. This approach effectively combines traditional trend-following strategies with modern technical indicators to provide a more robust trading framework.
|
||
|
|
|
||
|
|
#### Strategy Principles
|
||
|
|
The core logic consists of three key components:
|
||
|
|
1. Trend Signal Generation: Uses 9-period and 21-period SMA crossovers to determine trend direction and generate basic trading signals.
|
||
|
|
2. Trend Strength Confirmation: Validates trend strength through the ADX indicator (threshold set at 20) to ensure trading only in clear trending market conditions.
|
||
|
|
3. Market Volatility Filtering: Incorporates the Choppiness Index (threshold at 50) to identify market volatility characteristics and avoid trading in highly choppy markets.
|
||
|
|
|
||
|
|
The strategy employs optimized technical indicator calculations, including custom sum functions, highest and lowest value calculations, and standardized True Range (TR) calculations, ensuring signal accuracy and computational efficiency.
|
||
|
|
|
||
|
|
#### Strategy Advantages
|
||
|
|
1. Multiple Confirmation Mechanism: Combines MA crossover, ADX, and CI triple filtering to significantly improve trading signal reliability.
|
||
|
|
2. High Adaptability: Strategy parameters can be adjusted for different market environments, providing good adaptability.
|
||
|
|
3. Comprehensive Risk Control: Effectively reduces false breakout risks by filtering out high volatility periods using the CI index.
|
||
|
|
4. High Computational Efficiency: Employs optimized calculation methods, particularly excelling in historical data processing.
|
||
|
|
|
||
|
|
#### Strategy Risks
|
||
|
|
1. Parameter Sensitivity: Strategy effectiveness highly depends on ADX and CI threshold settings, different market environments may require different parameter configurations.
|
||
|
|
2. Lag Issues: Multiple moving average indicators may result in delayed signals.
|
||
|
|
3. Sideways Market Performance: May miss some short-term trading opportunities in range-bound markets.
|
||
|
|
4. Computational Complexity: Multiple indicator calculations increase strategy complexity, potentially affecting real-time trading execution efficiency.
|
||
|
|
|
||
|
|
#### Strategy Optimization Directions
|
||
|
|
1. Dynamic Parameter Adjustment: Introduce adaptive parameter adjustment mechanisms to dynamically modify ADX and CI thresholds based on market conditions.
|
||
|
|
2. Stop Loss Optimization: Add dynamic stop-loss mechanisms, potentially designing more flexible stop-loss strategies based on ATR or Volatility Bands.
|
||
|
|
3. Signal Confirmation Enhancement: Consider adding volume confirmation mechanisms to further improve signal reliability.
|
||
|
|
4. Computational Efficiency Improvement: Optimize indicator calculation methods, especially performance in handling long-period data.
|
||
|
|
|
||
|
|
#### Summary
|
||
|
|
This strategy constructs a complete trading system by combining classical moving average crossover strategy with modern technical indicators. It focuses not only on trend capture but also pays special attention to market environment suitability, enhancing trading stability through multiple filtering mechanisms. While there are some parameter sensitivity and lag issues, there is significant room for improvement through the proposed optimization directions. Overall, this is a logically complete and highly practical trading strategy.
|
||
|
|
|
||
|
|
[/trans]
|
||
|
|
|
||
|
|
|
||
|
|
|
||
|
|
> Source (PineScript)
|
||
|
|
|
||
|
|
``` pinescript
|
||
|
|
/*backtest
|
||
|
|
start: 2024-02-22 00:00:00
|
||
|
|
end: 2024-12-06 00:00:00
|
||
|
|
period: 1d
|
||
|
|
basePeriod: 1d
|
||
|
|
exchanges: [{"eid":"Binance","currency":"ETH_USDT"}]
|
||
|
|
*/
|
||
|
|
|
||
|
|
//@version=6
|
||
|
|
strategy("MA9/MA21 Cross with ADX & CHOP Filter", overlay=true, initial_capital=10000, currency=currency.USD)
|
||
|
|
|
||
|
|
// ─── CUSTOM FUNCTIONS ──────────────────────────────────────────────────────
|
||
|
|
// Custom function to compute the sum over the last 'len' bars.
|
||
|
|
f_sum(src, len) =>
|
||
|
|
s = 0.0
|
||
|
|
for i = 0 to len - 1
|
||
|
|
s += src[i]
|
||
|
|
s
|
||
|
|
|
||
|
|
// Custom function to compute the highest value over the last 'len' bars.
|
||
|
|
f_highest(src, len) =>
|
||
|
|
h = src[0]
|
||
|
|
for i = 1 to len - 1
|
||
|
|
h := math.max(h, src[i])
|
||
|
|
h
|
||
|
|
|
||
|
|
// Custom function to compute the lowest value over the last 'len' bars.
|
||
|
|
f_lowest(src, len) =>
|
||
|
|
l = src[0]
|
||
|
|
for i = 1 to len - 1
|
||
|
|
l := math.min(l, src[i])
|
||
|
|
l
|
||
|
|
|
||
|
|
// ─── INPUTS ──────────────────────────────────────────────────────────────
|
||
|
|
ma9Period = input.int(9, title="MA 9 Period", minval=1)
|
||
|
|
ma21Period = input.int(21, title="MA 21 Period", minval=1)
|
||
|
|
adxLength = input.int(7, title="ADX Smoothing / DI Length", minval=1)
|
||
|
|
adxThresh = input.float(20.0, title="ADX Threshold", step=0.1)
|
||
|
|
chopLen = input.int(7, title="CHOP Length", minval=1)
|
||
|
|
chopOff = input.int(0, title="CHOP Offset", minval=0) // Not applied in calculation
|
||
|
|
chopThresh = input.float(50.0, title="CHOP Maximum (do not trade if above)", step=0.1)
|
||
|
|
|
||
|
|
// ─── CALCULATE INDICATORS ────────────────────────────────────────────────────
|
||
|
|
// Moving Averages
|
||
|
|
ma9 = ta.sma(close, ma9Period)
|
||
|
|
ma21 = ta.sma(close, ma21Period)
|
||
|
|
|
||
|
|
// --- True Range Calculation ---
|
||
|
|
// Manual implementation of true range (tr)
|
||
|
|
tr = math.max(math.max(high - low, math.abs(high - nz(close[1]))), math.abs(low - nz(close[1])))
|
||
|
|
|
||
|
|
// --- ADX Calculation (Manual Implementation) ---
|
||
|
|
// Calculate directional movements
|
||
|
|
upMove = high - nz(high[1])
|
||
|
|
downMove = nz(low[1]) - low
|
||
|
|
plusDM = (upMove > downMove and upMove > 0) ? upMove : 0.0
|
||
|
|
minusDM = (downMove > upMove and downMove > 0) ? downMove : 0.0
|
||
|
|
|
||
|
|
// Smooth the values using the built-in rma function
|
||
|
|
atr = ta.rma(tr, adxLength)
|
||
|
|
plusDI = 100 * ta.rma(plusDM, adxLength) / atr
|
||
|
|
minusDI = 100 * ta.rma(minusDM, adxLength) / atr
|
||
|
|
dx = 100 * math.abs(plusDI - minusDI) / (plusDI + minusDI)
|
||
|
|
adxValue = ta.rma(dx, adxLength)
|
||
|
|
|
||
|
|
// --- Choppiness Index Calculation ---
|
||
|
|
// Compute the sum of true range over chopLen periods
|
||
|
|
atrSum = f_sum(tr, chopLen)
|
||
|
|
// Compute highest high and lowest low over chopLen periods using custom functions
|
||
|
|
highestHigh = f_highest(high, chopLen)
|
||
|
|
lowestLow = f_lowest(low, chopLen)
|
||
|
|
priceRange = highestHigh - lowestLow
|
||
|
|
chop = priceRange != 0 ? 100 * math.log(atrSum / priceRange) / math.log(chopLen) : 0
|
||
|
|
|
||
|
|
// ─── STRATEGY CONDITIONS ─────────────────────────────────────────────────────
|
||
|
|
// MA Crossover Signals
|
||
|
|
longCond = ta.crossover(ma9, ma21)
|
||
|
|
shortCond = ta.crossunder(ma9, ma21)
|
||
|
|
|
||
|
|
// Filter: Only trade if ADX > threshold and CHOP ≤ threshold.
|
||
|
|
filterCond = (adxValue > adxThresh) and (chop <= chopThresh)
|
||
|
|
|
||
|
|
// Entries and Exits
|
||
|
|
if longCond and filterCond
|
||
|
|
strategy.entry("Long", strategy.long)
|
||
|
|
if shortCond and filterCond
|
||
|
|
strategy.entry("Short", strategy.short)
|
||
|
|
if shortCond
|
||
|
|
strategy.close("Long")
|
||
|
|
if longCond
|
||
|
|
strategy.close("Short")
|
||
|
|
|
||
|
|
// ─── PLOTTING ──────────────────────────────────────────────────────────────
|
||
|
|
plot(ma9, color=color.red, title="MA 9")
|
||
|
|
plot(ma21, color=color.blue, title="MA 21")
|
||
|
|
plot(adxValue, title="ADX", color=color.purple)
|
||
|
|
hline(adxThresh, title="ADX Threshold", color=color.purple, linestyle=hline.style_dotted)
|
||
|
|
plot(chop, title="CHOP", color=color.orange)
|
||
|
|
hline(chopThresh, title="CHOP Threshold", color=color.orange, linestyle=hline.style_dotted)
|
||
|
|
|
||
|
|
```
|
||
|
|
|
||
|
|
> Detail
|
||
|
|
|
||
|
|
https://www.fmz.com/strategy/483023
|
||
|
|
|
||
|
|
> Last Modified
|
||
|
|
|
||
|
|
2025-02-21 09:33:38
|