264 lines
17 KiB
Markdown
264 lines
17 KiB
Markdown

|
|
|||
|
|
> Name
|
|||
|
|
|
|||
|
|
动态波动率自适应EMAxRSI交叉策略-Dynamic-Volatility-Adaptive-EMA-RSI-Crossover-Strategy
|
|||
|
|
|
|||
|
|
> Author
|
|||
|
|
|
|||
|
|
ianzeng123
|
|||
|
|
|
|||
|
|
> Strategy Description
|
|||
|
|
|
|||
|
|
|
|||
|
|
|
|||
|
|
|
|||
|
|
|
|||
|
|
[trans]
|
|||
|
|
|
|||
|
|
#### 概述
|
|||
|
|
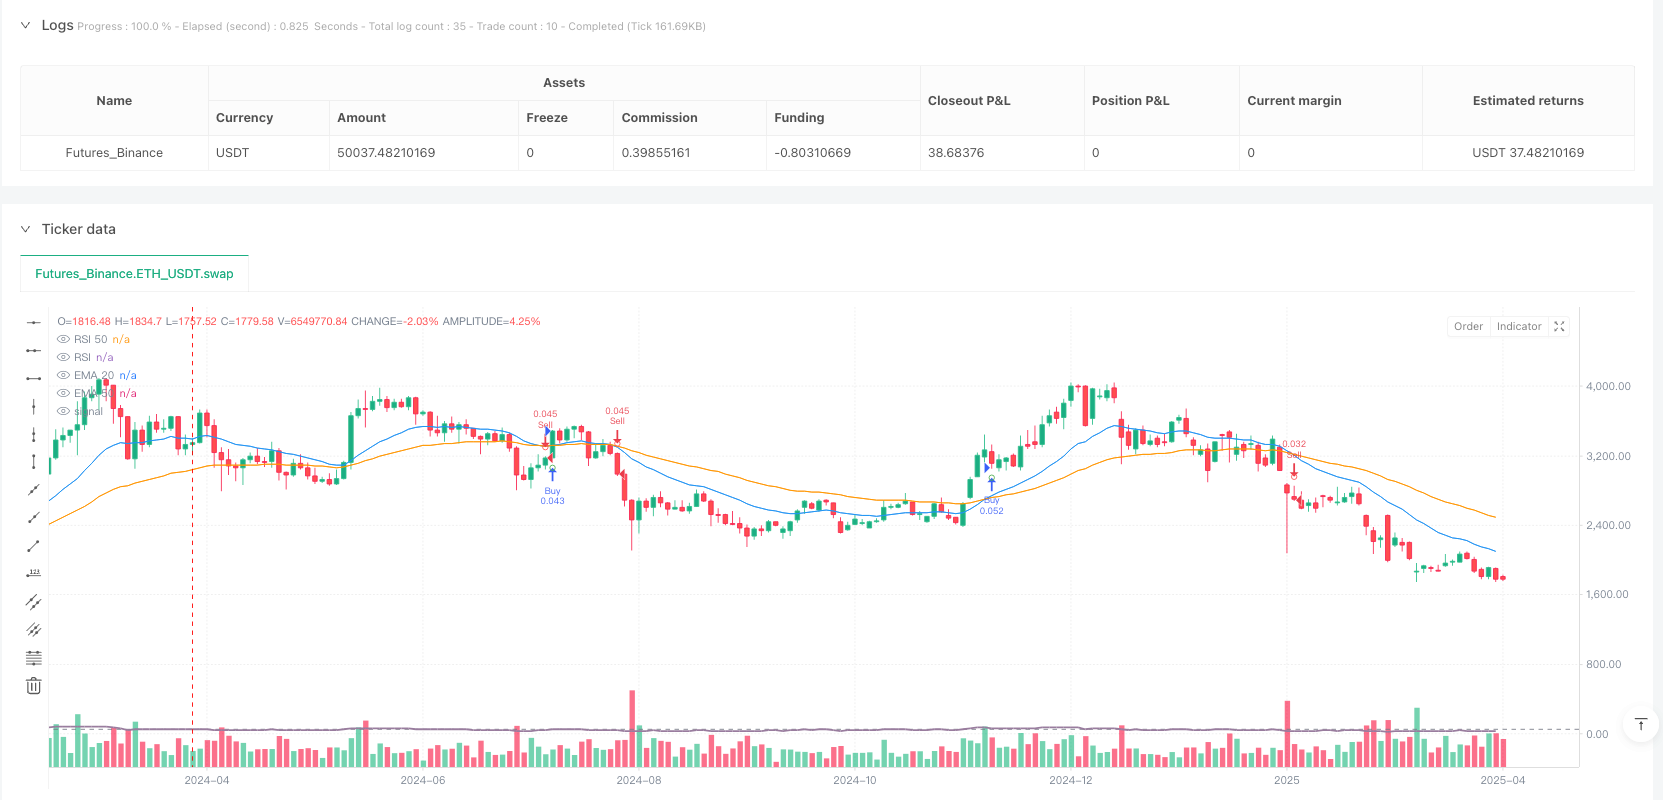
动态波动率自适应EMAxRSI交叉策略是一个融合技术分析与风险管理的量化交易系统。该策略核心基于EMA交叉信号,结合RSI指标进行过滤确认,并通过ATR动态调整止损止盈水平。策略特点在于不仅关注入场时机,还根据市场波动率自动调整仓位大小,同时设置了趋势反转时的自动平仓机制,形成了一个完整的交易闭环系统。
|
|||
|
|
|
|||
|
|
#### 策略原理
|
|||
|
|
该策略运用多重技术指标组合判断市场趋势与入场时机,具体逻辑如下:
|
|||
|
|
|
|||
|
|
1. **趋势判断与入场信号**:
|
|||
|
|
- 使用20周期与50周期指数移动平均线(EMA)的交叉作为基础信号
|
|||
|
|
- 当短期EMA(20)上穿长期EMA(50)且收盘价高于EMA(50)时,形成潜在买入信号
|
|||
|
|
- 当短期EMA(20)下穿长期EMA(50)且收盘价低于EMA(50)时,形成潜在卖出信号
|
|||
|
|
|
|||
|
|
2. **RSI过滤确认**:
|
|||
|
|
- 使用14周期RSI作为信号过滤器
|
|||
|
|
- 买入信号需RSI低于70(非超买区域)
|
|||
|
|
- 卖出信号需RSI高于30(非超卖区域)
|
|||
|
|
|
|||
|
|
3. **风险管理机制**:
|
|||
|
|
- 基于14周期ATR计算市场波动率
|
|||
|
|
- 止损距离 = ATR × 止损乘数(默认为1)
|
|||
|
|
- 止盈距离 = ATR × 止盈乘数(默认为2)
|
|||
|
|
- 风险金额 = 总资金 × 单笔风险百分比(默认1%)
|
|||
|
|
- 仓位大小 = 风险金额 ÷ 止损距离
|
|||
|
|
|
|||
|
|
4. **趋势反转平仓**:
|
|||
|
|
- 当出现反方向信号时自动平仓,无需等待止损或止盈触发
|
|||
|
|
- 买入持仓在确认卖出信号出现时关闭
|
|||
|
|
- 卖出持仓在确认买入信号出现时关闭
|
|||
|
|
|
|||
|
|
#### 策略优势
|
|||
|
|
分析此策略代码,可以总结出以下显著优势:
|
|||
|
|
|
|||
|
|
1. **动态风险管理**:策略不使用固定止损点位,而是通过ATR自适应市场波动率调整止损距离,使止损设置既不会过于紧密被市场噪音触及,也不会过于宽松导致单笔损失过大。
|
|||
|
|
|
|||
|
|
2. **比例风险分配**:通过精确计算每笔交易的风险比例,确保单笔交易损失控制在总资金的预设百分比内(默认1%),有效防止爆仓风险。
|
|||
|
|
|
|||
|
|
3. **趋势跟随与自适应**:结合EMA交叉与RSI过滤,既能跟随主要趋势,又能避免在超买超卖区域做出逆势交易,提高信号质量。
|
|||
|
|
|
|||
|
|
4. **风险收益比优化**:默认设置止盈距离为止损距离的2倍,确保良好的风险收益比,这是长期稳定盈利的重要因素。
|
|||
|
|
|
|||
|
|
5. **趋势反转保护**:趋势反转时的自动平仓机制,有助于及时锁定利润或减少损失,避免持仓面临大幅回撤。
|
|||
|
|
|
|||
|
|
#### 策略风险
|
|||
|
|
尽管该策略设计全面,但依然存在以下潜在风险:
|
|||
|
|
|
|||
|
|
1. **假突破风险**:EMA交叉可能会产生假突破信号,特别是在横盘震荡市场中。解决方法是考虑增加成交量确认或增加信号过滤条件,如使用趋势强度指标ADX。
|
|||
|
|
|
|||
|
|
2. **滑点与差价影响**:策略中未考虑实际交易中的滑点与差价因素,可能导致实际执行结果偏离回测结果。解决方法是在实际部署时调整止损与止盈距离,预留滑点空间。
|
|||
|
|
|
|||
|
|
3. **参数敏感性**:策略效果对EMA周期、RSI阈值、ATR乘数等参数设置较为敏感。解决方法是进行全面的参数优化和稳健性测试,确保参数不过度拟合历史数据。
|
|||
|
|
|
|||
|
|
4. **趋势转换频繁**:在震荡市场中,EMA可能频繁交叉,导致过度交易和手续费侵蚀。解决方法是增加趋势持续时间的过滤条件或调整更长周期的EMA参数。
|
|||
|
|
|
|||
|
|
5. **资金管理风险**:虽然策略内置资金管理机制,但未考虑相关性资产同时亏损情况。解决方法是实施组合风险管理,控制相关性资产的总体风险敞口。
|
|||
|
|
|
|||
|
|
#### 策略优化方向
|
|||
|
|
基于代码分析,该策略有以下几个可行的优化方向:
|
|||
|
|
|
|||
|
|
1. **增加趋势强度过滤**:引入ADX指标评估趋势强度,仅在趋势明确(如ADX>25)时执行交易,可以显著减少假信号和震荡市场中的不必要交易。
|
|||
|
|
|
|||
|
|
2. **优化入场时机**:考虑增加蜡烛图形态或支撑/阻力水平确认,如等待价格回调到移动平均线后反弹时入场,而非直接在交叉点入场,可以获得更优的入场价格。
|
|||
|
|
|
|||
|
|
3. **自适应参数设置**:基于市场状态(高波动率vs低波动率)自动调整EMA周期和RSI阈值,使策略能更好地适应不同市场环境。
|
|||
|
|
|
|||
|
|
4. **增加时间过滤**:加入交易时段过滤条件,避开市场流动性不足或波动异常的时段,可以提高交易质量。
|
|||
|
|
|
|||
|
|
5. **优化资金管理**:实现递进式头寸管理,在连续盈利后适度增加头寸规模,连续亏损后减少风险敞口,以优化资金曲线。
|
|||
|
|
|
|||
|
|
6. **部分利润锁定机制**:引入多层次止盈策略,如盈利达到一定水平时移动止损至成本价或分批平仓,既保证利润锁定又不错过大行情。
|
|||
|
|
|
|||
|
|
#### 总结
|
|||
|
|
动态波动率自适应EMAxRSI交叉策略是一个结构完整、逻辑清晰的量化交易系统,它通过技术指标组合识别趋势,结合动态资金管理和风险控制机制,形成了有效的交易决策框架。策略优势在于自适应市场波动率调整止损止盈位置和头寸大小,同时通过RSI过滤和趋势反转平仓提高信号质量。尽管存在假突破和参数敏感等风险,但通过建议的优化方向,如增加趋势强度过滤、优化入场时机和引入自适应参数,这些问题有望得到有效缓解。总体而言,该策略提供了一个坚实的量化交易基础,适合进一步细化和优化以适应不同市场环境和个人风险偏好。 ||
|
|||
|
|
|
|||
|
|
#### Overview
|
|||
|
|
The Dynamic Volatility-Adaptive EMA-RSI Crossover Strategy is a quantitative trading system that integrates technical analysis with comprehensive risk management. This strategy primarily relies on EMA crossover signals, filtered by RSI confirmation, and dynamically adjusts stop-loss and take-profit levels using ATR-based volatility measurements. What distinguishes this strategy is its focus not only on entry timing but also on position sizing based on market volatility, coupled with an automatic position closing mechanism when trend reversals occur, forming a complete trading loop system.
|
|||
|
|
|
|||
|
|
#### Strategy Principles
|
|||
|
|
This strategy employs multiple technical indicators to determine market trends and entry points, with the following specific logic:
|
|||
|
|
|
|||
|
|
1. **Trend Identification and Entry Signals**:
|
|||
|
|
- Uses crossovers between 20-period and 50-period Exponential Moving Averages (EMA) as base signals
|
|||
|
|
- When the short-term EMA(20) crosses above the long-term EMA(50) and the closing price is above EMA(50), a potential buy signal is generated
|
|||
|
|
- When the short-term EMA(20) crosses below the long-term EMA(50) and the closing price is below EMA(50), a potential sell signal is generated
|
|||
|
|
|
|||
|
|
2. **RSI Filtering Confirmation**:
|
|||
|
|
- Uses 14-period RSI as a signal filter
|
|||
|
|
- Buy signals require RSI below 70 (not in overbought territory)
|
|||
|
|
- Sell signals require RSI above 30 (not in oversold territory)
|
|||
|
|
|
|||
|
|
3. **Risk Management Mechanism**:
|
|||
|
|
- Calculates market volatility based on 14-period ATR
|
|||
|
|
- Stop-loss distance = ATR × Stop-loss multiplier (default 1)
|
|||
|
|
- Take-profit distance = ATR × Take-profit multiplier (default 2)
|
|||
|
|
- Risk amount = Total capital × Per-trade risk percentage (default 1%)
|
|||
|
|
- Position size = Risk amount ÷ Stop-loss distance
|
|||
|
|
|
|||
|
|
4. **Trend Reversal Closing**:
|
|||
|
|
- Automatically closes positions when opposite signals occur, without waiting for stop-loss or take-profit triggers
|
|||
|
|
- Buy positions are closed when confirmed sell signals appear
|
|||
|
|
- Sell positions are closed when confirmed buy signals appear
|
|||
|
|
|
|||
|
|
#### Strategy Advantages
|
|||
|
|
Analyzing this strategy code reveals the following significant advantages:
|
|||
|
|
|
|||
|
|
1. **Dynamic Risk Management**: The strategy doesn't use fixed stop-loss points but adapts stop-loss distances to market volatility through ATR, ensuring stop-loss settings are neither too tight to be triggered by market noise nor too loose to cause excessive per-trade losses.
|
|||
|
|
|
|||
|
|
2. **Proportional Risk Allocation**: By precisely calculating the risk proportion for each trade, it ensures single-trade losses are controlled within a preset percentage of total capital (default 1%), effectively preventing account blowout risk.
|
|||
|
|
|
|||
|
|
3. **Trend Following and Adaptability**: By combining EMA crossovers with RSI filtering, the strategy can both follow major trends and avoid counter-trend trades in overbought or oversold areas, improving signal quality.
|
|||
|
|
|
|||
|
|
4. **Optimized Risk-Reward Ratio**: The default setting makes take-profit distance twice the stop-loss distance, ensuring a favorable risk-reward ratio, which is crucial for long-term stable profitability.
|
|||
|
|
|
|||
|
|
5. **Trend Reversal Protection**: The automatic position closing mechanism when trends reverse helps secure profits or reduce losses promptly, preventing positions from facing significant drawdowns.
|
|||
|
|
|
|||
|
|
#### Strategy Risks
|
|||
|
|
Despite its comprehensive design, the strategy still has these potential risks:
|
|||
|
|
|
|||
|
|
1. **False Breakout Risk**: EMA crossovers may generate false breakout signals, especially in ranging markets. Solution: Consider adding volume confirmation or additional filtering conditions, such as using the ADX trend strength indicator.
|
|||
|
|
|
|||
|
|
2. **Slippage and Spread Impact**: The strategy doesn't account for slippage and spread factors in actual trading, which may cause actual execution results to deviate from backtesting results. Solution: Adjust stop-loss and take-profit distances when deploying in real markets, allowing for slippage.
|
|||
|
|
|
|||
|
|
3. **Parameter Sensitivity**: Strategy performance is sensitive to parameter settings such as EMA periods, RSI thresholds, and ATR multipliers. Solution: Conduct comprehensive parameter optimization and robustness testing to ensure parameters aren't overfitted to historical data.
|
|||
|
|
|
|||
|
|
4. **Frequent Trend Changes**: In choppy markets, EMAs may cross frequently, leading to overtrading and commission erosion. Solution: Add trend duration filtering conditions or adjust to longer-period EMA parameters.
|
|||
|
|
|
|||
|
|
5. **Capital Management Risk**: Though the strategy has built-in capital management mechanisms, it doesn't consider the scenario of correlated assets losing simultaneously. Solution: Implement portfolio risk management to control the overall risk exposure of correlated assets.
|
|||
|
|
|
|||
|
|
#### Strategy Optimization Directions
|
|||
|
|
Based on code analysis, the strategy has several viable optimization directions:
|
|||
|
|
|
|||
|
|
1. **Add Trend Strength Filtering**: Introduce the ADX indicator to evaluate trend strength, executing trades only when trends are clear (e.g., ADX>25), which can significantly reduce false signals and unnecessary trades in choppy markets.
|
|||
|
|
|
|||
|
|
2. **Optimize Entry Timing**: Consider adding candlestick pattern or support/resistance level confirmation, such as waiting for price pullbacks to moving averages before entering, rather than entering directly at crossover points, to obtain better entry prices.
|
|||
|
|
|
|||
|
|
3. **Adaptive Parameter Settings**: Automatically adjust EMA periods and RSI thresholds based on market conditions (high volatility vs. low volatility), allowing the strategy to better adapt to different market environments.
|
|||
|
|
|
|||
|
|
4. **Add Time Filtering**: Incorporate trading session filtering conditions to avoid times when market liquidity is insufficient or volatility is abnormal, improving trade quality.
|
|||
|
|
|
|||
|
|
5. **Optimize Capital Management**: Implement progressive position management, moderately increasing position size after consecutive wins and reducing risk exposure after consecutive losses, to optimize the equity curve.
|
|||
|
|
|
|||
|
|
6. **Partial Profit Locking Mechanism**: Introduce multi-tiered take-profit strategies, such as moving stop-loss to breakeven or partially closing positions when profit reaches certain levels, both securing profits and not missing out on major market moves.
|
|||
|
|
|
|||
|
|
#### Conclusion
|
|||
|
|
The Dynamic Volatility-Adaptive EMA-RSI Crossover Strategy is a structurally complete and logically clear quantitative trading system that identifies trends through technical indicator combinations and forms an effective trading decision framework integrated with dynamic capital management and risk control mechanisms. The strategy's strengths lie in adapting stop-loss and take-profit positions and position sizes to market volatility, while improving signal quality through RSI filtering and trend reversal position closing. Although risks such as false breakouts and parameter sensitivity exist, these issues can be effectively mitigated through the suggested optimization directions, such as adding trend strength filtering, optimizing entry timing, and introducing adaptive parameters. Overall, this strategy provides a solid quantitative trading foundation suitable for further refinement and optimization to adapt to different market environments and individual risk preferences.[/trans]
|
|||
|
|
|
|||
|
|
|
|||
|
|
|
|||
|
|
> Source (PineScript)
|
|||
|
|
|
|||
|
|
``` pinescript
|
|||
|
|
/*backtest
|
|||
|
|
start: 2024-04-07 00:00:00
|
|||
|
|
end: 2025-04-06 00:00:00
|
|||
|
|
period: 2d
|
|||
|
|
basePeriod: 2d
|
|||
|
|
exchanges: [{"eid":"Futures_Binance","currency":"ETH_USDT"}]
|
|||
|
|
*/
|
|||
|
|
|
|||
|
|
//@version=5
|
|||
|
|
strategy("Kad_Sniper", overlay=true)
|
|||
|
|
// Entrée Sniper avec Fermeture Tendance + Taille de Lot + SL et TP
|
|||
|
|
|
|||
|
|
// === Périodes des Moyennes Mobiles et RSI ===
|
|||
|
|
shortEMALen = input.int(20, title="Période EMA 20")
|
|||
|
|
longEMALen = input.int(50, title="Période EMA 50")
|
|||
|
|
rsiLen = input.int(14, title="Période RSI")
|
|||
|
|
rsiOverbought = input.int(70, title="RSI Suracheté")
|
|||
|
|
rsiOversold = input.int(30, title="RSI Survendu")
|
|||
|
|
|
|||
|
|
// === Calcul des Moyennes Mobiles ===
|
|||
|
|
ema20 = ta.ema(close, shortEMALen)
|
|||
|
|
ema50 = ta.ema(close, longEMALen)
|
|||
|
|
|
|||
|
|
// === Calcul du RSI ===
|
|||
|
|
rsi = ta.rsi(close, rsiLen)
|
|||
|
|
|
|||
|
|
// === Paramètres de Gestion de Risque ===
|
|||
|
|
capital = input.float(1000, title="Capital Total ($)", minval=1) // Capital total alloué
|
|||
|
|
risqueParTrade = input.float(1, title="Risque par Trade (%)", minval=0.1, maxval=100) // Risque par trade en %
|
|||
|
|
stopLossMultiplier = input.float(1, title="Multiplier Stop Loss (en ATR)", minval=0.1, maxval=10) // Multiplier du stop-loss basé sur l'ATR
|
|||
|
|
takeProfitMultiplier = input.float(2, title="Multiplier Take Profit (en ATR)", minval=0.1, maxval=10) // Multiplier du take-profit basé sur l'ATR
|
|||
|
|
|
|||
|
|
// === Calcul du Stop-Loss et Take Profit en Pips (en utilisant ATR pour déterminer la volatilité) ===
|
|||
|
|
atr = ta.atr(14)
|
|||
|
|
stopLossDistance = atr * stopLossMultiplier // Distance du stop-loss en pips, ajustée par ATR
|
|||
|
|
takeProfitDistance = atr * takeProfitMultiplier // Distance du take-profit en pips, ajustée par ATR
|
|||
|
|
|
|||
|
|
// === Calcul de la Taille de Lot ===
|
|||
|
|
montantRisque = capital * (risqueParTrade / 100) // Risque par trade en $ (capital * pourcentage de risque)
|
|||
|
|
tailleLot = montantRisque / stopLossDistance // Taille du lot en fonction du risque et de la distance du stop-loss
|
|||
|
|
|
|||
|
|
// === Signaux de Croisement EMA et RSI ===
|
|||
|
|
buySignal = ta.crossover(ema20, ema50) and rsi < rsiOverbought and close > ema50
|
|||
|
|
sellSignal = ta.crossunder(ema20, ema50) and rsi > rsiOversold and close < ema50
|
|||
|
|
|
|||
|
|
// === Filtrage des Signaux ===
|
|||
|
|
confirmedBuySignal = buySignal and rsi < rsiOverbought
|
|||
|
|
confirmedSellSignal = sellSignal and rsi > rsiOversold
|
|||
|
|
|
|||
|
|
// === Fermeture des Positions lors du Changement de Tendance ===
|
|||
|
|
// Fermer la position Buy si le signal Sell est détecté
|
|||
|
|
if (confirmedSellSignal)
|
|||
|
|
strategy.close("Buy", comment="Close Buy")
|
|||
|
|
|
|||
|
|
// Fermer la position Sell si le signal Buy est détecté
|
|||
|
|
if (confirmedBuySignal)
|
|||
|
|
strategy.close("Sell", comment="Close Sell")
|
|||
|
|
|
|||
|
|
// === Entrée dans les Positions avec SL et TP ===
|
|||
|
|
// Entrée Buy lorsque les conditions sont validées
|
|||
|
|
if (confirmedBuySignal)
|
|||
|
|
strategy.entry("Buy", strategy.long, qty=tailleLot, comment="Buy")
|
|||
|
|
strategy.exit("Exit", "Buy", stop=close - stopLossDistance, limit=close + takeProfitDistance)
|
|||
|
|
|
|||
|
|
// Entrée Sell lorsque les conditions sont validées
|
|||
|
|
if (confirmedSellSignal)
|
|||
|
|
strategy.entry("Sell", strategy.short, qty=tailleLot, comment="Sell")
|
|||
|
|
strategy.exit("Exit", "Sell", stop=close + stopLossDistance, limit=close - takeProfitDistance )
|
|||
|
|
|
|||
|
|
// === Affichage des Signaux sous forme de points ultra petits ===
|
|||
|
|
// Afficher un petit point vert (Buy) directement sous la bougie lorsque toutes les conditions sont validées
|
|||
|
|
plotshape(series=confirmedBuySignal, location=location.belowbar, color=color.green, style=shape.circle, title="Signal Buy", size=size.tiny)
|
|||
|
|
|
|||
|
|
// Afficher un petit point rouge (Sell) directement au-dessus de la bougie lorsque toutes les conditions sont validées
|
|||
|
|
plotshape(series=confirmedSellSignal, location=location.abovebar, color=color.red, style=shape.circle, title="Signal Sell", size=size.tiny)
|
|||
|
|
|
|||
|
|
// === Affichage de la Taille de Lot ===
|
|||
|
|
if (confirmedBuySignal or confirmedSellSignal)
|
|||
|
|
label.new(bar_index, close, "Taille Lot: " + str.tostring(tailleLot, "#.##"), color=color.blue, style=label.style_label_down, textcolor=color.white, size=size.small)
|
|||
|
|
|
|||
|
|
// === Affichage des Moyennes Mobiles ===
|
|||
|
|
plot(ema20, color=color.blue, title="EMA 20")
|
|||
|
|
plot(ema50, color=color.orange, title="EMA 50")
|
|||
|
|
|
|||
|
|
// === Affichage RSI pour la confirmation ===
|
|||
|
|
hline(50, "RSI 50", color=color.gray)
|
|||
|
|
plot(rsi, color=color.rgb(153, 124, 158), title="RSI", linewidth=2)
|
|||
|
|
|
|||
|
|
```
|
|||
|
|
|
|||
|
|
> Detail
|
|||
|
|
|
|||
|
|
https://www.fmz.com/strategy/489650
|
|||
|
|
|
|||
|
|
> Last Modified
|
|||
|
|
|
|||
|
|
2025-04-07 13:25:33
|