310 lines
21 KiB
Markdown
310 lines
21 KiB
Markdown

|
|
|||
|
|
> Name
|
|||
|
|
|
|||
|
|
动态波动性交易法多时间维度嵌套技术指标结合极端行情监控的期货量化策略-Dynamic-Volatility-Trading-System-Multi-Timeframe-Nested-Technical-Indicator-Strategy-with-Extreme-Market-Condition-Monitoring-for-Futures
|
|||
|
|
|
|||
|
|
> Author
|
|||
|
|
|
|||
|
|
ianzeng123
|
|||
|
|
|
|||
|
|
> Strategy Description
|
|||
|
|
|
|||
|
|
|
|||
|
|
|
|||
|
|
|
|||
|
|
|
|||
|
|
[trans]#### 概述
|
|||
|
|
|
|||
|
|
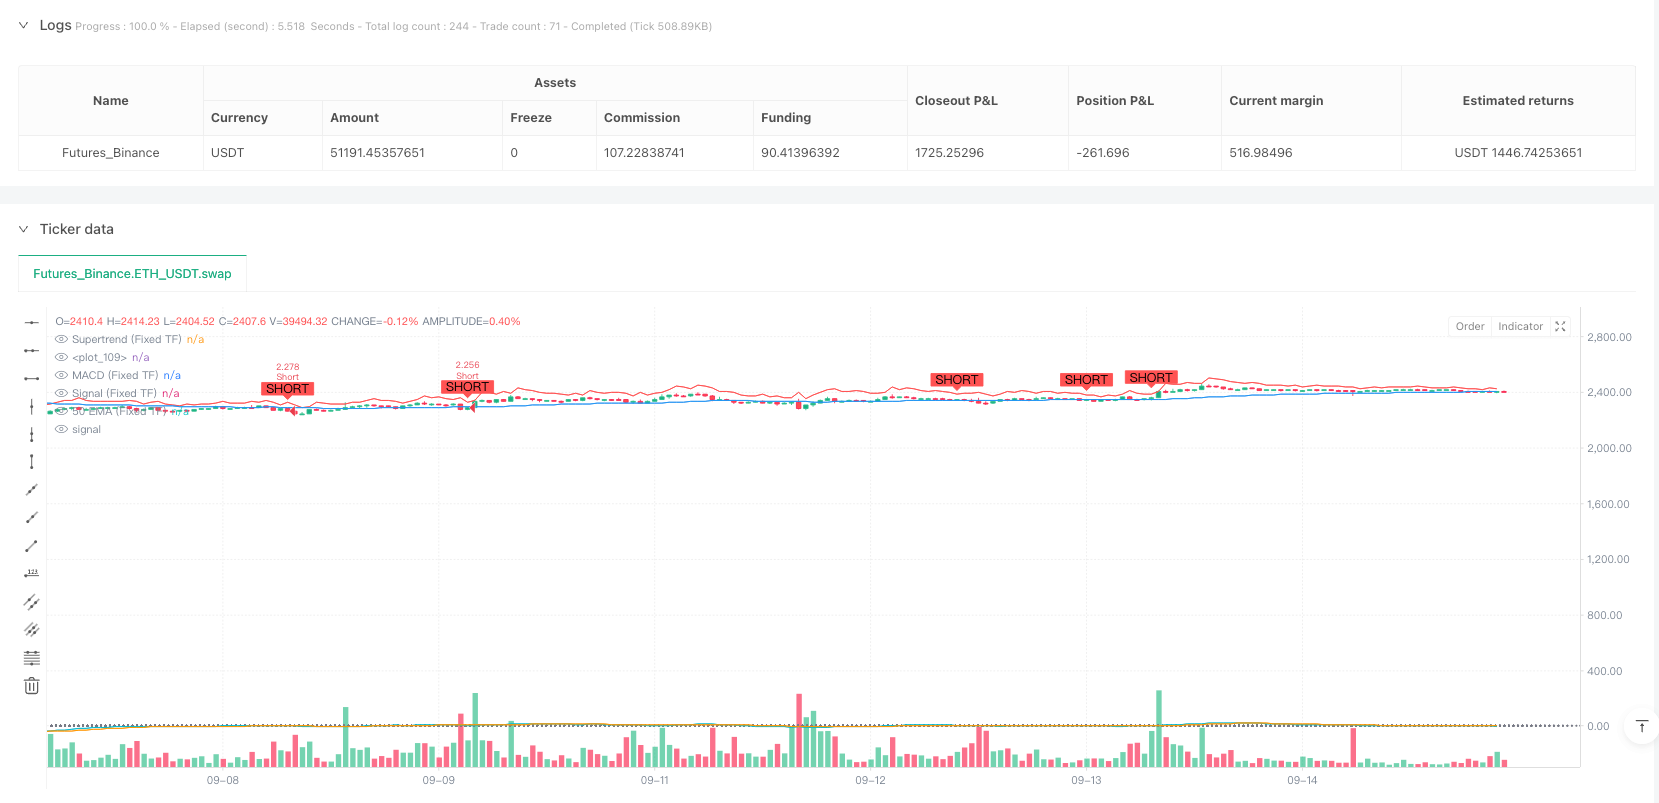
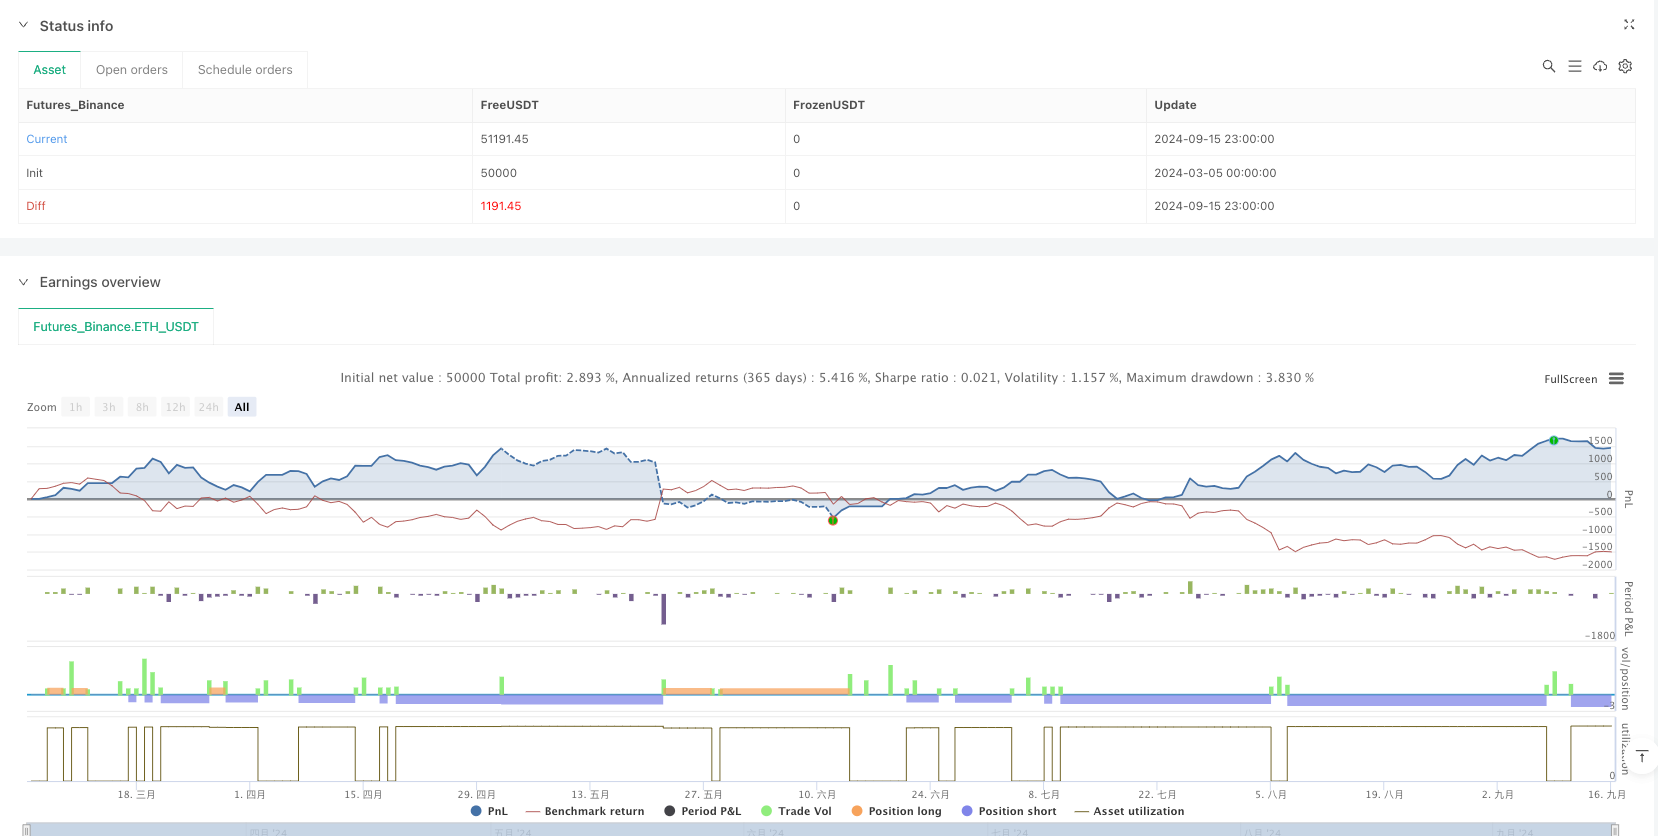
动态波动性交易法是一个专为高波动性市场设计的期货交易量化策略,特别适用于加密货币等波动剧烈的品种。该策略巧妙结合了多个技术指标,在固定时间框架内生成一致的交易信号,同时具备动态风险管理系统。策略的核心在于通过固定时间框架(默认15分钟)计算所有关键指标数值,包括EMA、MACD、RSI、ATR和自定义Supertrend,确保在任何图表分辨率下信号生成的一致性,同时配备了极端行情监控机制,在市场出现剧烈波动时自动平仓以降低风险。
|
|||
|
|
|
|||
|
|
#### 策略原理
|
|||
|
|
|
|||
|
|
动态波动性交易法基于多重技术指标的协同效应,通过TradingView的request.security()函数在固定时间框架上计算关键指标。其核心逻辑如下:
|
|||
|
|
|
|||
|
|
1. **固定时间框架计算**:所有指标在选定的固定时间框架(默认15分钟)上计算,确保交易信号不受查看图表分辨率的影响。
|
|||
|
|
|
|||
|
|
2. **多指标系统**:
|
|||
|
|
- 50周期EMA作为趋势过滤器
|
|||
|
|
- MACD交叉作为动量指标
|
|||
|
|
- RSI监控超买超卖条件
|
|||
|
|
- ATR用于动态设置止盈水平和追踪止损
|
|||
|
|
- 自定义Supertrend作为额外趋势确认
|
|||
|
|
|
|||
|
|
3. **入场条件**:
|
|||
|
|
- 做多:收盘价在EMA之上,MACD金叉,Supertrend向上,RSI未达超买
|
|||
|
|
- 做空:收盘价在EMA之下,MACD死叉,Supertrend向下,RSI未达超卖
|
|||
|
|
|
|||
|
|
4. **出场机制**:
|
|||
|
|
- 基于ATR的止盈水平
|
|||
|
|
- 基于ATR的追踪止损,保护利润同时允许盈利交易充分发展
|
|||
|
|
- 极端行情监控:当价格波动超过用户定义的阈值(默认2%)时强制平仓
|
|||
|
|
|
|||
|
|
5. **风险管理**:策略限制同时只持有一个方向的仓位,确保资金管理的一致性和简洁性。
|
|||
|
|
|
|||
|
|
#### 策略优势
|
|||
|
|
|
|||
|
|
动态波动性交易法具有以下显著优势:
|
|||
|
|
|
|||
|
|
1. **一致性信号生成**:通过在固定时间框架上计算所有指标,确保交易信号的稳定性和一致性,避免了不同时间框架切换带来的混乱。
|
|||
|
|
|
|||
|
|
2. **多重确认机制**:结合多个技术指标(EMA、MACD、RSI、Supertrend)形成入场信号,大幅降低了假信号的风险,提高信号质量。
|
|||
|
|
|
|||
|
|
3. **动态风险管理**:基于ATR的止盈和追踪止损根据市场波动性自动调整,在保护资金的同时允许利润充分增长。这种动态方法特别适合波动性较大的市场。
|
|||
|
|
|
|||
|
|
4. **极端行情保护**:通过监控显著的价格变动(泵升或暴跌),在极端市场条件下自动平仓,有效减轻潜在损失,这是传统策略常常忽略的重要安全机制。
|
|||
|
|
|
|||
|
|
5. **适应性强**:策略可以跨多个时间框架使用(1分钟、5分钟、15分钟等),同时保持信号生成的一致性,赋予交易者更大的灵活性。
|
|||
|
|
|
|||
|
|
#### 策略风险
|
|||
|
|
|
|||
|
|
尽管动态波动性交易法具有多重优势,但仍存在以下潜在风险:
|
|||
|
|
|
|||
|
|
1. **过度交易风险**:多指标系统可能在某些市场条件下生成过多信号,导致频繁交易增加交易成本。解决方法:可以考虑增加额外过滤条件或延长信号确认时间。
|
|||
|
|
|
|||
|
|
2. **市场噪音敏感性**:特别是在较低时间框架上,策略可能对市场噪音敏感,进而触发不必要的交易。解决方法:可以调整指标参数以减少噪音影响,如增加EMA长度或调整RSI界限。
|
|||
|
|
|
|||
|
|
3. **参数优化依赖**:策略性能高度依赖于多个参数(EMA长度、MACD参数、ATR乘数等)的优化,不同市场条件可能需要不同参数设置。解决方法:定期回测和调整参数,或考虑实施自适应参数系统。
|
|||
|
|
|
|||
|
|
4. **极端波动反应延迟**:尽管有极端行情监控,但在瞬间极端波动情况下,策略反应可能仍有延迟,导致不理想的平仓价格。解决方法:考虑增加基于价格变化速率的更敏感触发机制。
|
|||
|
|
|
|||
|
|
5. **单一时间框架局限性**:虽然策略在固定时间框架上计算指标以保持一致性,但这也可能导致忽略更高或更低时间框架提供的重要市场信息。解决方法:考虑增加多时间框架分析组件。
|
|||
|
|
|
|||
|
|
#### 策略优化方向
|
|||
|
|
|
|||
|
|
基于对策略的深入分析,以下是几个可能的优化方向:
|
|||
|
|
|
|||
|
|
1. **多时间框架协同系统**:除了当前的固定时间框架,增加更高时间框架(如60分钟或4小时)的趋势过滤器,确保交易方向与更大趋势一致。这样做的原因是更高时间框架通常展示更稳定的市场趋势,减少逆势交易的可能性。
|
|||
|
|
|
|||
|
|
2. **动态参数调整**:实现基于市场波动性或其他市场指标自动调整策略参数的机制。这种优化可以使策略更好地适应变化的市场条件,无需人工干预。
|
|||
|
|
|
|||
|
|
3. **高级止损管理**:在当前ATR基础上,引入多级追踪止损或基于支撑/阻力的智能止损系统。这样可以更精细地管理风险,在保护利润的同时允许交易充分发展。
|
|||
|
|
|
|||
|
|
4. **情绪分析整合**:考虑增加市场情绪指标(如交易量分析、价格波动模式识别),为入场和出场决策提供额外维度。市场情绪往往是价格走势的先导指标,可以提高信号生成的及时性。
|
|||
|
|
|
|||
|
|
5. **机器学习优化**:运用机器学习算法优化参数选择和信号筛选,通过大量历史数据训练模型以提高策略性能。机器学习可以识别传统技术分析难以捕捉的复杂市场模式。
|
|||
|
|
|
|||
|
|
6. **资金管理增强**:引入更复杂的风险管理系统,如基于回撤控制的动态仓位大小调整或基于胜率的凯利准则优化。科学的资金管理对策略的长期盈利能力至关重要。
|
|||
|
|
|
|||
|
|
#### 总结
|
|||
|
|
|
|||
|
|
动态波动性交易法是一个综合利用技术分析和动态风险管理的高级期货交易策略,特别适合波动性较大的市场。通过在固定时间框架上计算多个技术指标(EMA、MACD、RSI、Supertrend),该策略能够生成一致且稳健的交易信号。其动态止盈止损系统和极端行情监控机制为资金安全提供了多层保障。
|
|||
|
|
|
|||
|
|
虽然策略存在参数依赖性和市场噪音敏感性等潜在风险,但通过建议的优化方向,如多时间框架分析、动态参数调整和高级止损管理,这些风险可以得到有效缓解。进一步整合机器学习和市场情绪分析,更可以增强策略的适应性和盈利能力。
|
|||
|
|
|
|||
|
|
对于寻求系统化交易方法的交易者,特别是那些专注于波动性市场的交易者,动态波动性交易法提供了一个平衡技术指标和风险管理的综合解决方案,有潜力在不同市场条件下保持稳定表现。 || #### Overview
|
|||
|
|
|
|||
|
|
The Dynamic Volatility Trading System is a quantitative futures trading strategy specifically designed for high-volatility markets, particularly suited for cryptocurrency and other volatile instruments. This strategy cleverly combines multiple technical indicators to generate consistent trading signals within a fixed timeframe while featuring a dynamic risk management system. The core of the strategy lies in calculating all key indicators (including EMA, MACD, RSI, ATR, and custom Supertrend) on a fixed timeframe (default 15 minutes), ensuring consistency in signal generation across any chart resolution, while also equipped with an extreme market condition monitoring mechanism that automatically closes positions during violent market fluctuations to reduce risk.
|
|||
|
|
|
|||
|
|
#### Strategy Principles
|
|||
|
|
|
|||
|
|
The Dynamic Volatility Trading System is based on the synergistic effect of multiple technical indicators, calculating key metrics on a fixed timeframe using TradingView's request.security() function. Its core logic is as follows:
|
|||
|
|
|
|||
|
|
1. **Fixed Timeframe Calculations**: All indicators are computed on a selected fixed timeframe (default 15 minutes), ensuring trading signals remain consistent regardless of the chart resolution being viewed.
|
|||
|
|
|
|||
|
|
2. **Multi-Indicator System**:
|
|||
|
|
- 50-period EMA as a trend filter
|
|||
|
|
- MACD crossovers for momentum indication
|
|||
|
|
- RSI to monitor overbought/oversold conditions
|
|||
|
|
- ATR for dynamic take-profit levels and trailing stops
|
|||
|
|
- Custom Supertrend for additional trend confirmation
|
|||
|
|
|
|||
|
|
3. **Entry Conditions**:
|
|||
|
|
- Long: Close above EMA, MACD golden cross, Supertrend up, RSI not overbought
|
|||
|
|
- Short: Close below EMA, MACD death cross, Supertrend down, RSI not oversold
|
|||
|
|
|
|||
|
|
4. **Exit Mechanisms**:
|
|||
|
|
- ATR-based take-profit levels
|
|||
|
|
- ATR-based trailing stop to protect profits while allowing winning trades to develop fully
|
|||
|
|
- Extreme market monitoring: forces position closure when price movement exceeds user-defined threshold (default 2%)
|
|||
|
|
|
|||
|
|
5. **Risk Management**: The strategy limits positions to one direction at a time, ensuring consistency and simplicity in capital management.
|
|||
|
|
|
|||
|
|
#### Strategy Advantages
|
|||
|
|
|
|||
|
|
The Dynamic Volatility Trading System offers the following significant advantages:
|
|||
|
|
|
|||
|
|
1. **Consistent Signal Generation**: By calculating all indicators on a fixed timeframe, the strategy ensures stability and consistency in trading signals, avoiding confusion caused by switching between different timeframes.
|
|||
|
|
|
|||
|
|
2. **Multiple Confirmation Mechanism**: The combination of multiple technical indicators (EMA, MACD, RSI, Supertrend) for entry signals significantly reduces the risk of false signals and improves signal quality.
|
|||
|
|
|
|||
|
|
3. **Dynamic Risk Management**: ATR-based take-profit and trailing stop levels automatically adjust according to market volatility, allowing profits to grow while protecting capital. This dynamic approach is particularly suitable for highly volatile markets.
|
|||
|
|
|
|||
|
|
4. **Extreme Market Protection**: By monitoring significant price movements (pumps or dumps), the strategy automatically closes positions under extreme market conditions, effectively mitigating potential losses—an important safety mechanism often overlooked by traditional strategies.
|
|||
|
|
|
|||
|
|
5. **High Adaptability**: The strategy can be used across multiple timeframes (1-minute, 5-minute, 15-minute, etc.) while maintaining consistency in signal generation, providing traders with greater flexibility.
|
|||
|
|
|
|||
|
|
#### Strategy Risks
|
|||
|
|
|
|||
|
|
Despite its multiple advantages, the Dynamic Volatility Trading System has the following potential risks:
|
|||
|
|
|
|||
|
|
1. **Overtrading Risk**: The multi-indicator system may generate excessive signals under certain market conditions, leading to frequent trading and increased transaction costs. Solution: Consider adding additional filtering conditions or extending signal confirmation time.
|
|||
|
|
|
|||
|
|
2. **Market Noise Sensitivity**: Especially on lower timeframes, the strategy may be sensitive to market noise, triggering unnecessary trades. Solution: Adjust indicator parameters to reduce noise impact, such as increasing EMA length or adjusting RSI boundaries.
|
|||
|
|
|
|||
|
|
3. **Parameter Optimization Dependency**: Strategy performance is highly dependent on the optimization of multiple parameters (EMA length, MACD parameters, ATR multiplier, etc.), and different market conditions may require different parameter settings. Solution: Regularly backtest and adjust parameters, or consider implementing an adaptive parameter system.
|
|||
|
|
|
|||
|
|
4. **Delayed Reaction to Extreme Volatility**: Despite having extreme market monitoring, the strategy's reaction may still be delayed in cases of instantaneous extreme volatility, resulting in less-than-ideal exit prices. Solution: Consider adding more sensitive trigger mechanisms based on the rate of price change.
|
|||
|
|
|
|||
|
|
5. **Single Timeframe Limitation**: While the strategy calculates indicators on a fixed timeframe for consistency, this may also lead to overlooking important market information provided by higher or lower timeframes. Solution: Consider adding multi-timeframe analysis components.
|
|||
|
|
|
|||
|
|
#### Strategy Optimization Directions
|
|||
|
|
|
|||
|
|
Based on an in-depth analysis of the strategy, here are several possible optimization directions:
|
|||
|
|
|
|||
|
|
1. **Multi-Timeframe Coordination System**: In addition to the current fixed timeframe, add a higher timeframe trend filter (such as 60-minute or 4-hour) to ensure trading direction aligns with the larger trend. This is beneficial because higher timeframes typically display more stable market trends, reducing the likelihood of counter-trend trading.
|
|||
|
|
|
|||
|
|
2. **Dynamic Parameter Adjustment**: Implement a mechanism that automatically adjusts strategy parameters based on market volatility or other market indicators. This optimization allows the strategy to better adapt to changing market conditions without manual intervention.
|
|||
|
|
|
|||
|
|
3. **Advanced Stop-Loss Management**: Building on the current ATR foundation, introduce multi-level trailing stops or intelligent stop-loss systems based on support/resistance. This allows for more refined risk management, protecting profits while allowing trades to develop fully.
|
|||
|
|
|
|||
|
|
4. **Sentiment Analysis Integration**: Consider adding market sentiment indicators (such as volume analysis, price volatility pattern recognition) to provide an additional dimension for entry and exit decisions. Market sentiment is often a leading indicator of price movements and can improve the timeliness of signal generation.
|
|||
|
|
|
|||
|
|
5. **Machine Learning Optimization**: Utilize machine learning algorithms to optimize parameter selection and signal filtering, training models through large amounts of historical data to improve strategy performance. Machine learning can identify complex market patterns that traditional technical analysis might struggle to capture.
|
|||
|
|
|
|||
|
|
6. **Enhanced Capital Management**: Introduce more sophisticated risk management systems, such as dynamic position sizing based on drawdown control or Kelly criterion optimization based on win rate. Scientific capital management is crucial for the long-term profitability of the strategy.
|
|||
|
|
|
|||
|
|
#### Summary
|
|||
|
|
|
|||
|
|
The Dynamic Volatility Trading System is an advanced futures trading strategy that comprehensively utilizes technical analysis and dynamic risk management, particularly suitable for highly volatile markets. By calculating multiple technical indicators (EMA, MACD, RSI, Supertrend) on a fixed timeframe, the strategy can generate consistent and robust trading signals. Its dynamic take-profit and stop-loss system, along with extreme market monitoring mechanisms, provides multi-layered protection for capital safety.
|
|||
|
|
|
|||
|
|
While the strategy has potential risks such as parameter dependency and market noise sensitivity, these risks can be effectively mitigated through the suggested optimization directions, including multi-timeframe analysis, dynamic parameter adjustment, and advanced stop-loss management. Further integration of machine learning and market sentiment analysis can enhance the strategy's adaptability and profitability.
|
|||
|
|
|
|||
|
|
For traders seeking a systematic trading approach, especially those focusing on volatile markets, the Dynamic Volatility Trading System offers a comprehensive solution that balances technical indicators and risk management, with the potential to maintain stable performance under various market conditions.[/trans]
|
|||
|
|
|
|||
|
|
|
|||
|
|
|
|||
|
|
> Source (PineScript)
|
|||
|
|
|
|||
|
|
``` pinescript
|
|||
|
|
/*backtest
|
|||
|
|
start: 2024-03-05 00:00:00
|
|||
|
|
end: 2024-09-16 00:00:00
|
|||
|
|
period: 1h
|
|||
|
|
basePeriod: 1h
|
|||
|
|
exchanges: [{"eid":"Futures_Binance","currency":"ETH_USDT"}]
|
|||
|
|
*/
|
|||
|
|
|
|||
|
|
//@version=6
|
|||
|
|
strategy("Futures Trading Expert Strategy with Extreme Move Check (Fixed TF)",
|
|||
|
|
overlay=true,
|
|||
|
|
initial_capital=10000,
|
|||
|
|
default_qty_type=strategy.percent_of_equity,
|
|||
|
|
default_qty_value=10,
|
|||
|
|
calc_on_every_tick=true)
|
|||
|
|
|
|||
|
|
// ========== INPUTS ==========
|
|||
|
|
fixedTF = input.timeframe("15", title="Fixed Timeframe for Signals")
|
|||
|
|
|
|||
|
|
emaLength = input.int(50, title="EMA Length", minval=1)
|
|||
|
|
atrLength = input.int(14, title="ATR Length", minval=1)
|
|||
|
|
atrMultiplier = input.float(3.0, title="ATR Multiplier for TP", step=0.1)
|
|||
|
|
macdFast = input.int(12, title="MACD Fast Length")
|
|||
|
|
macdSlow = input.int(26, title="MACD Slow Length")
|
|||
|
|
macdSignal = input.int(9, title="MACD Signal Smoothing")
|
|||
|
|
stATRPeriod = input.int(10, title="Supertrend ATR Period", minval=1)
|
|||
|
|
stFactor = input.float(3.0, title="Supertrend Factor", step=0.1)
|
|||
|
|
rsiLength = input.int(14, title="RSI Length")
|
|||
|
|
rsiOverbought = input.int(70, title="RSI Overbought Level")
|
|||
|
|
rsiOversold = input.int(30, title="RSI Oversold Level")
|
|||
|
|
trailStopMultiplier = input.float(2.0, title="Trailing Stop ATR Multiplier", step=0.1)
|
|||
|
|
extremePct = input.float(2.0, title="Extreme % Threshold", step=0.1) // e.g., 2%
|
|||
|
|
|
|||
|
|
// ========== FIXED TIMEFRAME INDICATOR VALUES ==========
|
|||
|
|
// Fetch fixed timeframe OHLC values
|
|||
|
|
ft_close = request.security(syminfo.tickerid, fixedTF, close)
|
|||
|
|
ft_high = request.security(syminfo.tickerid, fixedTF, high)
|
|||
|
|
ft_low = request.security(syminfo.tickerid, fixedTF, low)
|
|||
|
|
|
|||
|
|
// EMA calculated on fixed timeframe
|
|||
|
|
emaValue = request.security(syminfo.tickerid, fixedTF, ta.ema(close, emaLength))
|
|||
|
|
|
|||
|
|
// MACD calculated on fixed timeframe
|
|||
|
|
[macdLine, signalLine, _] = request.security(syminfo.tickerid, fixedTF, ta.macd(close, macdFast, macdSlow, macdSignal))
|
|||
|
|
|
|||
|
|
// RSI calculated on fixed timeframe
|
|||
|
|
rsiValue = request.security(syminfo.tickerid, fixedTF, ta.rsi(close, rsiLength))
|
|||
|
|
|
|||
|
|
// ATR calculated on fixed timeframe
|
|||
|
|
atrValue = request.security(syminfo.tickerid, fixedTF, ta.atr(atrLength))
|
|||
|
|
|
|||
|
|
// Supertrend Calculation Function
|
|||
|
|
f_supertrend(_atrPeriod, _factor) =>
|
|||
|
|
_atr = ta.atr(_atrPeriod)
|
|||
|
|
_up = (high + low) / 2 - _factor * _atr
|
|||
|
|
_down = (high + low) / 2 + _factor * _atr
|
|||
|
|
var float _st = na
|
|||
|
|
_st := na(_st) ? ((high + low) / 2) : (close[1] > _st ? math.max(_up, _st) : math.min(_down, _st))
|
|||
|
|
_st
|
|||
|
|
|
|||
|
|
// Compute supertrend on fixed timeframe
|
|||
|
|
supertrend = request.security(syminfo.tickerid, fixedTF, f_supertrend(stATRPeriod, stFactor))
|
|||
|
|
trend = ft_close > supertrend ? 1 : -1
|
|||
|
|
|
|||
|
|
// ========== EXTREME MOVE CHECK (using fixed timeframe values) ==========
|
|||
|
|
prev_ft_close = request.security(syminfo.tickerid, fixedTF, close[1])
|
|||
|
|
btcMovePct = (ft_close - prev_ft_close) / prev_ft_close * 100
|
|||
|
|
pump = btcMovePct > extremePct // Pump: price increased more than extremePct%
|
|||
|
|
dump = btcMovePct < -extremePct // Dump: price dropped more than extremePct%
|
|||
|
|
|
|||
|
|
// ========== ENTRY CONDITIONS ==========
|
|||
|
|
// Pre-calculate MACD crossovers on fixed timeframe values
|
|||
|
|
macdLongCrossover = ta.crossover(macdLine, signalLine)
|
|||
|
|
macdShortCrossunder = ta.crossunder(macdLine, signalLine)
|
|||
|
|
|
|||
|
|
// Long entry: fixed close > EMA, MACD cross upward, supertrend is up, RSI is not overbought
|
|||
|
|
longCondition = (ft_close > emaValue) and macdLongCrossover and (trend == 1) and (rsiValue < rsiOverbought)
|
|||
|
|
|
|||
|
|
// Short entry: fixed close < EMA, MACD cross downward, supertrend is down, RSI is not oversold
|
|||
|
|
shortCondition = (ft_close < emaValue) and macdShortCrossunder and (trend == -1) and (rsiValue > rsiOversold)
|
|||
|
|
|
|||
|
|
// ========== TRADE EXECUTION ==========
|
|||
|
|
// Long Trades
|
|||
|
|
if (longCondition and strategy.position_size <= 0)
|
|||
|
|
if strategy.position_size < 0
|
|||
|
|
strategy.close("Short", comment="Close Short for Long")
|
|||
|
|
longTP = ft_close + atrMultiplier * atrValue
|
|||
|
|
strategy.entry("Long", strategy.long, comment="Long Entry")
|
|||
|
|
strategy.exit("Long Exit", from_entry="Long", limit=longTP,
|
|||
|
|
trail_price=na, trail_offset=atrValue * trailStopMultiplier,
|
|||
|
|
comment="Long TP & Trailing Stop")
|
|||
|
|
|
|||
|
|
// Short Trades
|
|||
|
|
if (shortCondition and strategy.position_size >= 0)
|
|||
|
|
if strategy.position_size > 0
|
|||
|
|
strategy.close("Long", comment="Close Long for Short")
|
|||
|
|
shortTP = ft_close - atrMultiplier * atrValue
|
|||
|
|
strategy.entry("Short", strategy.short, comment="Short Entry")
|
|||
|
|
strategy.exit("Short Exit", from_entry="Short", limit=shortTP,
|
|||
|
|
trail_price=na, trail_offset=atrValue * trailStopMultiplier,
|
|||
|
|
comment="Short TP & Trailing Stop")
|
|||
|
|
|
|||
|
|
// ========== EXTRA EXIT CONDITIONS BASED ON EXTREME MOVES ==========
|
|||
|
|
// If BTC is pumping really hard and you're short, exit the short.
|
|||
|
|
// If BTC is dumping really hard and you're long, exit the long.
|
|||
|
|
if pump and strategy.position_size < 0
|
|||
|
|
strategy.close("Short", comment="Close Short on BTC Pump")
|
|||
|
|
if dump and strategy.position_size > 0
|
|||
|
|
strategy.close("Long", comment="Close Long on BTC Dump")
|
|||
|
|
|
|||
|
|
// ========== PLOTTING ==========
|
|||
|
|
// Plot fixed timeframe values for visual reference
|
|||
|
|
plot(emaValue, color=color.blue, title="50 EMA (Fixed TF)")
|
|||
|
|
plot(supertrend, color=(trend == 1 ? color.green : color.red), title="Supertrend (Fixed TF)")
|
|||
|
|
plot(macdLine, title="MACD (Fixed TF)", color=color.aqua)
|
|||
|
|
plot(signalLine, title="Signal (Fixed TF)", color=color.orange)
|
|||
|
|
hline(0, color=color.gray, linestyle=hline.style_dotted)
|
|||
|
|
|
|||
|
|
// Plot entry signals
|
|||
|
|
plotshape(longCondition, title="Long Signal", location=location.belowbar, color=color.green, style=shape.labelup, text="LONG")
|
|||
|
|
plotshape(shortCondition, title="Short Signal", location=location.abovebar, color=color.red, style=shape.labeldown, text="SHORT")
|
|||
|
|
|
|||
|
|
```
|
|||
|
|
|
|||
|
|
> Detail
|
|||
|
|
|
|||
|
|
https://www.fmz.com/strategy/484918
|
|||
|
|
|
|||
|
|
> Last Modified
|
|||
|
|
|
|||
|
|
2025-03-05 10:06:05
|