149 lines
8.1 KiB
Markdown
149 lines
8.1 KiB
Markdown

|
|
||
|
|
> Name
|
||
|
|
|
||
|
|
人工智能优化的自适应止损交易系统与多重技术指标组合策略-AI-Optimized-Adaptive-Stop-Loss-Trading-System-with-Multiple-Technical-Indicator-Integration
|
||
|
|
|
||
|
|
> Author
|
||
|
|
|
||
|
|
ChaoZhang
|
||
|
|
|
||
|
|
> Strategy Description
|
||
|
|
|
||
|
|
|
||
|
|
|
||
|
|
[trans]
|
||
|
|
#### 概述
|
||
|
|
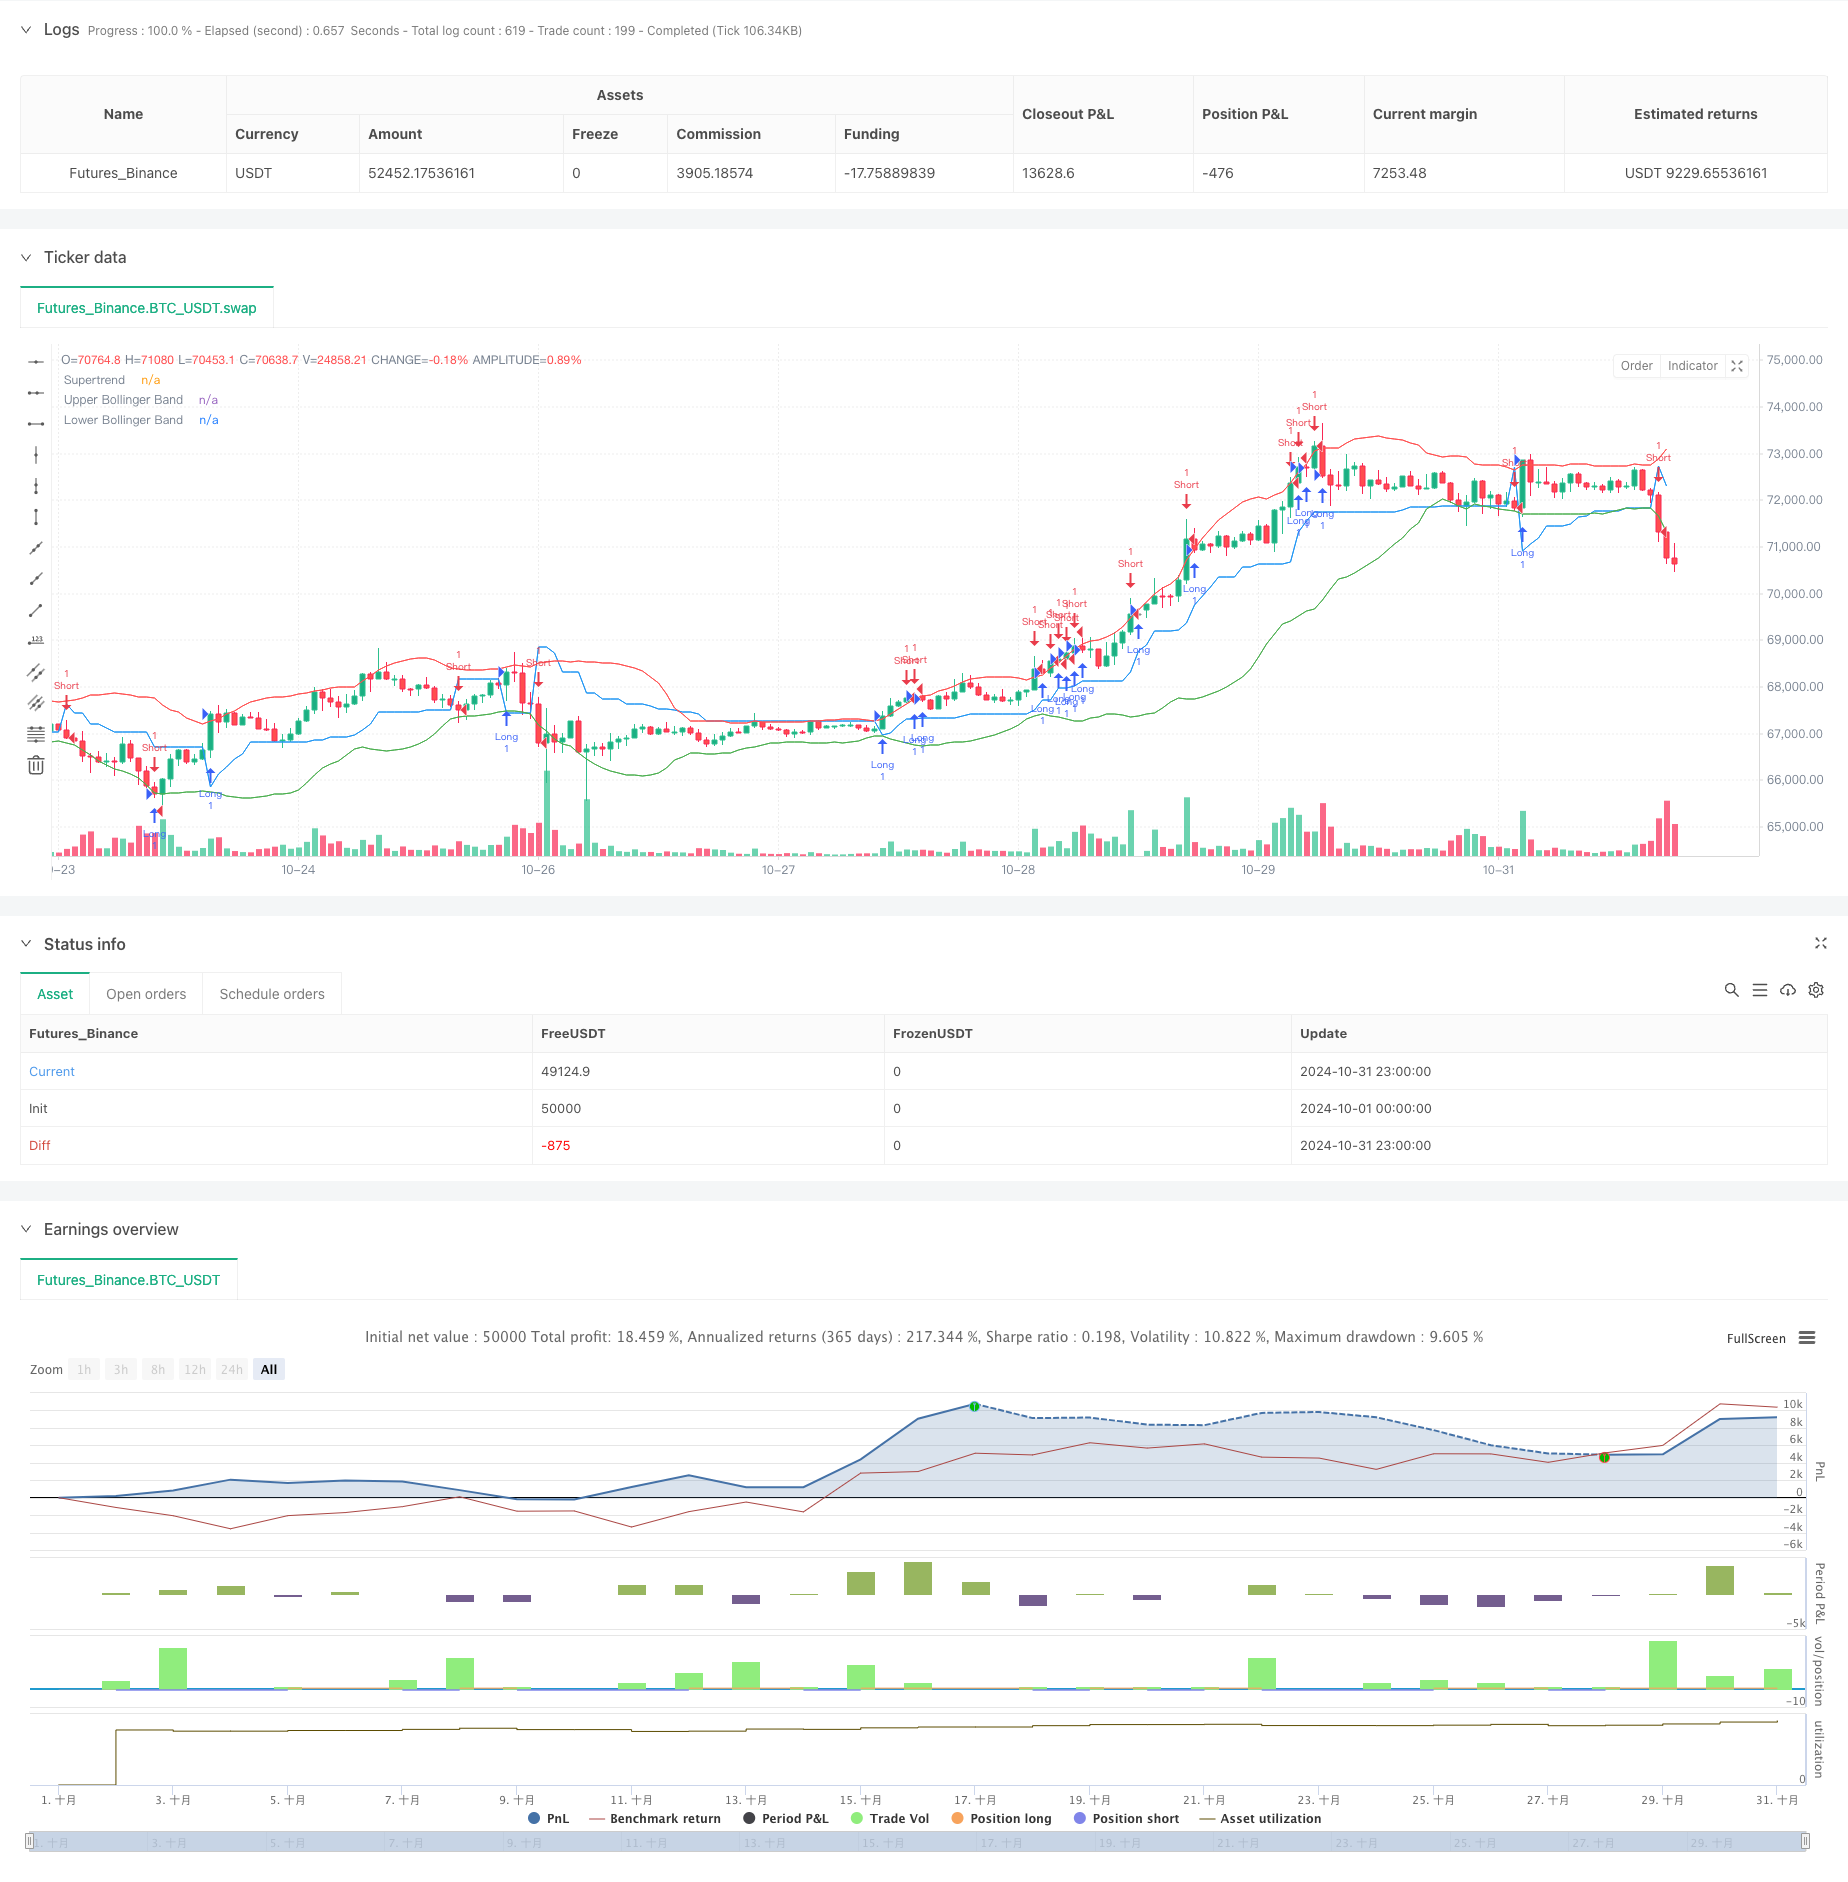
该策略是一个结合了人工智能优化和多重技术指标的自适应交易系统。它主要利用布林带、相对强弱指数(RSI)和超级趋势(Supertrend)指标来生成交易信号,并通过人工智能优化来调整交易参数。系统还包含了基于ATR的自适应止损机制,这使得策略能够根据市场波动性自动调整风险管理参数。
|
||
|
|
|
||
|
|
#### 策略原理
|
||
|
|
策略采用多层过滤机制来确定交易信号。首先,通过布林带来确定市场的波动范围,当价格突破布林带下轨且RSI处于超卖区域时,系统会考虑做多信号。反之,当价格突破布林带上轨且RSI处于超买区域时,系统会考虑做空信号。超级趋势指标作为趋势确认工具,只有当价格与超级趋势的位置关系符合交易方向时,系统才会执行交易。人工智能模块通过优化各项参数来提高策略的适应性。止损和获利目标都是基于ATR动态计算的,这确保了风险管理措施能够适应市场波动性的变化。
|
||
|
|
|
||
|
|
#### 策略优势
|
||
|
|
1. 多重技术指标的综合使用降低了假信号的影响
|
||
|
|
2. 人工智能优化模块提高了策略的适应性和稳定性
|
||
|
|
3. 基于ATR的动态止损机制能够有效控制风险
|
||
|
|
4. 策略参数可以根据实际需求灵活调整
|
||
|
|
5. 完整的风险管理体系,包括止损和止盈设置
|
||
|
|
6. 具有良好的可视化效果,便于监控和分析
|
||
|
|
|
||
|
|
#### 策略风险
|
||
|
|
1. 参数优化过度可能导致过拟合
|
||
|
|
2. 多重指标可能在剧烈波动时产生混乱信号
|
||
|
|
3. 人工智能模块需要足够的历史数据来训练
|
||
|
|
4. 高频交易可能产生较高的交易成本
|
||
|
|
5. 市场急剧变化时止损可能会滑点
|
||
|
|
6. 系统复杂度较高,需要定期维护和调整
|
||
|
|
|
||
|
|
#### 策略优化方向
|
||
|
|
1. 引入更多的市场情绪指标来提高信号的准确性
|
||
|
|
2. 优化人工智能模块的训练方法和参数选择
|
||
|
|
3. 增加交易量分析来支持决策
|
||
|
|
4. 加入更多的风险控制措施
|
||
|
|
5. 开发自适应的参数调整机制
|
||
|
|
6. 优化计算效率,减少资源消耗
|
||
|
|
|
||
|
|
#### 总结
|
||
|
|
这是一个将传统技术分析与现代人工智能技术相结合的综合性交易策略。通过多重技术指标的配合使用,策略能够有效识别市场机会,而人工智能优化模块则提供了较强的适应性。动态止损机制为策略提供了良好的风险控制能力。虽然策略还存在一些需要优化的地方,但整体设计思路合理,具有良好的实用价值和发展潜力。 ||
|
||
|
|
|
||
|
|
#### Overview
|
||
|
|
This strategy is an adaptive trading system that combines AI optimization with multiple technical indicators. It primarily uses Bollinger Bands, Relative Strength Index (RSI), and Supertrend indicators to generate trading signals, with AI optimization for parameter adjustment. The system includes an ATR-based adaptive stop-loss mechanism, allowing the strategy to automatically adjust risk management parameters based on market volatility.
|
||
|
|
|
||
|
|
#### Strategy Principles
|
||
|
|
The strategy employs a multi-layer filtering mechanism to determine trading signals. First, Bollinger Bands are used to identify market volatility ranges, generating long signals when price breaks below the lower band and RSI is in oversold territory. Conversely, short signals are considered when price breaks above the upper band and RSI is in overbought territory. The Supertrend indicator serves as a trend confirmation tool, executing trades only when the price-to-Supertrend relationship aligns with the trading direction. The AI module optimizes various parameters to enhance strategy adaptability. Both stop-loss and profit targets are dynamically calculated based on ATR, ensuring risk management measures adapt to changes in market volatility.
|
||
|
|
|
||
|
|
#### Strategy Advantages
|
||
|
|
1. Multiple technical indicators reduce the impact of false signals
|
||
|
|
2. AI optimization module enhances strategy adaptability and stability
|
||
|
|
3. ATR-based dynamic stop-loss mechanism effectively controls risk
|
||
|
|
4. Strategy parameters can be flexibly adjusted based on actual needs
|
||
|
|
5. Comprehensive risk management system including stop-loss and take-profit settings
|
||
|
|
6. Good visualization effects for monitoring and analysis
|
||
|
|
|
||
|
|
#### Strategy Risks
|
||
|
|
1. Over-optimization of parameters may lead to overfitting
|
||
|
|
2. Multiple indicators may generate conflicting signals during extreme volatility
|
||
|
|
3. AI module requires sufficient historical data for training
|
||
|
|
4. High-frequency trading may incur significant transaction costs
|
||
|
|
5. Stop-losses may experience slippage during rapid market changes
|
||
|
|
6. High system complexity requires regular maintenance and adjustment
|
||
|
|
|
||
|
|
#### Optimization Directions
|
||
|
|
1. Introduce more market sentiment indicators to improve signal accuracy
|
||
|
|
2. Optimize AI module training methods and parameter selection
|
||
|
|
3. Add volume analysis to support decision-making
|
||
|
|
4. Implement additional risk control measures
|
||
|
|
5. Develop adaptive parameter adjustment mechanisms
|
||
|
|
6. Optimize computational efficiency to reduce resource consumption
|
||
|
|
|
||
|
|
#### Summary
|
||
|
|
This is a comprehensive trading strategy that combines traditional technical analysis with modern artificial intelligence technology. Through the coordinated use of multiple technical indicators, the strategy can effectively identify market opportunities, while the AI optimization module provides strong adaptability. The dynamic stop-loss mechanism provides excellent risk control capabilities. Although there are still aspects that need optimization, the overall design approach is rational, offering good practical value and development potential.[/trans]
|
||
|
|
|
||
|
|
|
||
|
|
|
||
|
|
> Source (PineScript)
|
||
|
|
|
||
|
|
``` pinescript
|
||
|
|
/*backtest
|
||
|
|
start: 2024-10-01 00:00:00
|
||
|
|
end: 2024-10-31 23:59:59
|
||
|
|
period: 1h
|
||
|
|
basePeriod: 1h
|
||
|
|
exchanges: [{"eid":"Futures_Binance","currency":"BTC_USDT"}]
|
||
|
|
*/
|
||
|
|
|
||
|
|
//@version=5
|
||
|
|
strategy("AI-Optimized Crypto Trading with Trailing Stop", overlay=true, precision=4)
|
||
|
|
|
||
|
|
// Input settings for AI optimization
|
||
|
|
risk_per_trade = input.float(1.0, title="Risk per Trade (%)", minval=0.1, maxval=100) / 100
|
||
|
|
atr_period = input.int(14, title="ATR Period") // ATR период должен быть целым числом
|
||
|
|
atr_multiplier = input.float(2.0, title="ATR Multiplier for Stop Loss")
|
||
|
|
take_profit_multiplier = input.float(2.0, title="Take Profit Multiplier")
|
||
|
|
ai_optimization = input.bool(true, title="Enable AI Optimization")
|
||
|
|
|
||
|
|
// Indicators: Bollinger Bands, RSI, Supertrend
|
||
|
|
rsi_period = input.int(14, title="RSI Period")
|
||
|
|
upper_rsi = input.float(70, title="RSI Overbought Level")
|
||
|
|
lower_rsi = input.float(30, title="RSI Oversold Level")
|
||
|
|
bb_length = input.int(20, title="Bollinger Bands Length")
|
||
|
|
bb_mult = input.float(2.0, title="Bollinger Bands Multiplier")
|
||
|
|
supertrend_factor = input.int(3, title="Supertrend Factor") // Изменено на целое число
|
||
|
|
|
||
|
|
// Bollinger Bands
|
||
|
|
basis = ta.sma(close, bb_length)
|
||
|
|
dev = bb_mult * ta.stdev(close, bb_length)
|
||
|
|
upper_band = basis + dev
|
||
|
|
lower_band = basis - dev
|
||
|
|
|
||
|
|
// RSI
|
||
|
|
rsi = ta.rsi(close, rsi_period)
|
||
|
|
|
||
|
|
// Supertrend calculation
|
||
|
|
atr = ta.atr(atr_period)
|
||
|
|
[supertrend, _] = ta.supertrend(atr_multiplier, supertrend_factor)
|
||
|
|
|
||
|
|
// AI-based entry/exit signals (dynamic optimization)
|
||
|
|
long_signal = (rsi < lower_rsi and close < lower_band) or (supertrend[1] < close and ai_optimization)
|
||
|
|
short_signal = (rsi > upper_rsi and close > upper_band) or (supertrend[1] > close and ai_optimization)
|
||
|
|
|
||
|
|
// Trade execution with trailing stop-loss
|
||
|
|
if (long_signal)
|
||
|
|
strategy.entry("Long", strategy.long, stop=close - atr * atr_multiplier, limit=close + atr * take_profit_multiplier)
|
||
|
|
|
||
|
|
if (short_signal)
|
||
|
|
strategy.entry("Short", strategy.short, stop=close + atr * atr_multiplier, limit=close - atr * take_profit_multiplier)
|
||
|
|
|
||
|
|
// Plotting the MAs and Ichimoku Cloud for visualization
|
||
|
|
plot(upper_band, color=color.red, title="Upper Bollinger Band")
|
||
|
|
plot(lower_band, color=color.green, title="Lower Bollinger Band")
|
||
|
|
plot(supertrend, color=color.blue, title="Supertrend")
|
||
|
|
```
|
||
|
|
|
||
|
|
> Detail
|
||
|
|
|
||
|
|
https://www.fmz.com/strategy/473138
|
||
|
|
|
||
|
|
> Last Modified
|
||
|
|
|
||
|
|
2024-11-27 15:10:57
|