248 lines
18 KiB
Markdown
248 lines
18 KiB
Markdown

|
|
||
|
|
> Name
|
||
|
|
|
||
|
|
RSI与SuperTrend过滤策略组合系统趋势确认下的动量反转交易框架-RSI-and-SuperTrend-Filter-Combination-System-Momentum-Reversal-Trading-Framework-with-Trend-Confirmation
|
||
|
|
|
||
|
|
> Author
|
||
|
|
|
||
|
|
ianzeng123
|
||
|
|
|
||
|
|
> Strategy Description
|
||
|
|
|
||
|
|
|
||
|
|
|
||
|
|
|
||
|
|
|
||
|
|
|
||
|
|
|
||
|
|
[trans]
|
||
|
|
|
||
|
|
#### 概述
|
||
|
|
|
||
|
|
RSI与SuperTrend过滤策略组合系统是一个结合技术指标RSI(相对强弱指数)与SuperTrend趋势过滤器的量化交易策略。该策略的核心理念是"不要对抗趋势,同时不要忽视动量耗尽信号"。策略在45分钟时间框架上运行,主要寻找RSI超买超卖反转信号,但仅在价格走势与SuperTrend确认的趋势方向一致时才执行交易。这种组合方式有效过滤了单独使用RSI指标在较低时间框架上产生的大量噪音信号,提高了交易质量。
|
||
|
|
|
||
|
|
#### 策略原理
|
||
|
|
|
||
|
|
该策略的操作逻辑主要基于RSI与SuperTrend两个指标的结合使用:
|
||
|
|
|
||
|
|
1. RSI指标设置:使用14周期的RSI指标,超买线设定为65,超卖线设定为35。
|
||
|
|
2. SuperTrend设置:基于10周期的ATR(平均真实范围)计算,倍数设为3.0,用于确定价格趋势方向。
|
||
|
|
3. 多头入场条件:当RSI从超卖区域向上突破,同时SuperTrend指示牛市趋势(价格位于下轨之上)。
|
||
|
|
4. 空头入场条件:当RSI从超买区域向下突破,同时SuperTrend指示熊市趋势(价格位于上轨之下)。
|
||
|
|
5. 风险管理:每次交易设置1%的止损和1.5%的止盈,保持良好的风险回报比。
|
||
|
|
|
||
|
|
策略通过SuperTrend指标确定整体市场趋势,然后利用RSI指标在趋势方向上寻找反转机会。这种方法避免了盲目逆势交易,提高了信号质量,特别是在高波动性阶段。45分钟时间框架既提供了足够的信号质量,又保持了合理的交易频率。
|
||
|
|
|
||
|
|
#### 策略优势
|
||
|
|
|
||
|
|
1. 综合过滤机制:通过结合RSI的超买超卖条件与SuperTrend的方向过滤器,该策略能够在保持较高胜率的同时,有效过滤掉市场噪音,提供更高质量的入场信号。
|
||
|
|
|
||
|
|
2. 风险控制完善:策略为每笔交易设定了明确的止损(1%)和动态止盈(1.5%),风险回报比优于1:1.5,长期来看有助于资金稳健增长。
|
||
|
|
|
||
|
|
3. 视觉反馈丰富:策略包含清晰的图表可视化元素,包括背景区域、止损/止盈线和实时趋势带,这些设计增强了决策速度和清晰度,便于交易者快速识别信号。
|
||
|
|
|
||
|
|
4. 适应波动市场:与传统RSI策略相比,该系统不会在任何市场条件下盲目反转,而是专注于捕捉结构化趋势中的清晰摆动,特别适合高波动性阶段的交易。
|
||
|
|
|
||
|
|
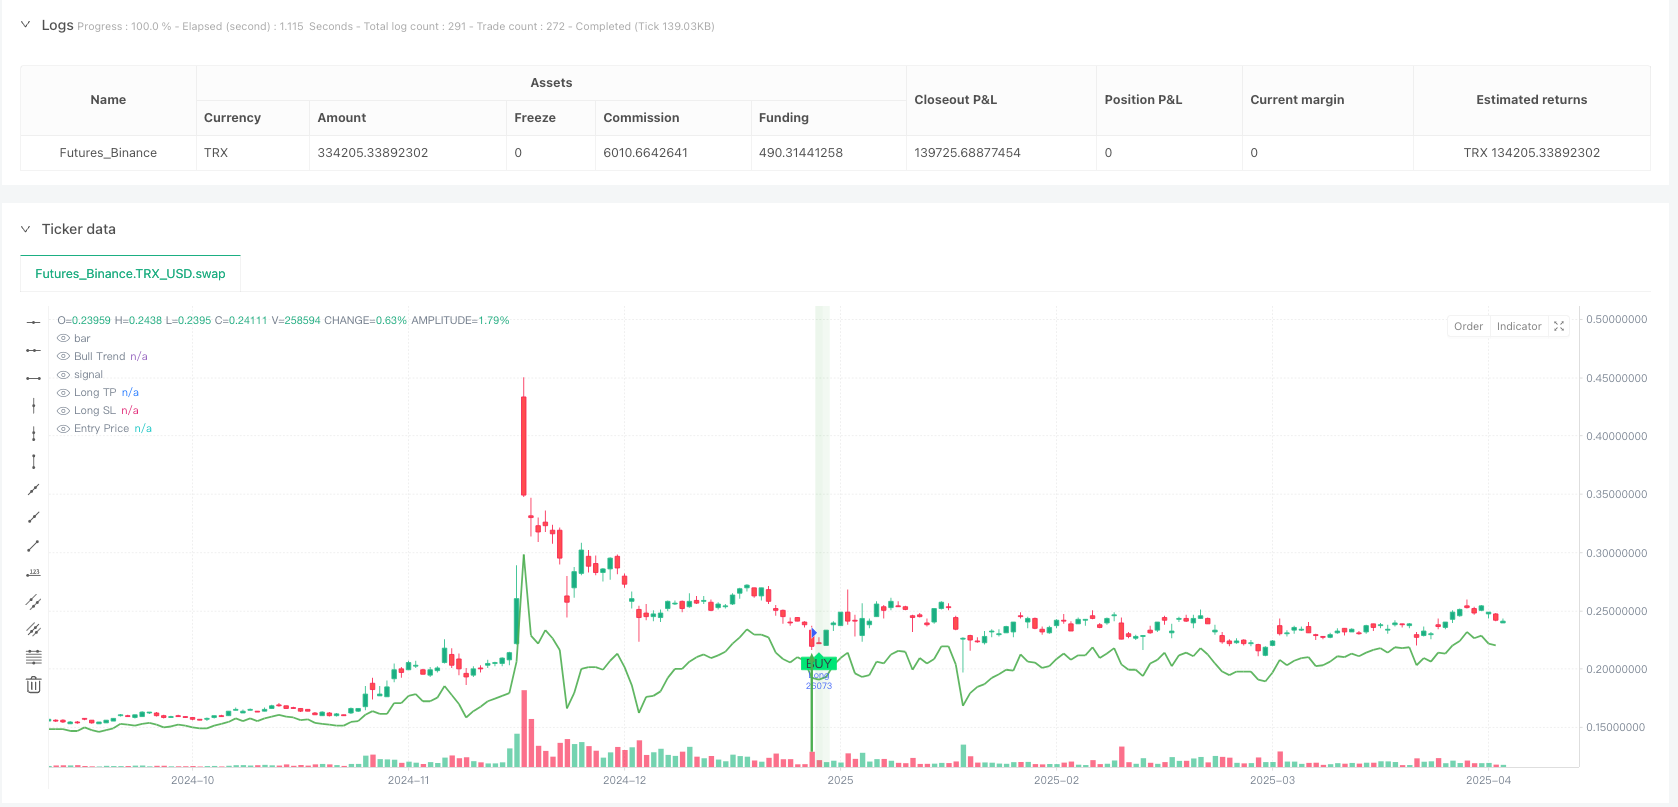
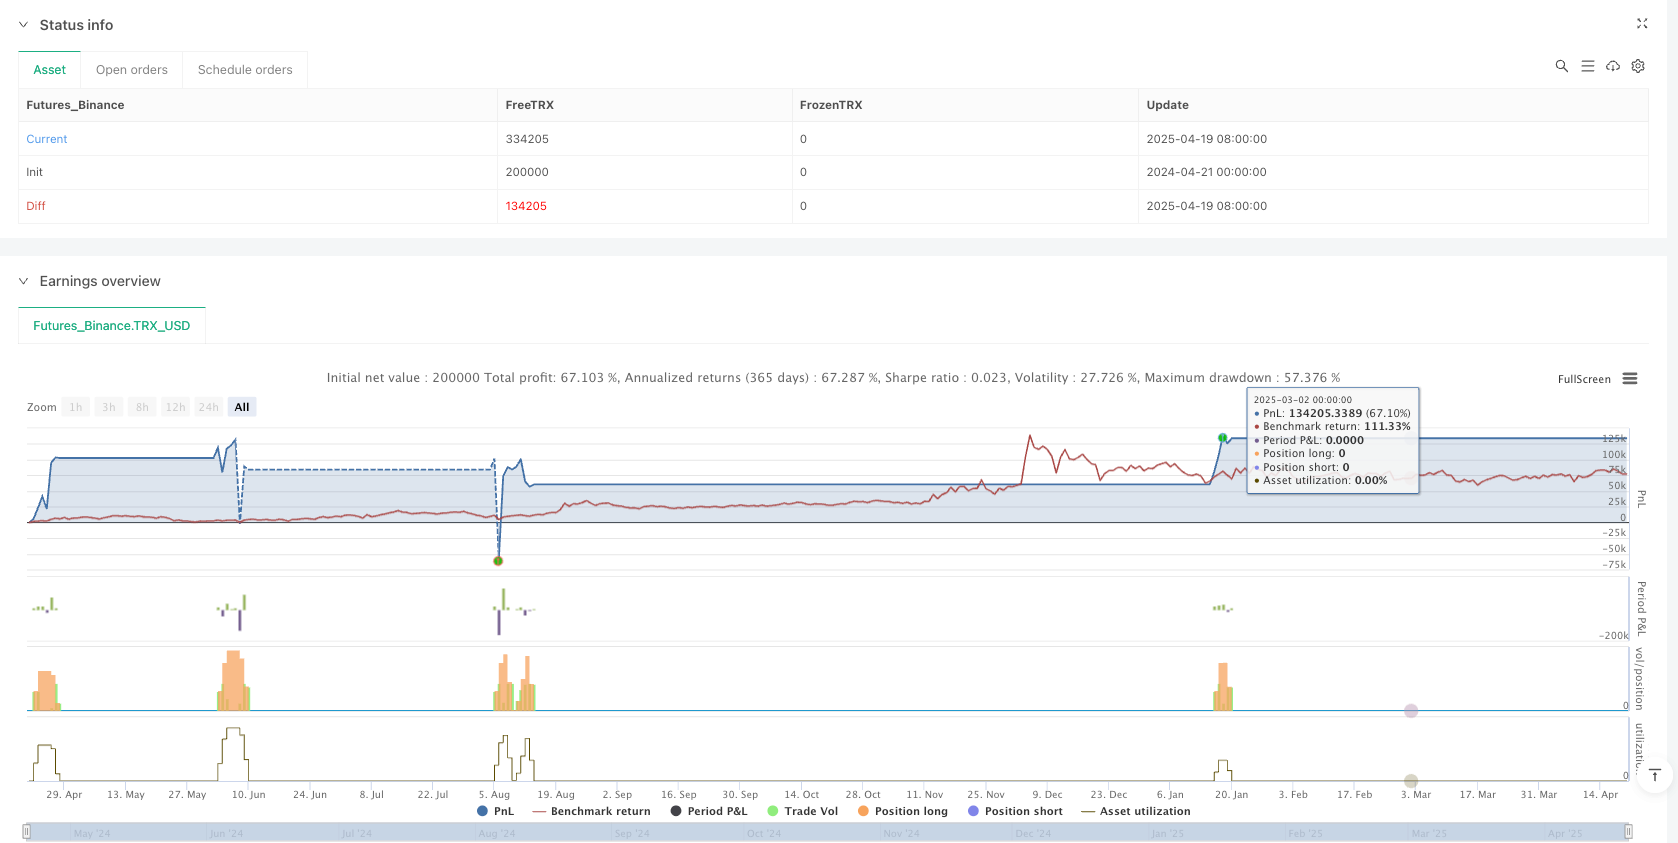
5. 回测表现可靠:在45分钟时间框架的比特币测试中,策略展现了+213,885 USDT的总盈利,进行了239笔交易,最大回撤控制在15%,盈利因子达到1.12,表现相当稳健。
|
||
|
|
|
||
|
|
#### 策略风险
|
||
|
|
|
||
|
|
1. 震荡市场表现欠佳:该策略主要为趋势市场设计,在横盘整理或区间震荡行情中可能会产生频繁的假信号,导致连续亏损。建议在明确趋势行情中应用,或增加市场结构识别机制来过滤震荡市场信号。
|
||
|
|
|
||
|
|
2. 止损设置固定风险:1%的固定止损在某些高波动性市场中可能过小,导致被过早触发;而在低波动性市场中则可能过大。建议根据市场波动性动态调整止损比例,如基于ATR设置自适应止损。
|
||
|
|
|
||
|
|
3. 参数敏感性:RSI周期和阈值以及SuperTrend的ATR周期和倍数设置对策略性能有显著影响。不同市场和时间框架可能需要不同的参数设置,过度优化可能导致过拟合风险。
|
||
|
|
|
||
|
|
4. 趋势变化反应滞后:SuperTrend作为趋势指标存在一定滞后性,在趋势突然逆转时可能无法及时调整方向,导致潜在亏损。可考虑结合更敏感的趋势指标或价格行为分析来优化应对趋势转变的能力。
|
||
|
|
|
||
|
|
5. 缺乏成交量确认:现有策略仅依赖价格指标,没有考虑成交量变化,这可能会降低信号的可靠性。建议添加成交量确认机制,提高入场信号的质量。
|
||
|
|
|
||
|
|
#### 策略优化方向
|
||
|
|
|
||
|
|
1. 多时间框架分析整合:可以添加更高时间框架(如4小时或日线)的趋势确认,确保交易方向与大趋势一致。这种"自上而下"的方法可以显著提高策略的胜率,特别是在市场转折点附近。实现方式可以是加入高时间框架的SuperTrend判断作为额外过滤条件。
|
||
|
|
|
||
|
|
2. 自适应参数设计:可以基于市场波动率动态调整RSI的超买超卖阈值和SuperTrend的倍数。例如,在高波动市场可以扩大RSI阈值范围(如30-70),而在低波动市场收窄阈值(如40-60)。这可以通过计算历史波动率并设置动态阈值来实现。
|
||
|
|
|
||
|
|
3. 加入成交量分析:将成交量指标整合到策略中,确保信号发生时有足够的市场参与度。例如,可以要求RSI突破时的成交量高于前N个周期平均值,以过滤掉低成交量的虚假突破。
|
||
|
|
|
||
|
|
4. 市场结构识别:添加市场结构分析组件,如支撑/阻力水平或价格形态识别,帮助策略在震荡市场中减少交易频率,或在趋势市场中提高入场精度。这可以通过分析高低点模式或使用其他市场结构指标来实现。
|
||
|
|
|
||
|
|
5. 优化资金管理:实施动态仓位管理,根据信号强度、市场波动性和账户表现调整每笔交易的仓位大小。例如,可以在连续盈利后逐步增加仓位,在连续亏损后减少仓位,以保护资金并优化回报。
|
||
|
|
|
||
|
|
#### 总结
|
||
|
|
|
||
|
|
RSI与SuperTrend过滤策略组合系统是一个结合动量反转与趋势确认的高效交易框架。通过RSI指标捕捉潜在反转信号,同时使用SuperTrend确保交易方向与主要趋势一致,有效提高了入场信号质量。策略设置了合理的风险管理参数(1%止损与1.5%止盈),具有清晰的可视化界面,便于快速决策。
|
||
|
|
|
||
|
|
该策略在趋势明显的市场中表现出色,适合寻求机械化入场信号的交易者,同时为自动化交易提供了坚实基础。不过,策略在震荡市场中表现可能欠佳,且需注意参数敏感性和趋势变化的滞后反应问题。
|
||
|
|
|
||
|
|
未来优化方向包括整合多时间框架分析、设计自适应参数、加入成交量确认、增强市场结构识别能力以及完善资金管理系统。这些改进将进一步提高策略的稳健性和适应性,使其能在各种市场环境中保持竞争力。
|
||
|
|
|
||
|
|
通过深入理解和合理应用这一策略框架,交易者可以在保持风险控制的同时,有效捕捉市场中的高质量交易机会,实现长期稳定的交易收益。||
|
||
|
|
|
||
|
|
#### Overview
|
||
|
|
|
||
|
|
The RSI and SuperTrend Filter Combination System is a quantitative trading strategy that combines the technical indicators RSI (Relative Strength Index) with a SuperTrend filter. The core philosophy of this strategy is "don't fight the trend — and never ignore momentum exhaustion." Operating on a 45-minute timeframe, the strategy looks for RSI overbought/oversold reversal signals, but only executes trades when price action aligns with the trend direction confirmed by SuperTrend. This combination effectively filters out a large amount of noise signals that would typically occur when using the RSI indicator alone on lower timeframes, thus improving trade quality.
|
||
|
|
|
||
|
|
#### Strategy Principles
|
||
|
|
|
||
|
|
The operational logic of this strategy is primarily based on the combined use of RSI and SuperTrend indicators:
|
||
|
|
|
||
|
|
1. RSI Settings: Uses a 14-period RSI indicator, with the overbought line set at 65 and oversold line at 35.
|
||
|
|
2. SuperTrend Settings: Calculated based on a 10-period ATR (Average True Range) with a multiplier of 3.0, used to determine price trend direction.
|
||
|
|
3. Long Entry Conditions: When RSI crosses upward from the oversold zone while SuperTrend indicates a bullish trend (price above the lower band).
|
||
|
|
4. Short Entry Conditions: When RSI crosses downward from the overbought zone while SuperTrend indicates a bearish trend (price below the upper band).
|
||
|
|
5. Risk Management: Each trade sets a 1% stop loss and 1.5% take profit, maintaining a favorable risk-reward ratio.
|
||
|
|
|
||
|
|
The strategy uses the SuperTrend indicator to determine the overall market trend, then utilizes the RSI indicator to look for reversal opportunities in the direction of the trend. This method avoids blind counter-trend trading, improves signal quality, especially during high volatility phases. The 45-minute timeframe provides both sufficient signal quality and reasonable trading frequency.
|
||
|
|
|
||
|
|
#### Strategy Advantages
|
||
|
|
|
||
|
|
1. Comprehensive Filtering Mechanism: By combining RSI's overbought/oversold conditions with SuperTrend's directional filter, this strategy can maintain a high win rate while effectively filtering out market noise, providing higher quality entry signals.
|
||
|
|
|
||
|
|
2. Sound Risk Control: The strategy sets clear stop losses (1%) and dynamic take profits (1.5%) for each trade, with a risk-reward ratio better than 1:1.5, contributing to stable capital growth in the long term.
|
||
|
|
|
||
|
|
3. Rich Visual Feedback: The strategy includes clear chart visualization elements, including background zones, stop loss/take profit lines, and real-time trend bands. These designs enhance decision-making speed and clarity, allowing traders to quickly identify signals.
|
||
|
|
|
||
|
|
4. Adaptation to Volatile Markets: Unlike traditional RSI strategies, this system doesn't blindly reverse under any market conditions but focuses on capturing clear swings in structured trends, particularly suitable for trading during high volatility phases.
|
||
|
|
|
||
|
|
5. Reliable Backtesting Performance: In Bitcoin testing on the 45-minute timeframe, the strategy demonstrated a total profit of +213,885 USDT across 239 trades, with maximum drawdown controlled at 15% and a profit factor of 1.12, showing quite robust performance.
|
||
|
|
|
||
|
|
#### Strategy Risks
|
||
|
|
|
||
|
|
1. Poor Performance in Ranging Markets: This strategy is primarily designed for trending markets and may generate frequent false signals in sideways or range-bound conditions, leading to consecutive losses. It is recommended to apply it in clear trending markets or add market structure identification mechanisms to filter out ranging market signals.
|
||
|
|
|
||
|
|
2. Fixed Risk in Stop Loss Settings: The fixed 1% stop loss may be too small in some highly volatile markets, causing premature triggering; while in low volatility markets, it may be too large. It is advisable to dynamically adjust the stop loss percentage based on market volatility, such as setting adaptive stops based on ATR.
|
||
|
|
|
||
|
|
3. Parameter Sensitivity: RSI periods and thresholds, as well as SuperTrend's ATR period and multiplier settings, significantly impact strategy performance. Different markets and timeframes may require different parameter settings, and excessive optimization may lead to overfitting risk.
|
||
|
|
|
||
|
|
4. Lagged Response to Trend Changes: As a trend indicator, SuperTrend has a certain lag and may not adjust direction in time when trends suddenly reverse, leading to potential losses. Consider combining more sensitive trend indicators or price action analysis to optimize the ability to respond to trend changes.
|
||
|
|
|
||
|
|
5. Lack of Volume Confirmation: The existing strategy relies solely on price indicators without considering volume changes, which may reduce signal reliability. Adding volume confirmation mechanisms is recommended to improve the quality of entry signals.
|
||
|
|
|
||
|
|
#### Strategy Optimization Directions
|
||
|
|
|
||
|
|
1. Multi-Timeframe Analysis Integration: Higher timeframe trend confirmation (such as 4-hour or daily) can be added to ensure that the trading direction is consistent with the major trend. This "top-down" approach can significantly improve the strategy's win rate, especially near market turning points. This can be implemented by adding higher timeframe SuperTrend judgments as additional filtering conditions.
|
||
|
|
|
||
|
|
2. Adaptive Parameter Design: RSI overbought/oversold thresholds and SuperTrend multipliers can be dynamically adjusted based on market volatility. For example, expand the RSI threshold range (e.g., 30-70) in high volatility markets and narrow thresholds (e.g., 40-60) in low volatility markets. This can be achieved by calculating historical volatility and setting dynamic thresholds.
|
||
|
|
|
||
|
|
3. Incorporating Volume Analysis: Integrate volume indicators into the strategy to ensure sufficient market participation when signals occur. For example, require that volume during RSI breakouts be higher than the average of the previous N periods to filter out false breakouts with low volume.
|
||
|
|
|
||
|
|
4. Market Structure Identification: Add market structure analysis components, such as support/resistance levels or price pattern recognition, to help the strategy reduce trading frequency in ranging markets or improve entry precision in trending markets. This can be implemented by analyzing high-low point patterns or using other market structure indicators.
|
||
|
|
|
||
|
|
5. Optimizing Capital Management: Implement dynamic position sizing, adjusting position size for each trade based on signal strength, market volatility, and account performance. For example, gradually increase positions after consecutive profits and reduce positions after consecutive losses to protect capital and optimize returns.
|
||
|
|
|
||
|
|
#### Summary
|
||
|
|
|
||
|
|
The RSI and SuperTrend Filter Combination System is an efficient trading framework that combines momentum reversal with trend confirmation. By capturing potential reversal signals through the RSI indicator while using SuperTrend to ensure trade direction aligns with the main trend, it effectively improves entry signal quality. The strategy sets reasonable risk management parameters (1% stop loss and 1.5% take profit) and features a clear visualization interface for quick decision-making.
|
||
|
|
|
||
|
|
This strategy performs excellently in markets with clear trends and is suitable for traders seeking mechanical entry signals while providing a solid foundation for automated trading. However, performance may be suboptimal in ranging markets, and attention should be paid to parameter sensitivity and lagged response to trend changes.
|
||
|
|
|
||
|
|
Future optimization directions include integrating multi-timeframe analysis, designing adaptive parameters, adding volume confirmation, enhancing market structure recognition capabilities, and improving capital management systems. These improvements will further enhance the strategy's robustness and adaptability, enabling it to remain competitive across various market environments.
|
||
|
|
|
||
|
|
By deeply understanding and reasonably applying this strategic framework, traders can effectively capture high-quality trading opportunities in the market while maintaining risk control, achieving long-term stable trading returns.[/trans]
|
||
|
|
|
||
|
|
|
||
|
|
|
||
|
|
> Source (PineScript)
|
||
|
|
|
||
|
|
``` pinescript
|
||
|
|
/*backtest
|
||
|
|
start: 2024-04-21 00:00:00
|
||
|
|
end: 2025-04-20 00:00:00
|
||
|
|
period: 1d
|
||
|
|
basePeriod: 1d
|
||
|
|
exchanges: [{"eid":"Futures_Binance","currency":"TRX_USD"}]
|
||
|
|
*/
|
||
|
|
|
||
|
|
//@version=5
|
||
|
|
strategy("RSI + SuperTrend Filter Strategy (45m BTCUSDT)", overlay=true, default_qty_type=strategy.percent_of_equity, default_qty_value=100)
|
||
|
|
|
||
|
|
// === Inputs
|
||
|
|
rsiPeriod = input.int(14, "RSI Period")
|
||
|
|
rsiOverbought = input.int(65, "RSI Overbought")
|
||
|
|
rsiOversold = input.int(35, "RSI Oversold")
|
||
|
|
tpPerc = input.float(1.5, "TP %") / 100
|
||
|
|
slPerc = input.float(1.0, "SL %") / 100
|
||
|
|
|
||
|
|
atrPeriod = input.int(10, "SuperTrend ATR Period")
|
||
|
|
atrMult = input.float(3.0, "SuperTrend Multiplier")
|
||
|
|
|
||
|
|
// === RSI & SuperTrend
|
||
|
|
rsi = ta.rsi(close, rsiPeriod)
|
||
|
|
atr = ta.atr(atrPeriod)
|
||
|
|
hl2 = (high + low) / 2
|
||
|
|
upperBand = hl2 + atrMult * atr
|
||
|
|
lowerBand = hl2 - atrMult * atr
|
||
|
|
|
||
|
|
var int superDir = 1
|
||
|
|
superDir := close > lowerBand ? 1 : close < upperBand ? -1 : superDir[1]
|
||
|
|
|
||
|
|
isBull = superDir == 1
|
||
|
|
isBear = superDir == -1
|
||
|
|
|
||
|
|
// === Signals
|
||
|
|
longSignal = ta.crossover(rsi, rsiOversold) and isBull
|
||
|
|
shortSignal = ta.crossunder(rsi, rsiOverbought) and isBear
|
||
|
|
|
||
|
|
// === Entry/Exit
|
||
|
|
strategy.entry("Long", strategy.long, when=longSignal)
|
||
|
|
strategy.entry("Short", strategy.short, when=shortSignal)
|
||
|
|
|
||
|
|
longTP = close * (1 + tpPerc)
|
||
|
|
longSL = close * (1 - slPerc)
|
||
|
|
shortTP = close * (1 - tpPerc)
|
||
|
|
shortSL = close * (1 + slPerc)
|
||
|
|
|
||
|
|
strategy.exit("Long Exit", from_entry="Long", limit=longTP, stop=longSL)
|
||
|
|
strategy.exit("Short Exit", from_entry="Short", limit=shortTP, stop=shortSL)
|
||
|
|
|
||
|
|
// === Visuals — Beautiful Chart Enhancements ===
|
||
|
|
|
||
|
|
// SuperTrend Line
|
||
|
|
plot(superDir == 1 ? lowerBand : na, title="Bull Trend", color=color.new(color.green, 10), linewidth=2, style=plot.style_line)
|
||
|
|
plot(superDir == -1 ? upperBand : na, title="Bear Trend", color=color.new(color.red, 10), linewidth=2, style=plot.style_line)
|
||
|
|
|
||
|
|
// Buy/Sell Tags
|
||
|
|
plotshape(longSignal, title="BUY", location=location.belowbar, style=shape.labelup,
|
||
|
|
text="BUY", size=size.small, textcolor=color.black, color=color.new(color.lime, 0))
|
||
|
|
|
||
|
|
plotshape(shortSignal, title="SELL", location=location.abovebar, style=shape.labeldown,
|
||
|
|
text="SELL", size=size.small, textcolor=color.white, color=color.new(color.red, 0))
|
||
|
|
|
||
|
|
// Directional Arrows
|
||
|
|
plotarrow(longSignal ? 1 : na, colorup=color.new(color.green, 0), offset=-1)
|
||
|
|
plotarrow(shortSignal ? -1 : na, colordown=color.new(color.red, 0), offset=-1)
|
||
|
|
|
||
|
|
// Background Highlight
|
||
|
|
bgcolor(strategy.position_size > 0 ? color.new(color.green, 90) : na, title="Long BG")
|
||
|
|
bgcolor(strategy.position_size < 0 ? color.new(color.red, 90) : na, title="Short BG")
|
||
|
|
|
||
|
|
// TP & SL Lines
|
||
|
|
plot(strategy.position_size > 0 ? longTP : na, color=color.new(color.green, 0), title="Long TP", linewidth=1, style=plot.style_linebr)
|
||
|
|
plot(strategy.position_size > 0 ? longSL : na, color=color.new(color.red, 0), title="Long SL", linewidth=1, style=plot.style_linebr)
|
||
|
|
plot(strategy.position_size < 0 ? shortTP : na, color=color.new(color.green, 0), title="Short TP", linewidth=1, style=plot.style_linebr)
|
||
|
|
plot(strategy.position_size < 0 ? shortSL : na, color=color.new(color.red, 0), title="Short SL", linewidth=1, style=plot.style_linebr)
|
||
|
|
|
||
|
|
// Entry Price Line
|
||
|
|
plot(strategy.position_size != 0 ? strategy.position_avg_price : na, title="Entry Price", color=color.gray, style=plot.style_linebr, linewidth=1)
|
||
|
|
|
||
|
|
// === Optional: Light trade zone shading
|
||
|
|
longBg = longSignal ? color.new(color.green, 85) : na
|
||
|
|
shortBg = shortSignal ? color.new(color.red, 85) : na
|
||
|
|
bgcolor(longBg, title="Long Signal Highlight")
|
||
|
|
bgcolor(shortBg, title="Short Signal Highlight")
|
||
|
|
|
||
|
|
// === Alerts
|
||
|
|
alertcondition(longSignal, title="BUY Signal", message="RSI+Trend BUY Signal on {{ticker}}")
|
||
|
|
alertcondition(shortSignal, title="SELL Signal", message="RSI+Trend SELL Signal on {{ticker}}")
|
||
|
|
|
||
|
|
```
|
||
|
|
|
||
|
|
> Detail
|
||
|
|
|
||
|
|
https://www.fmz.com/strategy/491514
|
||
|
|
|
||
|
|
> Last Modified
|
||
|
|
|
||
|
|
2025-04-21 16:31:17
|