311 lines
17 KiB
Markdown
311 lines
17 KiB
Markdown

|
|
||
|
|
> Name
|
||
|
|
|
||
|
|
MACD-ATR-EMA-多重指标动态趋势跟踪策略-MACD-ATR-EMA-Multi-Indicator-Dynamic-Trend-Following-Strategy
|
||
|
|
|
||
|
|
> Author
|
||
|
|
|
||
|
|
ChaoZhang
|
||
|
|
|
||
|
|
> Strategy Description
|
||
|
|
|
||
|
|
|
||
|
|
|
||
|
|
[trans]
|
||
|
|
|
||
|
|
#### 概述
|
||
|
|
|
||
|
|
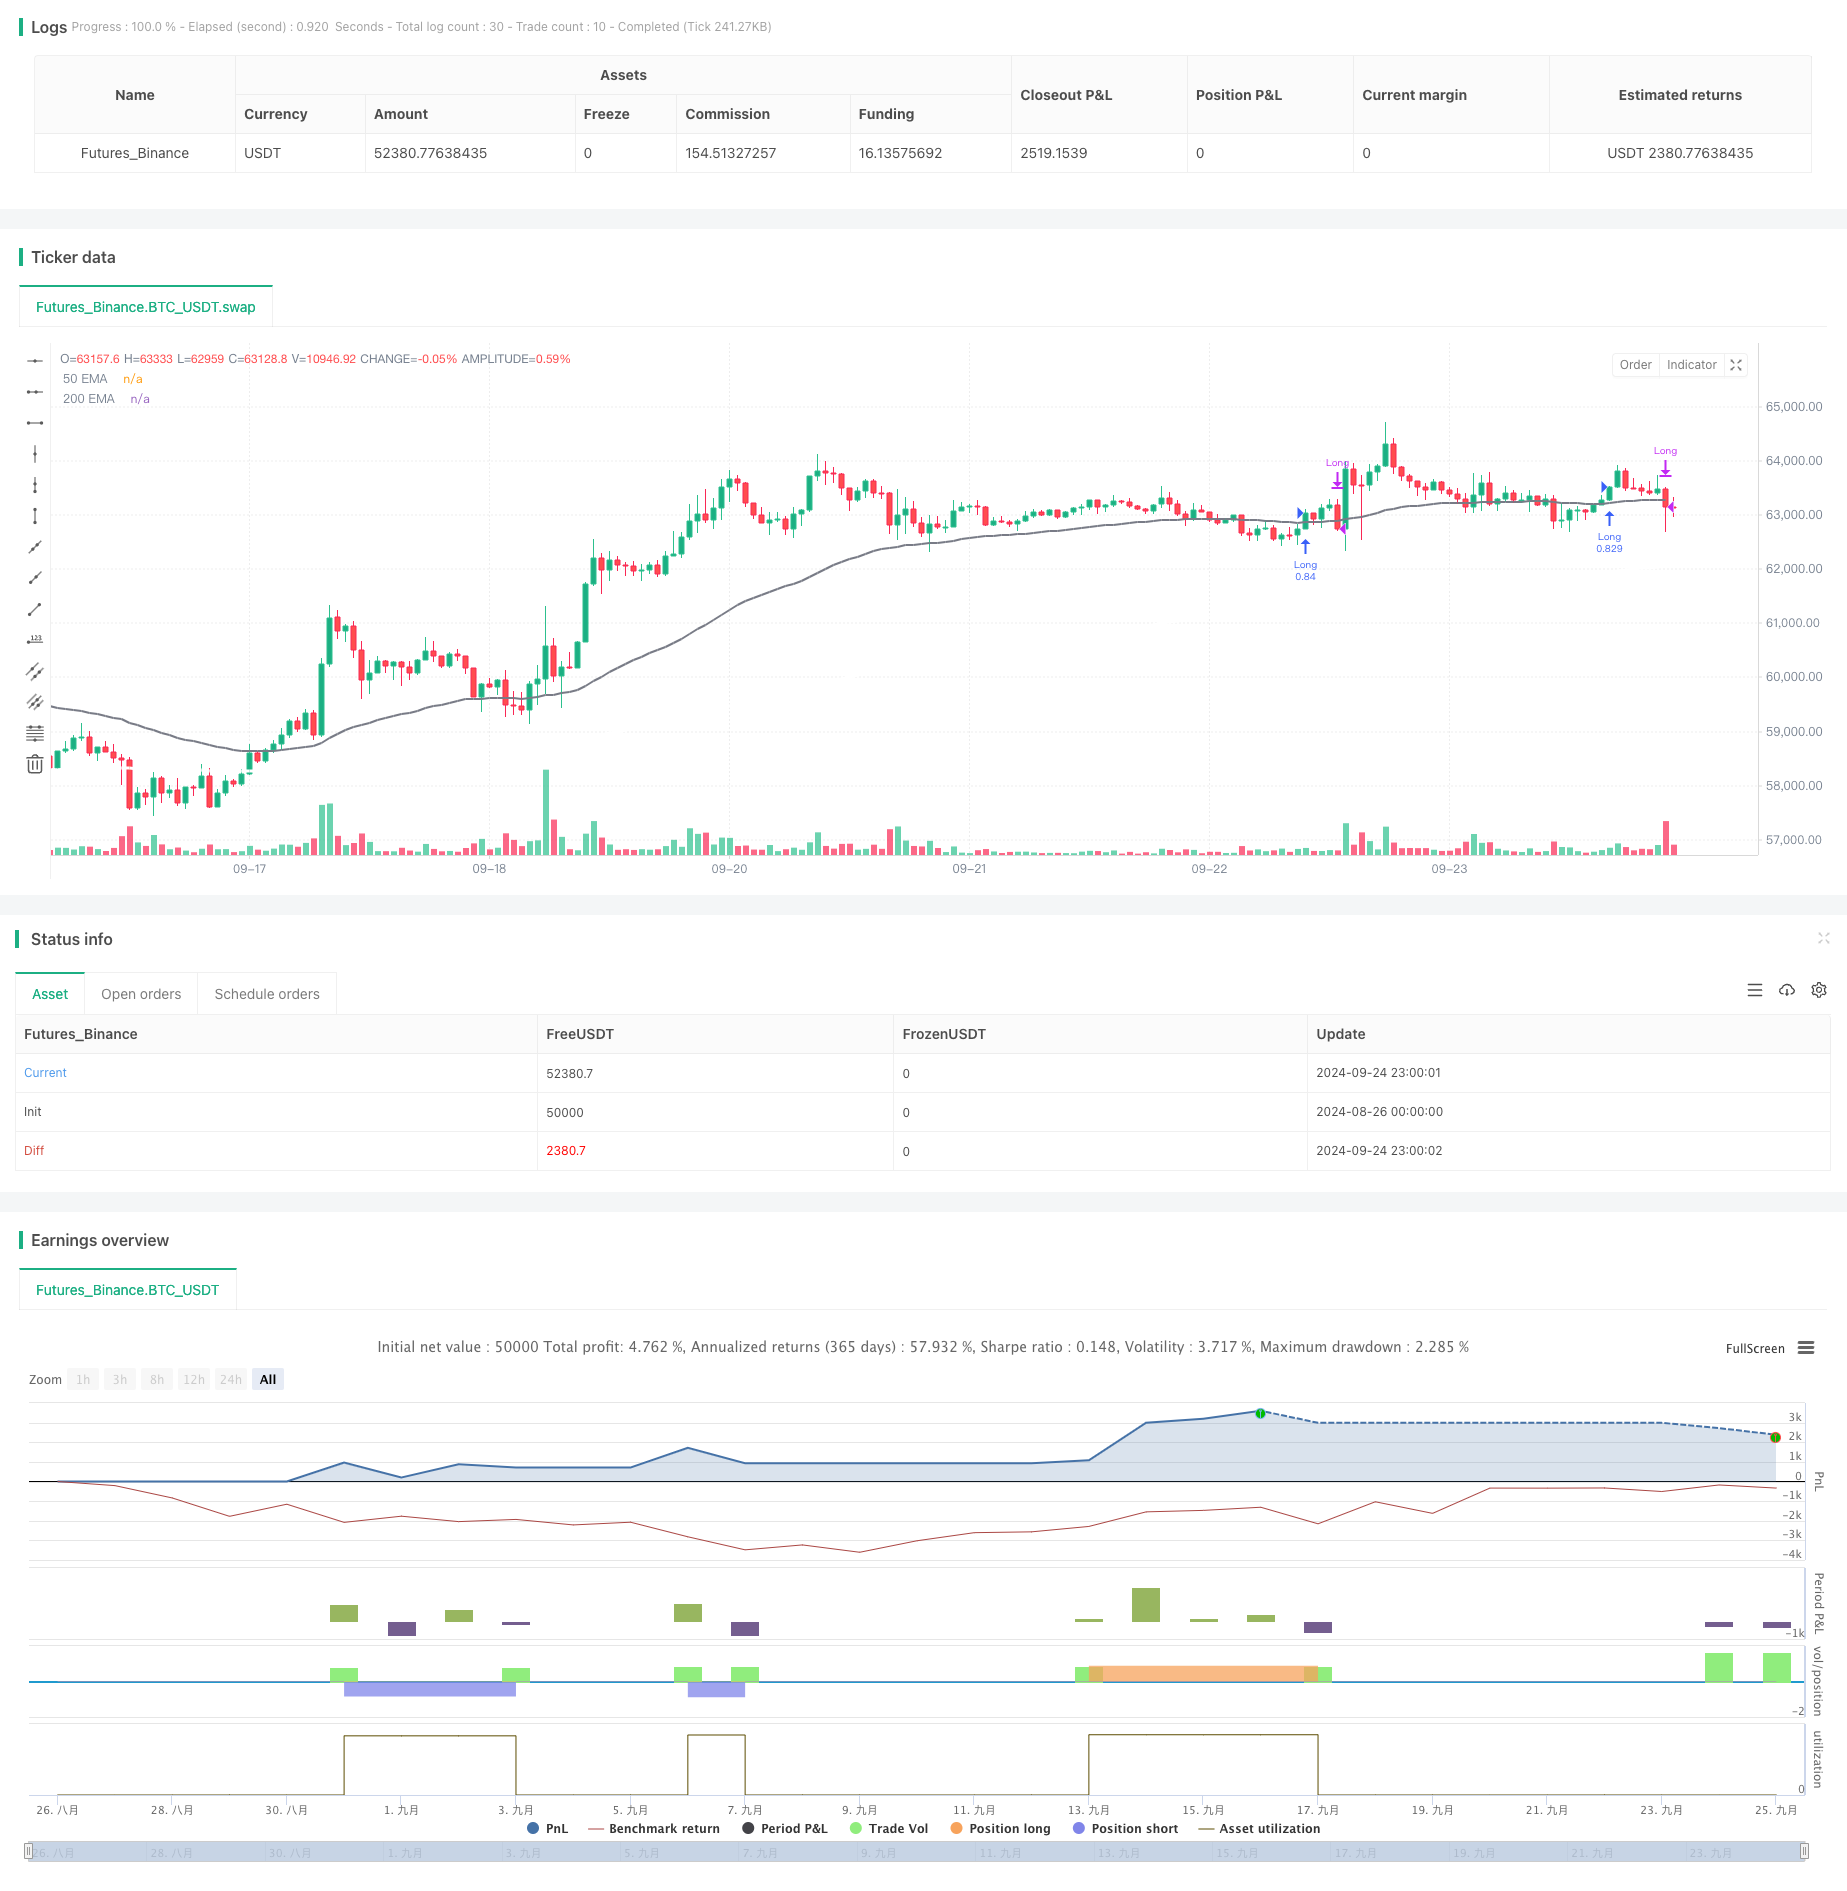
MACD-ATR-EMA多重指标动态趋势跟踪策略是一个结合了多个技术指标的复合型交易系统。该策略利用移动平均线收敛散度(MACD)、平均真实波幅(ATR)和指数移动平均线(EMA)等指标,旨在捕捉市场趋势,同时动态管理风险。策略的核心思想是通过MACD识别潜在的趋势反转点,使用ATR过滤低波动性时期,并利用短期和长期EMA确认趋势方向。此外,策略还提供了灵活的止损设置选项,traders可以选择基于近期高低点或动态ATR的止损方法,以适应不同的市场环境。
|
||
|
|
|
||
|
|
#### 策略原理
|
||
|
|
|
||
|
|
1. 趋势识别:
|
||
|
|
- 使用MACD指标(12,26,9)识别潜在的趋势反转信号。
|
||
|
|
- 利用50期和200期EMA确认整体市场趋势方向。
|
||
|
|
|
||
|
|
2. 入场条件:
|
||
|
|
- 多头入场:MACD线上穿信号线,且收盘价高于50期和200期EMA,同时MACD和信号线均为负值。
|
||
|
|
- 空头入场:MACD线下穿信号线,且收盘价低于50期和200期EMA,同时MACD和信号线均为正值。
|
||
|
|
|
||
|
|
3. 风险管理:
|
||
|
|
- 使用ATR指标(14期)过滤低波动性环境,只有当ATR高于设定阈值时才允许交易。
|
||
|
|
- 提供两种止损方式:基于近期高低点的止损和基于ATR倍数的动态止损。
|
||
|
|
- 根据用户设定的风险百分比动态计算每笔交易的头寸大小。
|
||
|
|
|
||
|
|
4. 退出策略:
|
||
|
|
- 多头退出:当价格跌破50期EMA时。
|
||
|
|
- 空头退出:当价格突破50期EMA时。
|
||
|
|
|
||
|
|
5. 交易执行:
|
||
|
|
- 所有交易信号仅在K线收盘时确认。
|
||
|
|
- 实施单一持仓管理,确保每次只有一个活跃交易。
|
||
|
|
|
||
|
|
#### 策略优势
|
||
|
|
|
||
|
|
1. 多指标协同:结合MACD、ATR和EMA,实现了趋势识别、波动性过滤和趋势确认的多重验证,提高了交易信号的可靠性。
|
||
|
|
|
||
|
|
2. 动态风险管理:通过ATR阈值过滤低波动环境,避免了在不利市场条件下频繁交易,同时利用ATR或近期高低点动态设置止损,适应不同市场阶段。
|
||
|
|
|
||
|
|
3. 灵活的参数设置:策略提供了多个可调参数,如MACD周期、EMA长度、ATR阈值等,使traders能够根据不同市场和个人偏好进行优化。
|
||
|
|
|
||
|
|
4. 资金管理集成:内置了基于账户总额百分比的头寸计算,确保每笔交易风险可控,有助于长期稳定性。
|
||
|
|
|
||
|
|
5. 趋势跟踪与反转结合:虽然主要是趋势跟踪策略,但通过MACD反转信号的使用,也具备一定的趋势反转捕捉能力,增加了策略的适应性。
|
||
|
|
|
||
|
|
6. 清晰的交易逻辑:入场、出场条件明确,便于理解和回测,同时也利于策略的持续改进。
|
||
|
|
|
||
|
|
#### 策略风险
|
||
|
|
|
||
|
|
1. 滞后性风险:EMA和MACD都是滞后指标,在剧烈波动或快速反转的市场中可能导致入场或出场延迟。
|
||
|
|
|
||
|
|
2. 过度交易风险:尽管有ATR过滤,在震荡市场中仍可能产生频繁的交易信号,增加交易成本。
|
||
|
|
|
||
|
|
3. 假突破风险:MACD交叉可能产生假信号,特别是在横盘整理阶段,可能导致不必要的交易。
|
||
|
|
|
||
|
|
4. 趋势依赖性:策略在强趋势市场表现较好,但在区间震荡市场可能表现欠佳。
|
||
|
|
|
||
|
|
5. 参数敏感性:多个可调参数意味着策略性能可能对参数选择高度敏感,存在过度拟合的风险。
|
||
|
|
|
||
|
|
6. 单一头寸限制:策略限制只能持有一个头寸,可能错过其他潜在的盈利机会。
|
||
|
|
|
||
|
|
#### 策略优化方向
|
||
|
|
|
||
|
|
1. 增加趋势强度过滤:
|
||
|
|
- 引入ADX指标来评估趋势强度,只在趋势明确时进行交易。
|
||
|
|
- 原因:这可以减少震荡市场中的假信号,提高交易质量。
|
||
|
|
|
||
|
|
2. 优化MACD设置:
|
||
|
|
- 尝试不同的MACD参数组合,或考虑使用自适应MACD。
|
||
|
|
- 原因:标准MACD参数可能不适用于所有市场条件,自适应参数可以提高策略的灵活性。
|
||
|
|
|
||
|
|
3. 实现部分止盈:
|
||
|
|
- 在达到某个盈利目标时,可以考虑部分平仓,锁定部分利润。
|
||
|
|
- 原因:这可以在保持趋势跟踪能力的同时,提高策略的盈利稳定性。
|
||
|
|
|
||
|
|
4. 引入市场状态分类:
|
||
|
|
- 使用波动率或趋势指标对市场状态进行分类,在不同状态下使用不同的交易参数。
|
||
|
|
- 原因:这种自适应方法可以使策略更好地适应不同的市场环境。
|
||
|
|
|
||
|
|
5. 增加交易时间过滤:
|
||
|
|
- 分析最佳交易时间段,只在特定时间内允许交易。
|
||
|
|
- 原因:某些市场在特定时间段可能更容易产生有效信号,这可以提高策略的效率。
|
||
|
|
|
||
|
|
6. 优化头寸管理:
|
||
|
|
- 考虑实现梯度加仓或减仓策略,而不是简单的全仓进出。
|
||
|
|
- 原因:这可以更好地利用大趋势,同时减少单笔交易的风险。
|
||
|
|
|
||
|
|
#### 总结
|
||
|
|
|
||
|
|
MACD-ATR-EMA多重指标动态趋势跟踪策略是一个综合性的交易系统,通过结合多个技术指标和风险管理技术,旨在捕捉市场趋势并动态管理风险。该策略的主要优势在于其多层面的信号确认机制和灵活的风险控制方法,使其能够在不同的市场环境中保持稳定性。然而,策略也面临着滞后性、过度交易和参数敏感性等潜在风险。
|
||
|
|
|
||
|
|
通过进一步优化,如增加趋势强度过滤、改进MACD参数设置、实现部分止盈策略等,可以进一步提高策略的性能和适应性。特别是引入市场状态分类和自适应参数方法,有望显著提升策略在不同市场条件下的表现。
|
||
|
|
|
||
|
|
总的来说,这个策略为traders提供了一个坚实的基础框架,可以根据个人交易风格和市场特点进行定制和优化。通过持续的监控和调整,该策略有潜力成为一个可靠的长期交易工具。
|
||
|
|
|
||
|
|
||
|
||
|
|
|
||
|
|
#### Overview
|
||
|
|
|
||
|
|
The MACD-ATR-EMA Multi-Indicator Dynamic Trend Following Strategy is a sophisticated trading system that combines multiple technical indicators. This strategy utilizes the Moving Average Convergence Divergence (MACD), Average True Range (ATR), and Exponential Moving Averages (EMA) to capture market trends while dynamically managing risk. The core idea is to identify potential trend reversals using MACD, filter out low volatility periods with ATR, and confirm trend direction using both short-term and long-term EMAs. Additionally, the strategy offers flexible stop-loss options, allowing traders to choose between recent swing high/low levels or a dynamic ATR-based stop, ensuring adaptability to various market conditions.
|
||
|
|
|
||
|
|
#### Strategy Principles
|
||
|
|
|
||
|
|
1. Trend Identification:
|
||
|
|
- Uses MACD indicator (12,26,9) to identify potential trend reversal signals.
|
||
|
|
- Utilizes 50-period and 200-period EMAs to confirm overall market trend direction.
|
||
|
|
|
||
|
|
2. Entry Conditions:
|
||
|
|
- Long Entry: MACD line crosses above the signal line, closing price above both 50 and 200 EMAs, and both MACD and signal lines are negative.
|
||
|
|
- Short Entry: MACD line crosses below the signal line, closing price below both 50 and 200 EMAs, and both MACD and signal lines are positive.
|
||
|
|
|
||
|
|
3. Risk Management:
|
||
|
|
- Employs ATR indicator (14-period) to filter out low volatility environments, only allowing trades when ATR is above a set threshold.
|
||
|
|
- Offers two stop-loss methods: based on recent swing highs/lows or dynamic ATR-based stops.
|
||
|
|
- Dynamically calculates position size for each trade based on user-defined risk percentage.
|
||
|
|
|
||
|
|
4. Exit Strategy:
|
||
|
|
- Long Exit: When price falls below the 50-period EMA.
|
||
|
|
- Short Exit: When price rises above the 50-period EMA.
|
||
|
|
|
||
|
|
5. Trade Execution:
|
||
|
|
- All trading signals are confirmed only at the close of candles.
|
||
|
|
- Implements single position management, ensuring only one active trade at a time.
|
||
|
|
|
||
|
|
#### Strategy Advantages
|
||
|
|
|
||
|
|
1. Multi-Indicator Synergy: Combining MACD, ATR, and EMA achieves multiple validations for trend identification, volatility filtering, and trend confirmation, enhancing the reliability of trading signals.
|
||
|
|
|
||
|
|
2. Dynamic Risk Management: ATR threshold filtering avoids frequent trading in unfavorable market conditions, while dynamic stop-loss setting using ATR or recent swing points adapts to different market phases.
|
||
|
|
|
||
|
|
3. Flexible Parameter Settings: The strategy offers multiple adjustable parameters such as MACD periods, EMA lengths, and ATR threshold, allowing traders to optimize based on different markets and personal preferences.
|
||
|
|
|
||
|
|
4. Integrated Capital Management: Built-in position sizing based on account total percentage ensures controlled risk for each trade, contributing to long-term stability.
|
||
|
|
|
||
|
|
5. Trend Following and Reversal Combination: While primarily a trend-following strategy, it also has some trend reversal capture capability through the use of MACD reversal signals, increasing the strategy's adaptability.
|
||
|
|
|
||
|
|
6. Clear Trading Logic: Entry and exit conditions are well-defined, facilitating understanding and backtesting, and also beneficial for continuous strategy improvement.
|
||
|
|
|
||
|
|
#### Strategy Risks
|
||
|
|
|
||
|
|
1. Lag Risk: Both EMA and MACD are lagging indicators, which may lead to delayed entries or exits in markets with sharp volatility or rapid reversals.
|
||
|
|
|
||
|
|
2. Overtrading Risk: Despite ATR filtering, frequent trading signals may still occur in oscillating markets, increasing transaction costs.
|
||
|
|
|
||
|
|
3. False Breakout Risk: MACD crossovers can produce false signals, especially during sideways consolidation phases, potentially leading to unnecessary trades.
|
||
|
|
|
||
|
|
4. Trend Dependency: The strategy performs well in strong trend markets but may underperform in range-bound markets.
|
||
|
|
|
||
|
|
5. Parameter Sensitivity: Multiple adjustable parameters mean strategy performance may be highly sensitive to parameter selection, risking overfitting.
|
||
|
|
|
||
|
|
6. Single Position Limitation: The strategy limits to holding only one position, potentially missing out on other profitable opportunities.
|
||
|
|
|
||
|
|
#### Strategy Optimization Directions
|
||
|
|
|
||
|
|
1. Add Trend Strength Filtering:
|
||
|
|
- Introduce ADX indicator to assess trend strength, trading only when trends are clear.
|
||
|
|
- Reason: This can reduce false signals in oscillating markets, improving trade quality.
|
||
|
|
|
||
|
|
2. Optimize MACD Settings:
|
||
|
|
- Experiment with different MACD parameter combinations or consider using adaptive MACD.
|
||
|
|
- Reason: Standard MACD parameters may not be suitable for all market conditions; adaptive parameters can increase strategy flexibility.
|
||
|
|
|
||
|
|
3. Implement Partial Profit-Taking:
|
||
|
|
- Consider partial position closure when reaching certain profit targets to lock in some gains.
|
||
|
|
- Reason: This can improve strategy profit stability while maintaining trend-following capability.
|
||
|
|
|
||
|
|
4. Introduce Market State Classification:
|
||
|
|
- Use volatility or trend indicators to classify market states and apply different trading parameters in different states.
|
||
|
|
- Reason: This adaptive approach can help the strategy better adjust to various market environments.
|
||
|
|
|
||
|
|
5. Add Trading Time Filters:
|
||
|
|
- Analyze optimal trading time periods and only allow trades during specific times.
|
||
|
|
- Reason: Some markets may produce more effective signals during certain time periods, which can improve strategy efficiency.
|
||
|
|
|
||
|
|
6. Optimize Position Management:
|
||
|
|
- Consider implementing a graduated scaling in/out strategy instead of simple all-in/all-out trades.
|
||
|
|
- Reason: This can better capitalize on major trends while reducing risk for individual trades.
|
||
|
|
|
||
|
|
#### Conclusion
|
||
|
|
|
||
|
|
The MACD-ATR-EMA Multi-Indicator Dynamic Trend Following Strategy is a comprehensive trading system that aims to capture market trends and dynamically manage risk by combining multiple technical indicators and risk management techniques. The strategy's main strengths lie in its multi-layered signal confirmation mechanism and flexible risk control methods, enabling it to maintain stability across different market environments. However, the strategy also faces potential risks such as lag, overtrading, and parameter sensitivity.
|
||
|
|
|
||
|
|
Through further optimization, such as adding trend strength filtering, improving MACD parameter settings, and implementing partial profit-taking strategies, the strategy's performance and adaptability can be further enhanced. Particularly, introducing market state classification and adaptive parameter methods holds promise for significantly improving the strategy's performance under various market conditions.
|
||
|
|
|
||
|
|
Overall, this strategy provides traders with a solid foundational framework that can be customized and optimized according to individual trading styles and market characteristics. With continuous monitoring and adjustment, this strategy has the potential to become a reliable long-term trading tool.
|
||
|
|
|
||
|
|
[/trans]
|
||
|
|
|
||
|
|
|
||
|
|
|
||
|
|
> Source (PineScript)
|
||
|
|
|
||
|
|
``` pinescript
|
||
|
|
/*backtest
|
||
|
|
start: 2024-08-26 00:00:00
|
||
|
|
end: 2024-09-25 00:00:00
|
||
|
|
period: 1h
|
||
|
|
basePeriod: 1h
|
||
|
|
exchanges: [{"eid":"Futures_Binance","currency":"BTC_USDT"}]
|
||
|
|
*/
|
||
|
|
|
||
|
|
//@version=5
|
||
|
|
strategy("[ROOT] MACD, ATR, & EMA Strategy", overlay = true)
|
||
|
|
|
||
|
|
// Input parameters
|
||
|
|
macd_fast_length = input.int(12, title="MACD Fast Length")
|
||
|
|
macd_slow_length = input.int(26, title="MACD Slow Length")
|
||
|
|
macd_length = input.int(9, title="MACD Signal Length")
|
||
|
|
atr_length = input.int(14, title="ATR Length")
|
||
|
|
slow_ema_length = input.int(200, title="Slow EMA Length")
|
||
|
|
fast_ema_length = input.int(50, title="Fast EMA Length")
|
||
|
|
risk_per_trade = input.float(100, title="Risk % of Total Balance per Trade", minval=0.1, maxval=100, step=0.1)
|
||
|
|
swing_lookback = input.int(10, title="Swing High/Low Lookback Period", minval=1, maxval=50, step=1)
|
||
|
|
stop_loss_type = input.string("Swing Low/High", title="Stop Loss Type", options=["Swing Low/High", "ATR-Based"])
|
||
|
|
stop_loss_buffer = input.float(0.5, title="ATR Multiplier for Stop Loss", minval=0.1, step=0.1)
|
||
|
|
min_atr_threshold = input.float(0.1, title="Minimum ATR Threshold", minval=0.01, step=0.01)
|
||
|
|
|
||
|
|
// Calculate MACD
|
||
|
|
MACD = ta.ema(close, macd_fast_length) - ta.ema(close, macd_slow_length)
|
||
|
|
signal = ta.ema(MACD, macd_length)
|
||
|
|
macd_histogram = MACD - signal
|
||
|
|
|
||
|
|
// Calculate EMAs
|
||
|
|
slow_ema = ta.ema(close, slow_ema_length)
|
||
|
|
fast_ema = ta.ema(close, fast_ema_length)
|
||
|
|
|
||
|
|
// Plot EMAs
|
||
|
|
plot(slow_ema, color=color.white, linewidth=3, title="200 EMA")
|
||
|
|
plot(fast_ema, color=color.gray, linewidth=2, title="50 EMA")
|
||
|
|
|
||
|
|
// Calculate ATR for dynamic stop-loss
|
||
|
|
atr_value = ta.atr(atr_length)
|
||
|
|
|
||
|
|
// Determine recent swing high and swing low
|
||
|
|
recent_swing_high = ta.highest(high, swing_lookback)
|
||
|
|
recent_swing_low = ta.lowest(low, swing_lookback)
|
||
|
|
|
||
|
|
// Determine dynamic stop-loss levels based on user input
|
||
|
|
var float long_stop_loss = na
|
||
|
|
var float short_stop_loss = na
|
||
|
|
|
||
|
|
if (stop_loss_type == "Swing Low/High")
|
||
|
|
// Stop Loss based on recent swing low/high with a buffer
|
||
|
|
long_stop_loss := recent_swing_low - (stop_loss_buffer * atr_value)
|
||
|
|
short_stop_loss := recent_swing_high + (stop_loss_buffer * atr_value)
|
||
|
|
else if (stop_loss_type == "ATR-Based")
|
||
|
|
// Stop Loss based purely on ATR
|
||
|
|
long_stop_loss := close - (stop_loss_buffer * atr_value)
|
||
|
|
short_stop_loss := close + (stop_loss_buffer * atr_value)
|
||
|
|
|
||
|
|
// Calculate position size based on percentage of total balance
|
||
|
|
capital_to_use = strategy.equity * (risk_per_trade / 100)
|
||
|
|
position_size = capital_to_use / close
|
||
|
|
|
||
|
|
// ATR Filter: Only trade when ATR is above the minimum threshold
|
||
|
|
atr_filter = atr_value > min_atr_threshold
|
||
|
|
|
||
|
|
// Buy and Sell Conditions with ATR Filter
|
||
|
|
long_condition = atr_filter and ta.crossover(MACD, signal) and close > slow_ema and close > fast_ema and MACD < 0 and signal < 0
|
||
|
|
short_condition = atr_filter and ta.crossunder(MACD, signal) and close < slow_ema and close < fast_ema and MACD > 0 and signal > 0
|
||
|
|
|
||
|
|
// Check if no open trades exist
|
||
|
|
no_open_trades = (strategy.opentrades == 0)
|
||
|
|
|
||
|
|
// Execute Buy Orders (only on bar close and if no trades are open)
|
||
|
|
if (long_condition and barstate.isconfirmed and no_open_trades)
|
||
|
|
strategy.entry("Long", strategy.long, qty=position_size, stop=long_stop_loss)
|
||
|
|
label.new(bar_index, low, "Buy", color=color.green, style=label.style_label_up, textcolor=color.white, size=size.small)
|
||
|
|
|
||
|
|
// Execute Sell Orders (only on bar close and if no trades are open)
|
||
|
|
if (short_condition and barstate.isconfirmed and no_open_trades)
|
||
|
|
strategy.entry("Short", strategy.short, qty=position_size, stop=short_stop_loss)
|
||
|
|
label.new(bar_index, high, "Sell", color=color.red, style=label.style_label_down, textcolor=color.white, size=size.small)
|
||
|
|
|
||
|
|
// Exit Conditions for Long and Short Positions (only on bar close)
|
||
|
|
long_exit_condition = close < fast_ema
|
||
|
|
short_exit_condition = close > fast_ema
|
||
|
|
|
||
|
|
if (long_exit_condition and barstate.isconfirmed)
|
||
|
|
strategy.close("Long")
|
||
|
|
|
||
|
|
if (short_exit_condition and barstate.isconfirmed)
|
||
|
|
strategy.close("Short")
|
||
|
|
|
||
|
|
// Alert Conditions (only on bar close)
|
||
|
|
alertcondition(long_condition and barstate.isconfirmed, title="Buy Alert", message="Buy Signal")
|
||
|
|
alertcondition(short_condition and barstate.isconfirmed, title="Sell Alert", message="Sell Signal")
|
||
|
|
|
||
|
|
// Exit Signal Alerts
|
||
|
|
alertcondition(long_exit_condition and barstate.isconfirmed, title="Long Exit Alert", message="Exit Long Signal")
|
||
|
|
alertcondition(short_exit_condition and barstate.isconfirmed, title="Short Exit Alert", message="Exit Short Signal")
|
||
|
|
|
||
|
|
```
|
||
|
|
|
||
|
|
> Detail
|
||
|
|
|
||
|
|
https://www.fmz.com/strategy/468304
|
||
|
|
|
||
|
|
> Last Modified
|
||
|
|
|
||
|
|
2024-09-26 14:43:19
|