133 lines
8.5 KiB
Markdown
133 lines
8.5 KiB
Markdown

|
|
||
|
|
> Name
|
||
|
|
|
||
|
|
GBS高低点确认策略-GBS-TOP-BOTTOM-Confirmed-Strategy
|
||
|
|
|
||
|
|
> Author
|
||
|
|
|
||
|
|
ChaoZhang
|
||
|
|
|
||
|
|
> Strategy Description
|
||
|
|
|
||
|
|
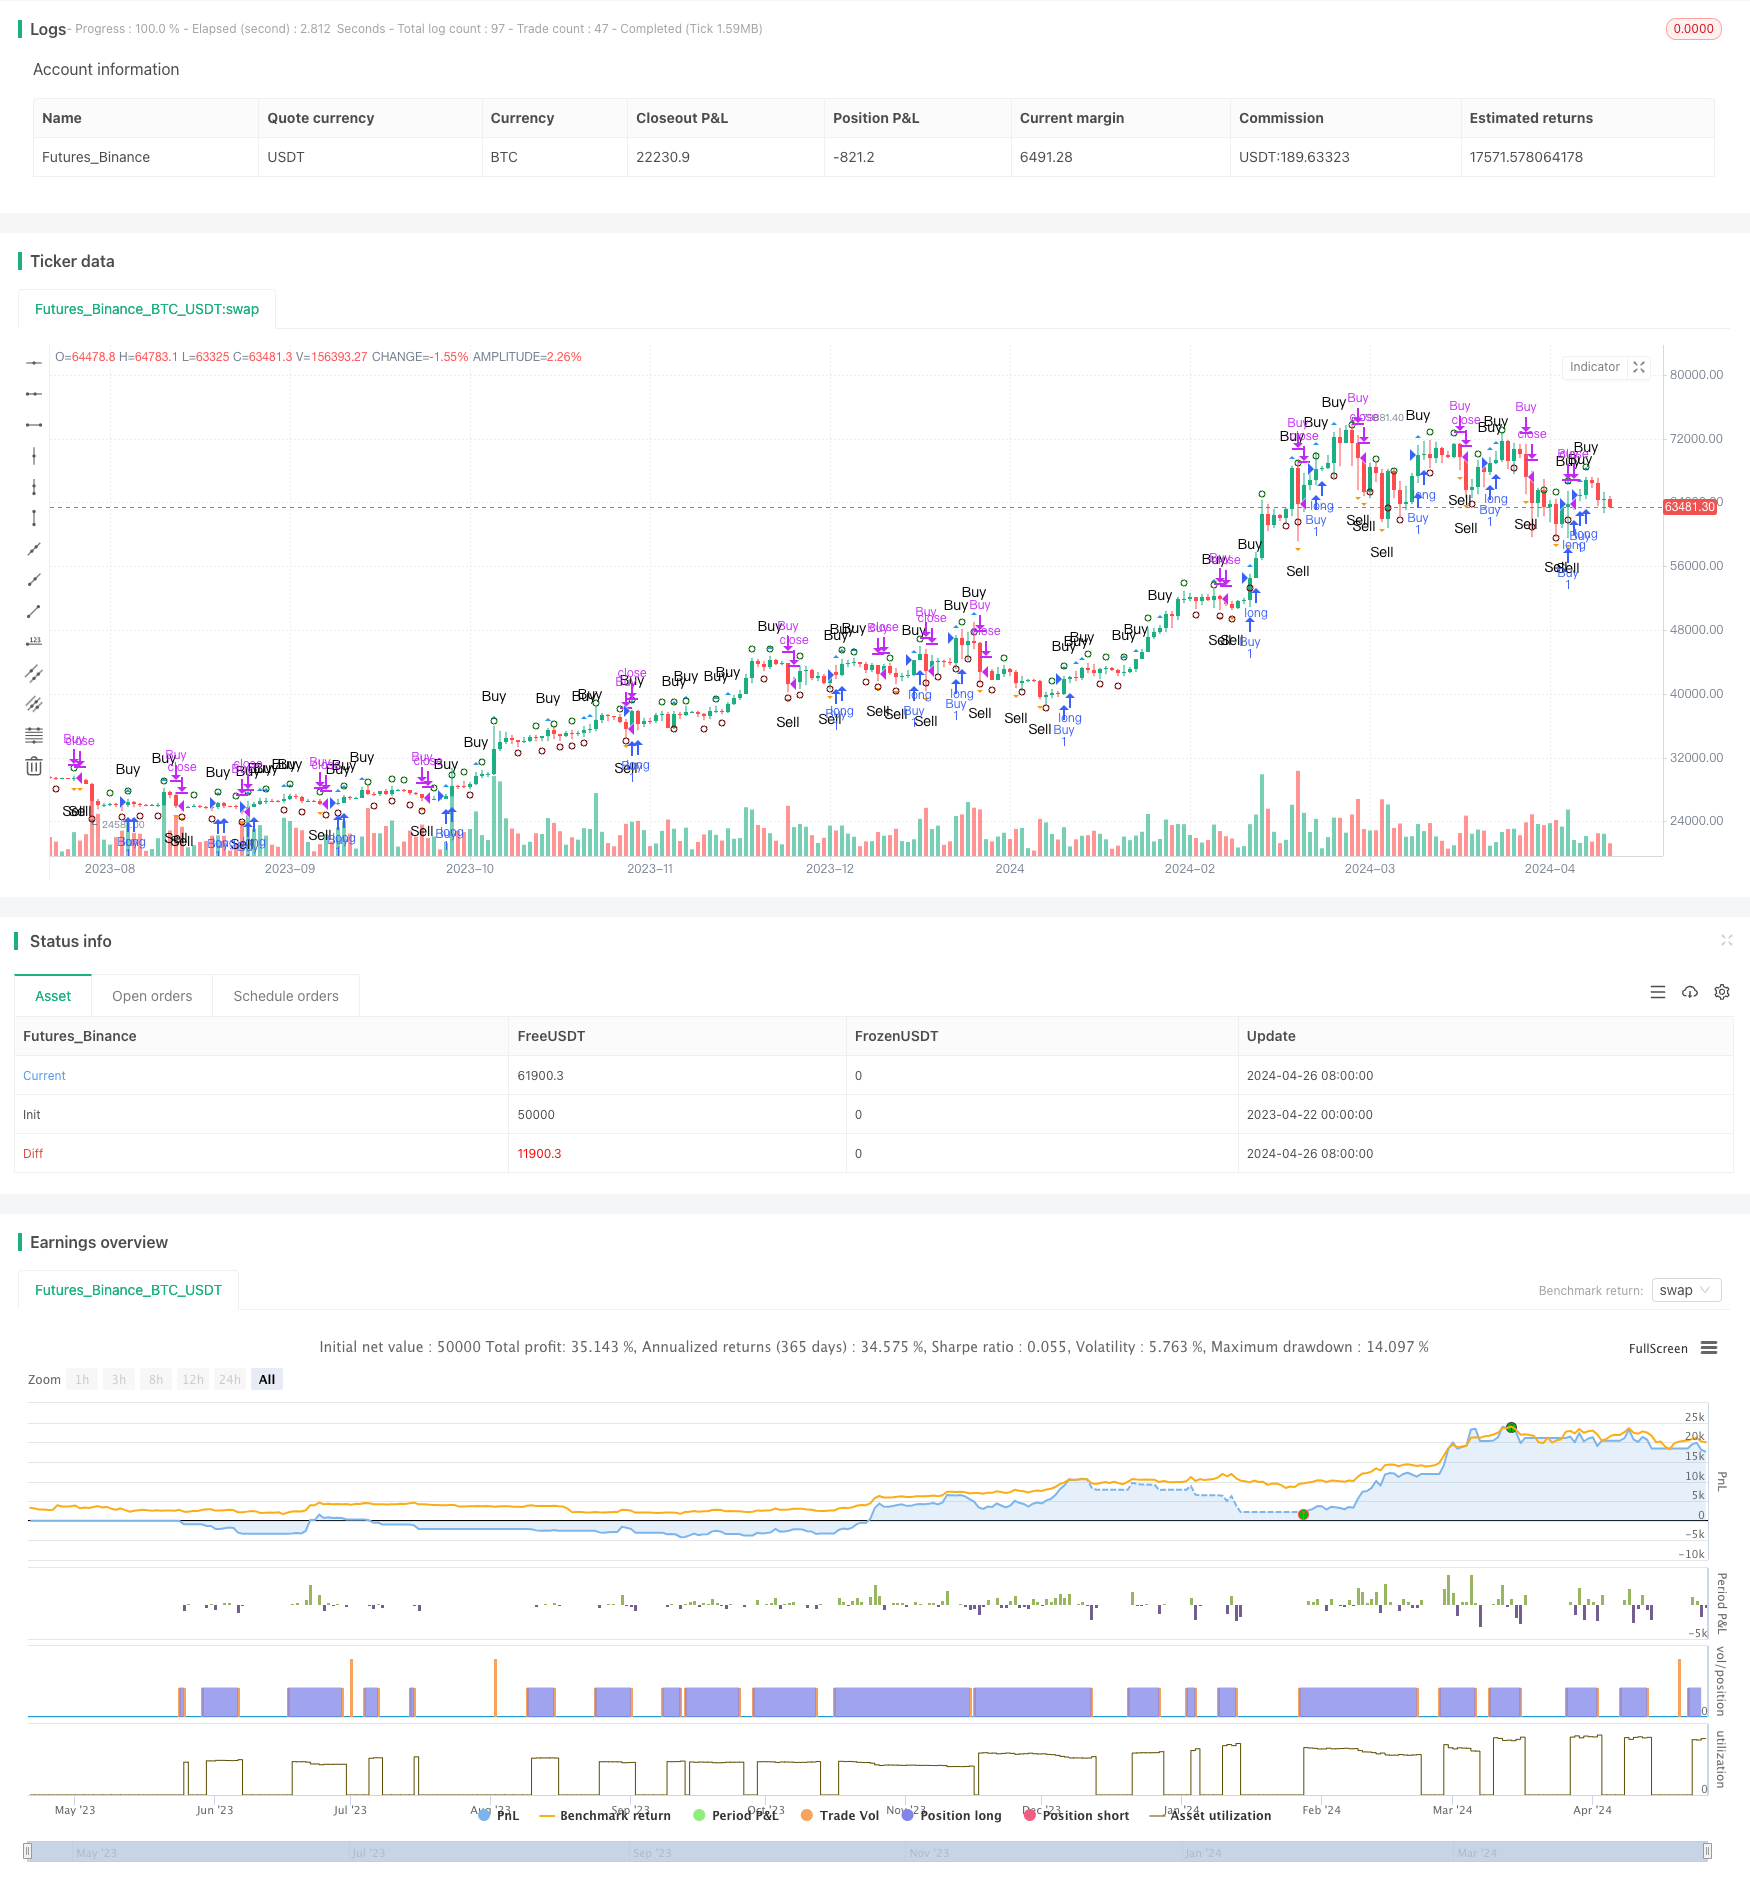
|
||
|
|
|
||
|
|
[trans]
|
||
|
|
#### 概述
|
||
|
|
GBS高低点确认策略是一个基于价格高低点变化来捕捉交易机会的策略。该策略通过识别特定的高点和低点形态,在高点突破时开仓做多,在低点跌破时平仓。该策略的主要思路是利用价格的波动规律,在相对高位开仓,在相对低位平仓,以此来获取价差收益。
|
||
|
|
|
||
|
|
#### 策略原理
|
||
|
|
该策略的核心是识别潜在的进场点和出场点。进场条件是当前高点低于前一个高点,且前一个高点高于前两个高点(high < high[1] and high[1] > high[2])。当该条件满足时,标记进场高点并在该水平画一条绿线。买入条件是存在已记录的进场高点(entryHigh),当前高点突破该水平且开盘价低于进场高点。
|
||
|
|
|
||
|
|
出场条件与进场条件类似,是当前低点高于前一个低点,且前一个低点低于前两个低点(low > low[1] and low[1] < low[2])。当该条件满足时,标记出场低点并在该水平画一条红线。卖出条件是存在已记录的出场低点(exitLow),当前低点跌破该水平且开盘价高于出场低点。
|
||
|
|
|
||
|
|
#### 策略优势
|
||
|
|
1. 该策略基于简单的价格高低点形态,易于理解和实现。
|
||
|
|
2. 通过在相对高位开仓和相对低位平仓,策略试图捕捉价格波动的中间部分,以获取价差收益。
|
||
|
|
3. 策略使用可视化的绘图工具,如进场和出场条件的小圆点以及买卖信号的三角形,使得策略的执行过程更加直观明了。
|
||
|
|
|
||
|
|
#### 策略风险
|
||
|
|
1. 该策略依赖于特定的高低点形态,但并非所有这样的形态都能够带来盈利机会,可能会出现错误信号。
|
||
|
|
2. 策略缺乏明确的止损机制,如果价格在开仓后出现急剧变化,可能会导致较大的损失。
|
||
|
|
3. 该策略未考虑交易成本和滑点,实际应用中这些因素可能会影响策略的整体表现。
|
||
|
|
|
||
|
|
#### 策略优化方向
|
||
|
|
1. 加入适当的止损和止盈机制,以控制单笔交易的风险敞口。
|
||
|
|
2. 考虑引入其他技术指标或过滤条件,如成交量、波动率等,以提高信号的可靠性。
|
||
|
|
3. 对策略参数进行优化,如调整确认高低点所需的时间窗口,以适应不同的市场状况。
|
||
|
|
4. 在实际应用前,对策略进行全面的回测和前向测试,并根据结果进行必要的调整。
|
||
|
|
|
||
|
|
#### 总结
|
||
|
|
GBS高低点确认策略是一个基于价格高低点形态的交易策略,通过识别特定的进场和出场条件来捕捉价差机会。该策略的优势在于其简单性和直观性,但同时也存在一些潜在的风险,如错误信号和缺乏风险控制措施。为进一步改进该策略,可以考虑引入止损止盈机制,结合其他技术指标,并对参数进行优化。在实际应用前,全面的回测和前向测试是必要的。
|
||
|
|
|
||
|
|
||
|
||
|
|
|
||
|
|
#### Overview
|
||
|
|
The GBS TOP BOTTOM Confirmed Strategy is a trading strategy that aims to capture trading opportunities based on changes in price highs and lows. The strategy identifies specific high and low point patterns, enters long positions when highs are breached, and closes positions when lows are breached. The main idea behind this strategy is to utilize the fluctuation patterns of prices, opening positions at relatively high levels and closing positions at relatively low levels, in order to capture price difference profits.
|
||
|
|
|
||
|
|
#### Strategy Principles
|
||
|
|
The core of this strategy is to identify potential entry and exit points. The entry condition is met when the current high is lower than the previous high, and the previous high is higher than the high before it (high < high[1] and high[1] > high[2]). When this condition is satisfied, the entry high is marked, and a green line is drawn at that level. The buy condition is triggered when there is a recorded entry high (entryHigh), and the current high breaks above that level while the opening price is below the entry high.
|
||
|
|
|
||
|
|
The exit condition is similar to the entry condition. It occurs when the current low is higher than the previous low, and the previous low is lower than the low before it (low > low[1] and low[1] < low[2]). When this condition is met, the exit low is marked, and a red line is drawn at that level. The sell condition is triggered when there is a recorded exit low (exitLow), and the current low falls below that level while the opening price is above the exit low.
|
||
|
|
|
||
|
|
#### Strategy Advantages
|
||
|
|
1. The strategy is based on simple price high and low patterns, making it easy to understand and implement.
|
||
|
|
2. By opening positions at relatively high levels and closing positions at relatively low levels, the strategy attempts to capture the middle portion of price fluctuations to obtain price difference profits.
|
||
|
|
3. The strategy employs visual plotting tools, such as small dots for entry and exit conditions and triangles for buy and sell signals, making the execution process more intuitive and clear.
|
||
|
|
|
||
|
|
#### Strategy Risks
|
||
|
|
1. The strategy relies on specific high and low point patterns, but not all such patterns lead to profitable opportunities, and false signals may occur.
|
||
|
|
2. The strategy lacks a clear stop-loss mechanism. If prices experience sharp changes after opening a position, it may result in significant losses.
|
||
|
|
3. The strategy does not consider trading costs and slippage, which can impact the overall performance of the strategy in real-world applications.
|
||
|
|
|
||
|
|
#### Strategy Optimization Directions
|
||
|
|
1. Incorporate appropriate stop-loss and take-profit mechanisms to control the risk exposure of individual trades.
|
||
|
|
2. Consider introducing other technical indicators or filtering conditions, such as trading volume and volatility, to improve signal reliability.
|
||
|
|
3. Optimize strategy parameters, such as adjusting the time window required for confirming highs and lows, to adapt to different market conditions.
|
||
|
|
4. Conduct thorough backtesting and forward testing before actual application, and make necessary adjustments based on the results.
|
||
|
|
|
||
|
|
#### Summary
|
||
|
|
The GBS TOP BOTTOM Confirmed Strategy is a trading strategy based on price high and low point patterns. It aims to capture price difference opportunities by identifying specific entry and exit conditions. The strategy's advantages lie in its simplicity and intuitiveness, but it also carries potential risks, such as false signals and the lack of risk control measures. To further improve the strategy, one can consider introducing stop-loss and take-profit mechanisms, combining other technical indicators, and optimizing parameters. Comprehensive backtesting and forward testing are essential before actual application.
|
||
|
|
[/trans]
|
||
|
|
|
||
|
|
|
||
|
|
|
||
|
|
> Source (PineScript)
|
||
|
|
|
||
|
|
``` pinescript
|
||
|
|
/*backtest
|
||
|
|
start: 2023-04-22 00:00:00
|
||
|
|
end: 2024-04-27 00:00:00
|
||
|
|
period: 1d
|
||
|
|
basePeriod: 1h
|
||
|
|
exchanges: [{"eid":"Futures_Binance","currency":"BTC_USDT"}]
|
||
|
|
*/
|
||
|
|
|
||
|
|
//@version=5
|
||
|
|
strategy("GBS TOP BOTTOM Confirmed", overlay=true)
|
||
|
|
|
||
|
|
// Entry condition
|
||
|
|
var float entryHigh = na
|
||
|
|
var line entryLine = na
|
||
|
|
entryCondition = high < high[1] and high[1] > high[2]
|
||
|
|
if (entryCondition)
|
||
|
|
entryHigh := high[1]
|
||
|
|
// entryLine := line.new(bar_index - 1, entryHigh, bar_index + 10, entryHigh, color=color.green)
|
||
|
|
|
||
|
|
// Buy condition based on nearest entry
|
||
|
|
buyCondition = not na(entryHigh) and high > entryHigh and open < entryHigh
|
||
|
|
|
||
|
|
// Exit condition
|
||
|
|
var float exitLow = na
|
||
|
|
var line exitLine = na
|
||
|
|
exitCondition = low > low[1] and low[1] < low[2]
|
||
|
|
if (exitCondition)
|
||
|
|
exitLow := low[1]
|
||
|
|
// exitLine := line.new(bar_index - 1, exitLow, bar_index + 10, exitLow, color=color.red)
|
||
|
|
|
||
|
|
// Sell condition based on nearest exit
|
||
|
|
sellCondition = not na(exitLow) and low < exitLow and open > exitLow
|
||
|
|
|
||
|
|
// Strategy logic
|
||
|
|
strategy.entry("Buy", strategy.long, when = buyCondition)
|
||
|
|
strategy.close("Buy", when = sellCondition)
|
||
|
|
|
||
|
|
// Plot tiny dot above high[1] for entry condition
|
||
|
|
plotshape(series=entryCondition, title="Entry Dot", color=color.rgb(3, 99, 5), style=shape.circle, size=size.tiny, location=location.abovebar, offset=-1)
|
||
|
|
|
||
|
|
// Plot tiny dot below low[1] for exit condition
|
||
|
|
plotshape(series=exitCondition, title="Exit Dot", color=color.rgb(107, 3, 3), style=shape.circle, size=size.tiny, location=location.belowbar, offset=-1)
|
||
|
|
|
||
|
|
// Plot buy and sell signals
|
||
|
|
plotshape(series=buyCondition, title="Buy Signal", color=color.blue, style=shape.triangleup, size=size.small, location=location.abovebar, text="Buy")
|
||
|
|
plotshape(series=sellCondition, title="Sell Signal", color=color.orange, style=shape.triangledown, size=size.small, location=location.belowbar, text="Sell")
|
||
|
|
|
||
|
|
```
|
||
|
|
|
||
|
|
> Detail
|
||
|
|
|
||
|
|
https://www.fmz.com/strategy/449724
|
||
|
|
|
||
|
|
> Last Modified
|
||
|
|
|
||
|
|
2024-04-28 14:42:02
|