155 lines
10 KiB
Markdown
155 lines
10 KiB
Markdown

|
|
||
|
|
> Name
|
||
|
|
|
||
|
|
G-Channel与EMA结合的趋势跟踪策略G-Channel-and-EMA-Trend-Following-Strategy
|
||
|
|
|
||
|
|
> Author
|
||
|
|
|
||
|
|
ChaoZhang
|
||
|
|
|
||
|
|
> Strategy Description
|
||
|
|
|
||
|
|
|
||
|
|
[trans]
|
||
|
|
|
||
|
|
## 概述
|
||
|
|
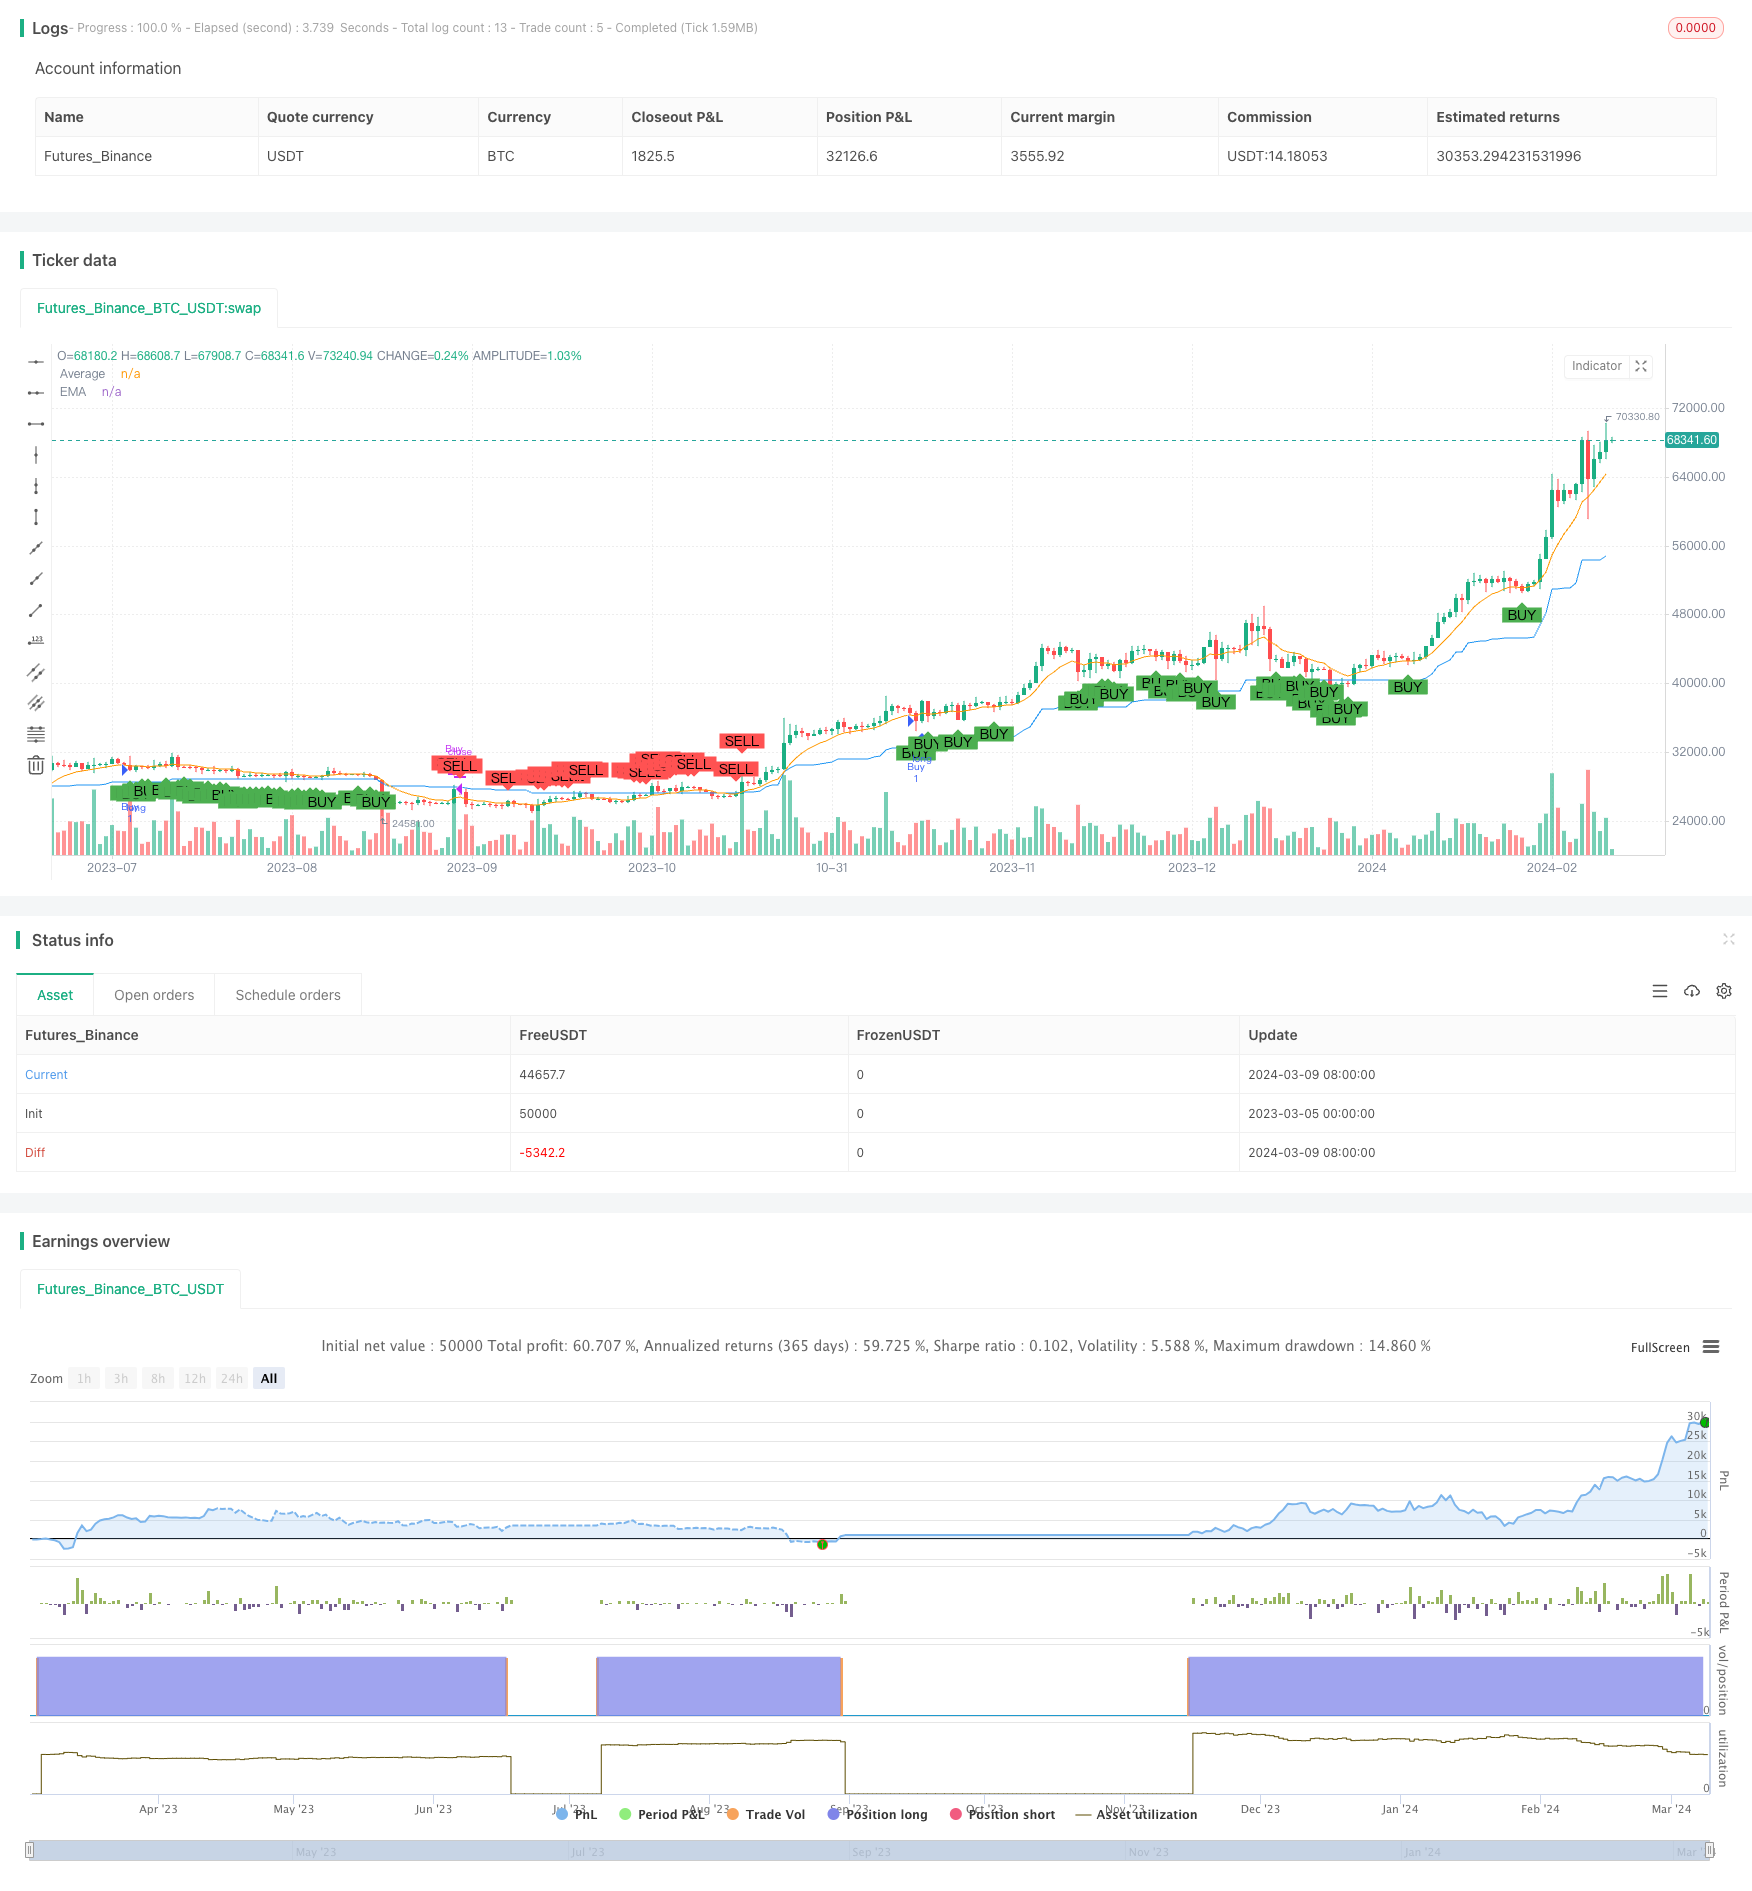
本文介绍了一个基于G-Channel指标和指数移动平均线(EMA)的趋势跟踪交易策略。该策略利用G-Channel指标判断当前市场趋势方向,并结合EMA指标的穿越来产生买卖信号。这个策略的主要思想是在上涨趋势中价格回调到EMA附近时买入,在下跌趋势中价格反弹到EMA附近时卖出,从而捕捉主要的价格趋势。
|
||
|
|
|
||
|
|
## 策略原理
|
||
|
|
该策略的核心是G-Channel指标,该指标由Andrew Guppy首次提出,旨在判断当前价格走势的趋势方向。G-Channel指标由一条上轨、一条下轨和一条平均线组成。其中上轨连接近期价格的最高点,下轨连接近期价格的最低点,平均线是上下轨的算术平均。
|
||
|
|
|
||
|
|
当收盘价向上突破上轨时,意味着开始形成上升趋势;当收盘价向下突破下轨时,意味着开始形成下降趋势。该策略使用 ```barssince()```函数来计算最近一次向上突破和向下突破分别发生在多少根K线之前,两者中发生在最近的那个方向就是当前的趋势方向。
|
||
|
|
|
||
|
|
EMA是一种趋势跟踪指标,相比简单移动平均线,它的权重分布更倾向于近期价格,因此对价格变化的反应更加敏感。在上升趋势中,EMA往往位于价格下方,起到支撑作用;在下降趋势中,EMA往往位于价格上方,起到压力作用。
|
||
|
|
|
||
|
|
该策略的交易逻辑如下:
|
||
|
|
- 当G-Channel指标显示当前处于上升趋势,且收盘价向下穿越EMA时产生买入信号,此时价格很可能经过回调后继续向上运行。
|
||
|
|
- 当G-Channel指标显示当前处于下降趋势,且收盘价向上穿越EMA时产生卖出信号,此时价格很可能经过反弹后继续向下运行。
|
||
|
|
|
||
|
|
## 优势分析
|
||
|
|
1. 趋势跟踪能力强:G-Channel指标能够敏锐地捕捉到价格趋势的变化,避免在震荡市做出错误的判断。配合EMA这样的趋势型指标,可进一步提高趋势把握的准确性。
|
||
|
|
2. 适应性强:该策略对于任何品种、任何周期都可以良好适应。不管是股票、期货、外汇,还是数字货币,都可以运用该策略进行交易。
|
||
|
|
3. 参数优化空间大:包括G-Channel的观测周期、EMA的参数等,都可以根据不同市场特征和投资者偏好进行灵活调整,使策略更具针对性。
|
||
|
|
|
||
|
|
## 风险分析
|
||
|
|
1. 趋势转折风险:该策略在趋势转折初期可能会出现较大的回撤。比如G-Channel指标已经显示趋势开始反转,但EMA信号可能有一定滞后,造成账户损失。
|
||
|
|
2. 参数设置风险:不恰当的参数设置会导致趋势判断偏差,从而产生错误的交易信号。策略参数需要根据回测进行优化,并定期复核。
|
||
|
|
3. 黑天鹅事件:极端行情下该策略可能失效。比如受到重大利空打击,价格快速下跌并长期偏离均线时,该策略可能错过最佳的出场时机。
|
||
|
|
|
||
|
|
## 优化方向
|
||
|
|
1. 引入更多辅助指标:在EMA之外,可以结合布林带、MACD等其他趋势型指标,提高信号的可靠性。
|
||
|
|
2. 优化仓位管理:根据趋势的强弱、价格距离均线位置的远近,动态调整仓位,在控制风险的同时提高盈利能力。
|
||
|
|
3. 结合市场情绪指标:比如融入VIX恐慌指数、Put/Call Ratio等反映市场情绪的指标数据,在极端情况下及时止损或获利了结。
|
||
|
|
|
||
|
|
## 总结
|
||
|
|
本文介绍了一个基于G-Channel指标和EMA指标的趋势跟踪策略。该策略利用G-Channel准确判断当前市场趋势方向,并在趋势中利用价格对EMA的穿越来捕捉买卖机会。策略优势在于趋势跟踪能力强、适应性广,但同时也要警惕趋势转折、参数设置不当以及黑天鹅事件带来的风险。未来可以通过引入更多辅助指标、优化仓位管理、结合市场情绪指标等方式,进一步提升该策略的稳健性和盈利能力。总的来说,该策略思路清晰,原理简单易懂,适合进行二次开发和实盘应用,值得量化交易者参考和学习。
|
||
|
|
|
||
|
|
||
|
||
|
|
|
||
|
|
## Overview
|
||
|
|
This article introduces a trend-following trading strategy based on the G-Channel indicator and the Exponential Moving Average (EMA). The strategy uses the G-Channel indicator to determine the current market trend direction and generates buy/sell signals based on crossovers with the EMA. The main idea is to buy when the price pulls back to the EMA during an uptrend and sell when the price rebounds to the EMA during a downtrend, thereby capturing the primary price trends.
|
||
|
|
|
||
|
|
## Strategy Principles
|
||
|
|
The core of this strategy is the G-Channel indicator, first proposed by Andrew Guppy to identify the current trend direction of price movements. The G-Channel consists of an upper band, a lower band, and an average line. The upper band connects the highest price points of the recent period, the lower band connects the lowest price points, and the average line is the arithmetic mean of the upper and lower bands.
|
||
|
|
|
||
|
|
When the closing price breaks above the upper band, it signifies the start of an uptrend; when it breaks below the lower band, it signifies the start of a downtrend. The strategy uses the ```barssince()``` function to calculate how many bars ago the most recent upward and downward breakouts occurred. The direction that occurred more recently is considered the current trend direction.
|
||
|
|
|
||
|
|
The EMA is a trend-following indicator that places more weight on recent prices compared to a simple moving average, making it more responsive to price changes. In an uptrend, the EMA often acts as support below the price; in a downtrend, it often acts as resistance above the price.
|
||
|
|
|
||
|
|
The trading logic of this strategy is as follows:
|
||
|
|
- When the G-Channel indicates a current uptrend and the closing price crosses below the EMA, a buy signal is generated. The price is likely to continue upward after a pullback.
|
||
|
|
- When the G-Channel indicates a current downtrend and the closing price crosses above the EMA, a sell signal is generated. The price is likely to continue downward after a rebound.
|
||
|
|
|
||
|
|
## Advantage Analysis
|
||
|
|
1. Strong trend-following capability: The G-Channel indicator can acutely capture changes in price trends, avoiding misjudgments in sideways markets. Combined with a trend-following indicator like EMA, it further improves the accuracy of trend identification.
|
||
|
|
2. High adaptability: The strategy can be well-adapted to any asset class and timeframe, whether stocks, futures, forex, or cryptocurrencies.
|
||
|
|
3. Large room for parameter optimization: Parameters such as the observation period of G-Channel and the EMA settings can be flexibly adjusted according to different market characteristics and investor preferences for more targeted strategies.
|
||
|
|
|
||
|
|
## Risk Analysis
|
||
|
|
1. Trend reversal risk: The strategy may experience significant drawdowns in the early stages of a trend reversal. For example, the G-Channel may already indicate a trend reversal, but the EMA signal may lag, causing account losses.
|
||
|
|
2. Parameter setting risk: Improper parameter settings can lead to deviations in trend judgment and incorrect trading signals. Strategy parameters need to be optimized based on backtesting and periodically reviewed.
|
||
|
|
3. Black swan events: The strategy may fail in extreme market conditions. For example, if prices plunge rapidly and deviate from moving averages for an extended period due to a major bearish shock, the strategy may miss the best exit timing.
|
||
|
|
|
||
|
|
## Optimization Directions
|
||
|
|
1. Introduce more auxiliary indicators: In addition to EMA, combine with other trend indicators like Bollinger Bands and MACD to improve signal reliability.
|
||
|
|
2. Optimize position management: Dynamically adjust positions based on trend strength and the price distance from moving averages to improve profitability while controlling risk.
|
||
|
|
3. Incorporate market sentiment indicators: Integrate indicators reflecting market sentiment, such as the VIX panic index and Put/Call Ratio, to cut losses or take profits in a timely manner during extreme situations.
|
||
|
|
|
||
|
|
## Summary
|
||
|
|
This article introduced a trend-following strategy based on the G-Channel and EMA indicators. The strategy uses G-Channel to accurately determine the current market trend direction and captures buying and selling opportunities based on price crossovers with EMA within the trend. The strategy's advantages lie in its strong trend-following capability and wide adaptability, but one must also be wary of risks from trend reversals, improper parameter settings, and black swan events. In the future, the strategy's robustness and profitability could be further enhanced by introducing more auxiliary indicators, optimizing position management, and incorporating market sentiment indicators. Overall, the strategy has a clear logic, simple and easy-to-understand principles, and is suitable for secondary development and live trading. It is worthy of reference and study by quantitative traders.
|
||
|
|
[/trans]
|
||
|
|
|
||
|
|
> Strategy Arguments
|
||
|
|
|
||
|
|
|
||
|
|
|
||
|
|
|Argument|Default|Description|
|
||
|
|
|----|----|----|
|
||
|
|
|v_input_1|100|length|
|
||
|
|
|v_input_2_close|0|src: close|high|low|open|hl2|hlc3|hlcc4|ohlc4|
|
||
|
|
|v_input_3|9|EMA Length|
|
||
|
|
|
||
|
|
|
||
|
|
> Source (PineScript)
|
||
|
|
|
||
|
|
``` pinescript
|
||
|
|
/*backtest
|
||
|
|
start: 2023-03-05 00:00:00
|
||
|
|
end: 2024-03-10 00:00:00
|
||
|
|
period: 1d
|
||
|
|
basePeriod: 1h
|
||
|
|
exchanges: [{"eid":"Futures_Binance","currency":"BTC_USDT"}]
|
||
|
|
*/
|
||
|
|
|
||
|
|
// This Pine Script™ code is subject to the terms of the Mozilla Public License 2.0 at https://mozilla.org/MPL/2.0/
|
||
|
|
// © jonathan_422
|
||
|
|
|
||
|
|
//@version=4
|
||
|
|
strategy("G-Channel and EMA Strategy", shorttitle="G-EMA Strategy", overlay=true)
|
||
|
|
|
||
|
|
// G-Channel settings
|
||
|
|
length = input(100)
|
||
|
|
src = input(close)
|
||
|
|
|
||
|
|
// Calculating G-Channel
|
||
|
|
a = 0.0
|
||
|
|
b = 0.0
|
||
|
|
a := max(src, nz(a[1])) - nz(a[1] - b[1]) / length
|
||
|
|
b := min(src, nz(b[1])) + nz(a[1] - b[1]) / length
|
||
|
|
avg = avg(a, b)
|
||
|
|
|
||
|
|
// EMA settings
|
||
|
|
emaLength = input(9, title="EMA Length")
|
||
|
|
ema = ema(close, emaLength)
|
||
|
|
|
||
|
|
// G-Channel buy/sell signals
|
||
|
|
crossup = b[1] < close[1] and b > close
|
||
|
|
crossdn = a[1] < close[1] and a > close
|
||
|
|
bullish = barssince(crossdn) <= barssince(crossup)
|
||
|
|
|
||
|
|
// Strategy logic
|
||
|
|
buySignal = bullish and close < ema
|
||
|
|
sellSignal = not bullish and close > ema
|
||
|
|
|
||
|
|
// Plotting
|
||
|
|
plot(ema, "EMA", color=color.orange)
|
||
|
|
plot(avg, "Average", color=color.blue)
|
||
|
|
|
||
|
|
// Plot buy/sell signals
|
||
|
|
plotshape(buySignal, title="Buy Signal", location=location.belowbar, color=color.green, style=shape.labelup, text="BUY")
|
||
|
|
plotshape(sellSignal, title="Sell Signal", location=location.abovebar, color=color.red, style=shape.labeldown, text="SELL")
|
||
|
|
|
||
|
|
// Strategy execution
|
||
|
|
strategy.entry("Buy", strategy.long, when=buySignal)
|
||
|
|
strategy.close("Buy", when=sellSignal)
|
||
|
|
|
||
|
|
```
|
||
|
|
|
||
|
|
> Detail
|
||
|
|
|
||
|
|
https://www.fmz.com/strategy/444341
|
||
|
|
|
||
|
|
> Last Modified
|
||
|
|
|
||
|
|
2024-03-11 11:08:06
|