241 lines
10 KiB
Markdown
241 lines
10 KiB
Markdown

|
|
||
|
|
> Name
|
||
|
|
|
||
|
|
EMA交叉指示双重止盈止损策略-EMA-Crossover-with-Dual-Take-Profit-and-Stop-Loss-Strategy
|
||
|
|
|
||
|
|
> Author
|
||
|
|
|
||
|
|
ChaoZhang
|
||
|
|
|
||
|
|
> Strategy Description
|
||
|
|
|
||
|
|
|
||
|
|
|
||
|
|
[trans]
|
||
|
|
#### 概述
|
||
|
|
|
||
|
|
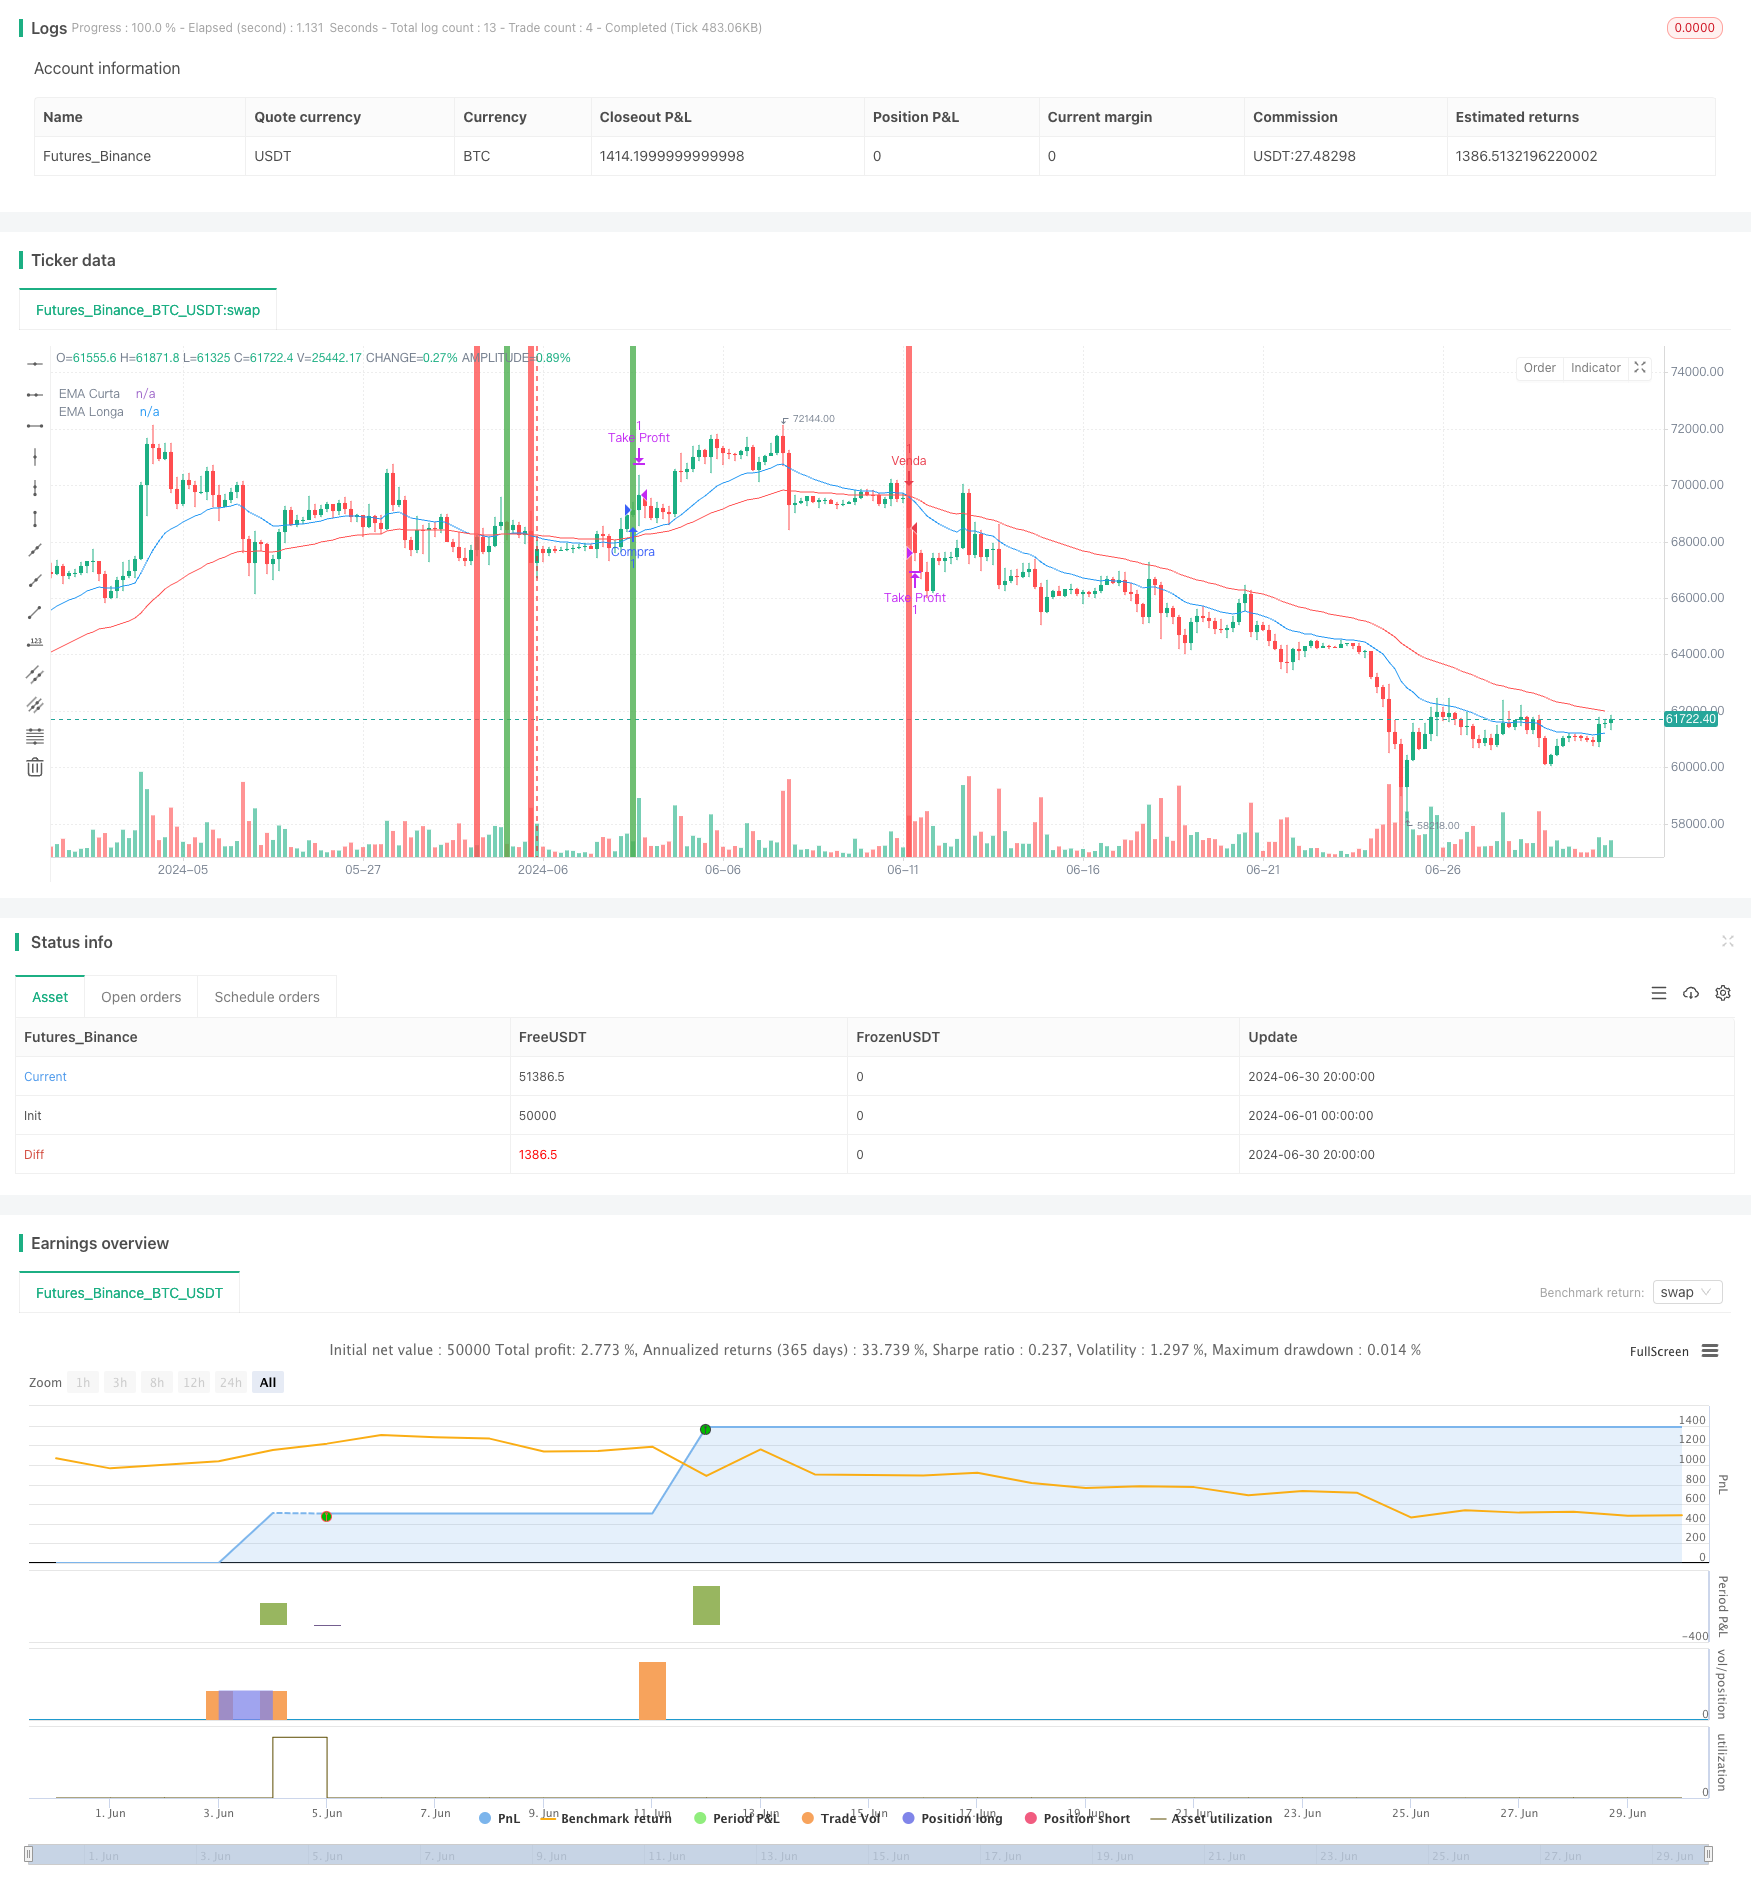
EMA交叉指示双重止盈止损策略是一种结合了均线交叉信号和动态风险管理的量化交易策略。该策略利用短期和长期指数移动平均线(EMA)的交叉来生成入场信号,同时采用固定和动态相结合的止盈止损机制来管理风险和锁定利润。这种方法旨在捕捉市场趋势,同时通过灵活的风险控制来保护交易资金。
|
||
|
|
|
||
|
|
#### 策略原理
|
||
|
|
|
||
|
|
1. 信号生成:
|
||
|
|
- 使用20周期和50周期的指数移动平均线(EMA)
|
||
|
|
- 当短期EMA上穿长期EMA时,触发做多信号
|
||
|
|
- 当短期EMA下穿长期EMA时,触发做空信号
|
||
|
|
|
||
|
|
2. 风险管理:
|
||
|
|
- 初始止盈设置为入场价格的200个点位
|
||
|
|
- 初始止损设置为长期EMA的100个点位之外
|
||
|
|
- 随着价格移动,止损水平会相应调整,始终保持在长期EMA的100个点位之外
|
||
|
|
|
||
|
|
3. 交易执行:
|
||
|
|
- 使用strategy.entry函数执行买入和卖出操作
|
||
|
|
- 使用strategy.exit函数根据止盈和止损水平平仓
|
||
|
|
|
||
|
|
4. 可视化:
|
||
|
|
- 在图表上绘制短期和长期EMA线
|
||
|
|
- 使用背景颜色来标示买入(绿色)和卖出(红色)信号
|
||
|
|
|
||
|
|
#### 策略优势
|
||
|
|
|
||
|
|
1. 趋势跟随:通过EMA交叉捕捉市场趋势,有助于在强劲趋势中获利。
|
||
|
|
|
||
|
|
2. 动态风险管理:止损水平随长期EMA移动,适应市场变化,提供更好的风险保护。
|
||
|
|
|
||
|
|
3. 固定止盈:200点的固定止盈有助于在趋势反转前锁定利润。
|
||
|
|
|
||
|
|
4. 可视化辅助:EMA线和背景颜色提供直观的交易信号,便于分析和决策。
|
||
|
|
|
||
|
|
5. 参数可调:关键参数如EMA周期、止盈止损点数等可根据不同市场和个人偏好进行调整。
|
||
|
|
|
||
|
|
6. 全自动化:策略完全自动化,减少人为干预和情绪影响。
|
||
|
|
|
||
|
|
#### 策略风险
|
||
|
|
|
||
|
|
1. 震荡市场风险:在横盘或震荡市场中,频繁的EMA交叉可能导致连续亏损。
|
||
|
|
|
||
|
|
2. 滑点风险:在高波动性市场中,实际执行价格可能与理想价格存在较大偏差。
|
||
|
|
|
||
|
|
3. 固定止盈限制:200点的固定止盈可能在强势趋势中过早平仓,错失更多利润。
|
||
|
|
|
||
|
|
4. 回撤风险:100点的止损可能在某些情况下不足以有效控制风险,导致较大回撤。
|
||
|
|
|
||
|
|
5. 过度依赖EMA:单一依赖EMA可能忽视其他重要的市场信息和指标。
|
||
|
|
|
||
|
|
#### 策略优化方向
|
||
|
|
|
||
|
|
1. 多指标融合:结合其他技术指标如RSI、MACD等,提高信号的准确性和可靠性。
|
||
|
|
|
||
|
|
2. 自适应参数:根据市场波动性动态调整EMA周期和止盈止损点数,以适应不同市场环境。
|
||
|
|
|
||
|
|
3. 引入成交量分析:考虑成交量因素,提高趋势判断的准确性和交易时机的把握。
|
||
|
|
|
||
|
|
4. 时间过滤:增加交易时间过滤,避免在市场低流动性时段进行交易。
|
||
|
|
|
||
|
|
5. 改进止盈机制:引入追踪止盈,在保护利润的同时允许利润继续增长。
|
||
|
|
|
||
|
|
6. 风险管理优化:根据账户规模和风险偏好,动态调整每笔交易的资金比例。
|
||
|
|
|
||
|
|
7. 增加市场情绪分析:引入市场情绪指标,以更好地判断市场趋势和潜在反转。
|
||
|
|
|
||
|
|
#### 总结
|
||
|
|
|
||
|
|
EMA交叉指示双重止盈止损策略是一种结合了技术分析和风险管理的量化交易方法。通过利用EMA交叉信号和动态止损机制,该策略旨在捕捉市场趋势并控制风险。虽然策略在趋势市场中表现良好,但在震荡市场中可能面临挑战。通过多指标融合、参数优化和改进风险管理等方式,该策略有潜力进一步提高其性能和适应性。交易者在使用此策略时,应当充分了解其优势和局限性,并根据个人风险承受能力和市场环境进行适当调整。
|
||
|
|
|
||
|
|
||
|
||
|
|
|
||
|
|
#### Overview
|
||
|
|
|
||
|
|
The EMA Crossover with Dual Take Profit and Stop Loss Strategy is a quantitative trading approach that combines moving average crossover signals with dynamic risk management. This strategy utilizes the crossover of short-term and long-term Exponential Moving Averages (EMAs) to generate entry signals, while employing a combination of fixed and dynamic take profit and stop loss mechanisms to manage risk and secure profits. This method aims to capture market trends while protecting trading capital through flexible risk control.
|
||
|
|
|
||
|
|
#### Strategy Principles
|
||
|
|
|
||
|
|
1. Signal Generation:
|
||
|
|
- Uses 20-period and 50-period Exponential Moving Averages (EMAs)
|
||
|
|
- Triggers a long entry when the short-term EMA crosses above the long-term EMA
|
||
|
|
- Triggers a short entry when the short-term EMA crosses below the long-term EMA
|
||
|
|
|
||
|
|
2. Risk Management:
|
||
|
|
- Initial take profit set at 200 pips from entry price
|
||
|
|
- Initial stop loss set at 100 pips beyond the long-term EMA
|
||
|
|
- Stop loss level adjusts as price moves, maintaining a 100-pip distance from the long-term EMA
|
||
|
|
|
||
|
|
3. Trade Execution:
|
||
|
|
- Uses strategy.entry function to execute buy and sell operations
|
||
|
|
- Uses strategy.exit function to close positions based on take profit and stop loss levels
|
||
|
|
|
||
|
|
4. Visualization:
|
||
|
|
- Plots short-term and long-term EMA lines on the chart
|
||
|
|
- Uses background color to indicate buy (green) and sell (red) signals
|
||
|
|
|
||
|
|
#### Strategy Advantages
|
||
|
|
|
||
|
|
1. Trend Following: Captures market trends through EMA crossovers, beneficial in strong trending markets.
|
||
|
|
|
||
|
|
2. Dynamic Risk Management: Stop loss level moves with the long-term EMA, adapting to market changes and providing better risk protection.
|
||
|
|
|
||
|
|
3. Fixed Take Profit: 200-pip fixed take profit helps secure gains before trend reversals.
|
||
|
|
|
||
|
|
4. Visual Aids: EMA lines and background colors provide intuitive trading signals, facilitating analysis and decision-making.
|
||
|
|
|
||
|
|
5. Adjustable Parameters: Key parameters such as EMA periods, take profit, and stop loss pips can be adjusted for different markets and personal preferences.
|
||
|
|
|
||
|
|
6. Fully Automated: The strategy is completely automated, reducing human intervention and emotional influences.
|
||
|
|
|
||
|
|
#### Strategy Risks
|
||
|
|
|
||
|
|
1. Choppy Market Risk: In sideways or choppy markets, frequent EMA crossovers may lead to consecutive losses.
|
||
|
|
|
||
|
|
2. Slippage Risk: In highly volatile markets, actual execution prices may significantly differ from ideal prices.
|
||
|
|
|
||
|
|
3. Fixed Take Profit Limitation: The 200-pip fixed take profit might close positions too early in strong trends, missing out on potential profits.
|
||
|
|
|
||
|
|
4. Drawdown Risk: The 100-pip stop loss might not be sufficient to effectively control risk in some situations, leading to larger drawdowns.
|
||
|
|
|
||
|
|
5. Over-reliance on EMAs: Sole dependence on EMAs may overlook other important market information and indicators.
|
||
|
|
|
||
|
|
#### Strategy Optimization Directions
|
||
|
|
|
||
|
|
1. Multi-Indicator Integration: Combine with other technical indicators like RSI, MACD, etc., to improve signal accuracy and reliability.
|
||
|
|
|
||
|
|
2. Adaptive Parameters: Dynamically adjust EMA periods and take profit/stop loss pips based on market volatility to adapt to different market environments.
|
||
|
|
|
||
|
|
3. Incorporate Volume Analysis: Consider volume factors to improve trend judgment accuracy and timing of trades.
|
||
|
|
|
||
|
|
4. Time Filtering: Add trading time filters to avoid trading during low liquidity market sessions.
|
||
|
|
|
||
|
|
5. Improve Take Profit Mechanism: Introduce trailing take profit to protect profits while allowing for continued growth.
|
||
|
|
|
||
|
|
6. Risk Management Optimization: Dynamically adjust the proportion of funds for each trade based on account size and risk preference.
|
||
|
|
|
||
|
|
7. Add Market Sentiment Analysis: Incorporate market sentiment indicators for better judgment of market trends and potential reversals.
|
||
|
|
|
||
|
|
#### Conclusion
|
||
|
|
|
||
|
|
The EMA Crossover with Dual Take Profit and Stop Loss Strategy is a quantitative trading method that combines technical analysis with risk management. By leveraging EMA crossover signals and dynamic stop loss mechanisms, this strategy aims to capture market trends while controlling risk. While the strategy performs well in trending markets, it may face challenges in choppy conditions. Through multi-indicator integration, parameter optimization, and improved risk management, the strategy has the potential to further enhance its performance and adaptability. Traders using this strategy should fully understand its strengths and limitations, and make appropriate adjustments based on individual risk tolerance and market conditions.
|
||
|
|
|
||
|
|
[/trans]
|
||
|
|
|
||
|
|
|
||
|
|
|
||
|
|
> Source (PineScript)
|
||
|
|
|
||
|
|
``` pinescript
|
||
|
|
/*backtest
|
||
|
|
start: 2024-06-01 00:00:00
|
||
|
|
end: 2024-06-30 23:59:59
|
||
|
|
period: 4h
|
||
|
|
basePeriod: 15m
|
||
|
|
exchanges: [{"eid":"Futures_Binance","currency":"BTC_USDT"}]
|
||
|
|
*/
|
||
|
|
|
||
|
|
//@version=5
|
||
|
|
strategy("Estratégia com Médias Móveis", overlay=true)
|
||
|
|
|
||
|
|
// Parâmetros das médias móveis
|
||
|
|
ema_short_length = input.int(20, title="EMA Curta")
|
||
|
|
ema_long_length = input.int(50, title="EMA Longa")
|
||
|
|
tp_pips = input.int(200, title="Take Profit em Pips")
|
||
|
|
sl_pips = input.int(100, title="Stop Loss em Pips")
|
||
|
|
|
||
|
|
// Cálculo das médias móveis
|
||
|
|
ema_short = ta.ema(close, ema_short_length)
|
||
|
|
ema_long = ta.ema(close, ema_long_length)
|
||
|
|
|
||
|
|
// Definição do Take Profit e Stop Loss iniciais em pips
|
||
|
|
pip_size = syminfo.mintick
|
||
|
|
initial_take_profit_buy = tp_pips * pip_size
|
||
|
|
initial_take_profit_sell = tp_pips * pip_size
|
||
|
|
initial_stop_loss_buy = ema_long - sl_pips * pip_size
|
||
|
|
initial_stop_loss_sell = ema_long + sl_pips * pip_size
|
||
|
|
|
||
|
|
// Variáveis para controle de SL e TP móveis
|
||
|
|
var float stop_loss_level = na
|
||
|
|
var float take_profit_level = na
|
||
|
|
|
||
|
|
// Condições para Compra e Venda
|
||
|
|
buy_condition = ta.crossover(ema_short, ema_long)
|
||
|
|
sell_condition = ta.crossunder(ema_short, ema_long)
|
||
|
|
|
||
|
|
// Atualização do Stop Loss Móvel e Take Profit Móvel
|
||
|
|
if (buy_condition)
|
||
|
|
stop_loss_level := ema_long - sl_pips * pip_size
|
||
|
|
take_profit_level := close + initial_take_profit_buy
|
||
|
|
|
||
|
|
if (sell_condition)
|
||
|
|
stop_loss_level := ema_long + sl_pips * pip_size
|
||
|
|
take_profit_level := close - initial_take_profit_sell
|
||
|
|
|
||
|
|
// Execução da Estratégia de Compra
|
||
|
|
if (buy_condition)
|
||
|
|
strategy.entry("Compra", strategy.long)
|
||
|
|
|
||
|
|
// Saída da Estratégia de Compra
|
||
|
|
if (strategy.position_size > 0)
|
||
|
|
strategy.exit("Take Profit", "Compra", limit=take_profit_level, stop=stop_loss_level)
|
||
|
|
|
||
|
|
// Execução da Estratégia de Venda
|
||
|
|
if (sell_condition)
|
||
|
|
strategy.entry("Venda", strategy.short)
|
||
|
|
|
||
|
|
// Saída da Estratégia de Venda
|
||
|
|
if (strategy.position_size < 0)
|
||
|
|
strategy.exit("Take Profit", "Venda", limit=take_profit_level, stop=stop_loss_level)
|
||
|
|
|
||
|
|
// Plotagem das EMAs
|
||
|
|
plot(ema_short, color=color.blue, title="EMA Curta")
|
||
|
|
plot(ema_long, color=color.red, title="EMA Longa")
|
||
|
|
|
||
|
|
// Estilo de fundo baseado na posição
|
||
|
|
bgcolor(buy_condition ? color.green : sell_condition ? color.red : na, transp=80)
|
||
|
|
|
||
|
|
```
|
||
|
|
|
||
|
|
> Detail
|
||
|
|
|
||
|
|
https://www.fmz.com/strategy/458049
|
||
|
|
|
||
|
|
> Last Modified
|
||
|
|
|
||
|
|
2024-07-29 14:46:31
|