317 lines
15 KiB
Markdown
317 lines
15 KiB
Markdown

|
|
||
|
|
> Name
|
||
|
|
|
||
|
|
ChandelierExit-EMA动态止损趋势跟踪策略-ChandelierExit-EMA-Dynamic-Stop-Loss-Trend-Following-Strategy
|
||
|
|
|
||
|
|
> Author
|
||
|
|
|
||
|
|
ChaoZhang
|
||
|
|
|
||
|
|
> Strategy Description
|
||
|
|
|
||
|
|
|
||
|
|
|
||
|
|
[trans]
|
||
|
|
#### 概述
|
||
|
|
|
||
|
|
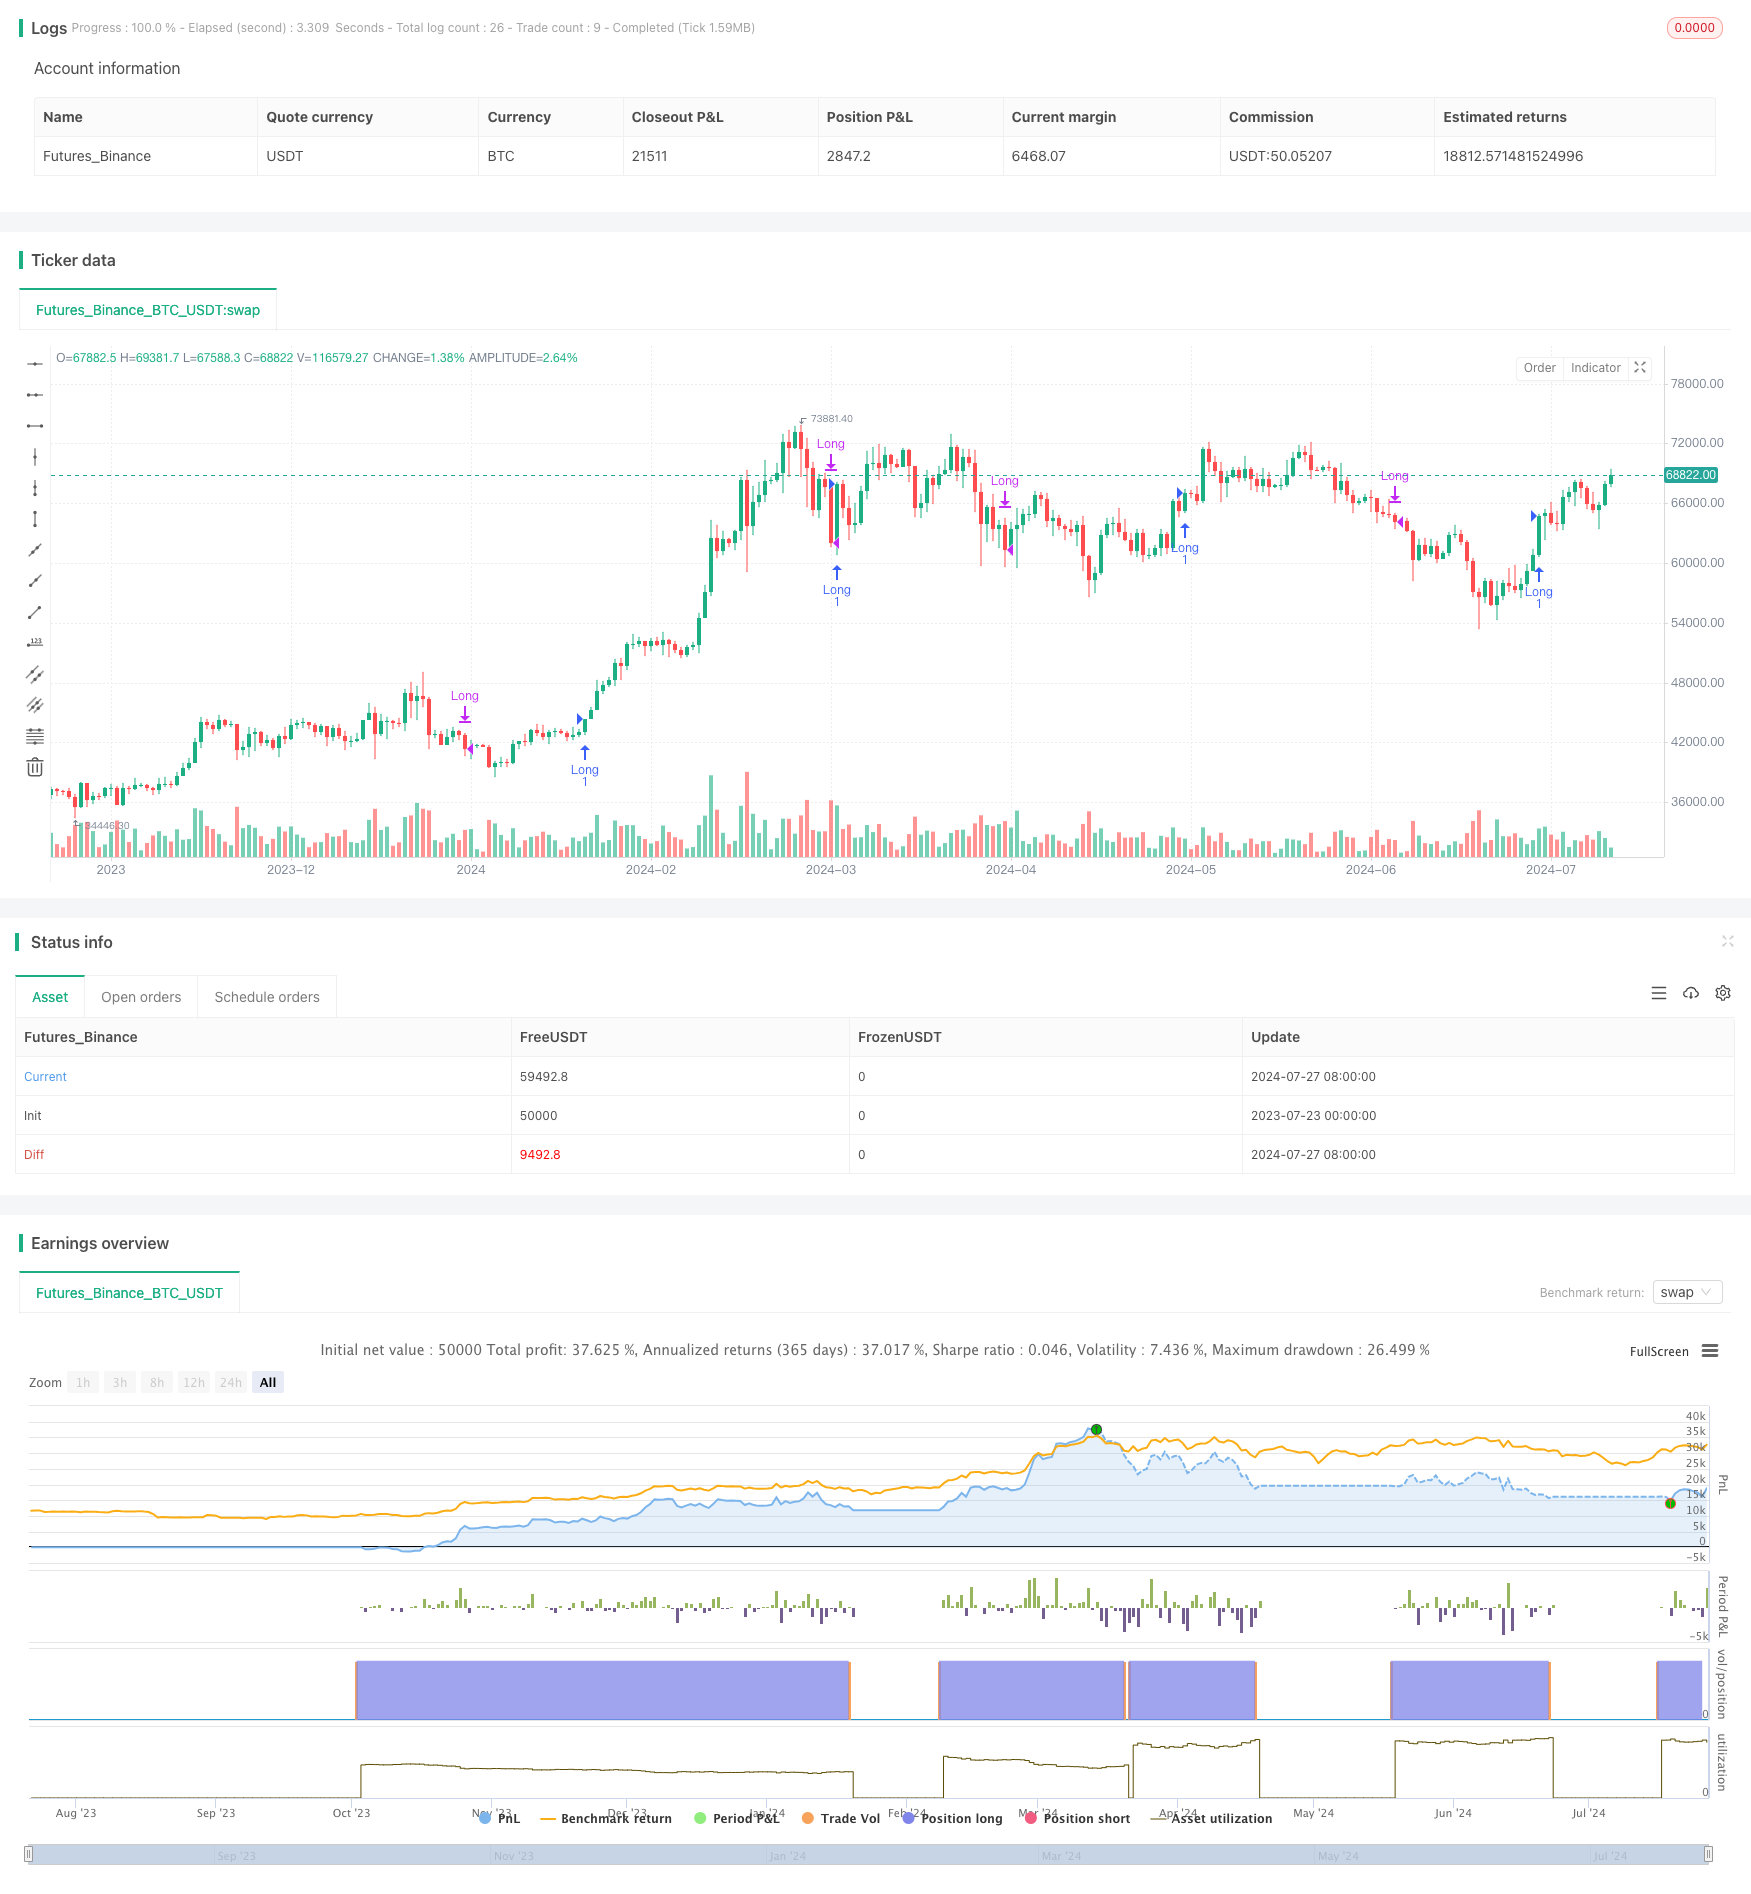
ChandelierExit-EMA动态止损趋势跟踪策略是一个结合了Chandelier Exit指标和200周期指数移动平均线(EMA)的量化交易系统。该策略旨在捕捉市场趋势,同时提供动态的止损水平,以实现风险管理和利润最大化。策略的核心在于利用Chandelier Exit指标生成入场和出场信号,并使用200EMA作为趋势过滤器,确保交易方向与整体市场趋势保持一致。这种方法不仅提高了交易的成功概率,还为交易者提供了清晰的规则,有助于提升交易纪律和整体表现。
|
||
|
|
|
||
|
|
#### 策略原理
|
||
|
|
|
||
|
|
1. Chandelier Exit指标:
|
||
|
|
- 基于平均真实范围(ATR)计算
|
||
|
|
- 用于确定潜在的止损水平
|
||
|
|
- 通过将ATR乘以一个倍数,并从最高价或最低价减去/加上这个值来设置止损
|
||
|
|
- 动态调整以适应市场波动性
|
||
|
|
|
||
|
|
2. 200周期EMA:
|
||
|
|
- 作为趋势过滤器
|
||
|
|
- 确保交易方向与整体趋势一致
|
||
|
|
- 多头交易要求收盘价高于200EMA
|
||
|
|
- 空头交易要求收盘价低于200EMA
|
||
|
|
|
||
|
|
3. 交易信号生成:
|
||
|
|
- 多头入场:Chandelier Exit生成买入信号且收盘价高于200EMA
|
||
|
|
- 空头入场:Chandelier Exit生成卖出信号且收盘价低于200EMA
|
||
|
|
- 多头出场:Chandelier Exit生成卖出信号
|
||
|
|
- 空头出场:Chandelier Exit生成买入信号
|
||
|
|
|
||
|
|
4. 风险管理:
|
||
|
|
- 使用ATR的0.5倍作为初始止损
|
||
|
|
- 每笔交易风险控制在账户权益的10%
|
||
|
|
|
||
|
|
5. 参数设置:
|
||
|
|
- ATR周期:22
|
||
|
|
- ATR乘数:3.0
|
||
|
|
- EMA周期:200
|
||
|
|
- 可选择是否使用收盘价计算极值
|
||
|
|
- 可选择是否显示买卖标签和高亮状态
|
||
|
|
|
||
|
|
#### 策略优势
|
||
|
|
|
||
|
|
1. 动态风险管理:
|
||
|
|
Chandelier Exit指标提供了基于市场波动性的动态止损水平,这使得策略能够在不同的市场环境中自适应调整,有效控制风险。
|
||
|
|
|
||
|
|
2. 趋势确认:
|
||
|
|
使用200EMA作为趋势过滤器,确保交易方向与长期趋势一致,提高了交易的成功率和潜在利润。
|
||
|
|
|
||
|
|
3. 清晰的交易规则:
|
||
|
|
策略提供了明确的入场和出场条件,减少了主观判断,有助于提高交易纪律。
|
||
|
|
|
||
|
|
4. 适应性强:
|
||
|
|
通过调整参数,策略可以适应不同的市场和交易品种,具有良好的灵活性。
|
||
|
|
|
||
|
|
5. 复合指标优势:
|
||
|
|
结合了动量(Chandelier Exit)和趋势(EMA)指标,提供了多层面的市场分析。
|
||
|
|
|
||
|
|
6. 自动化潜力:
|
||
|
|
策略逻辑清晰,易于编程实现,适合用于自动化交易系统。
|
||
|
|
|
||
|
|
7. 风险控制:
|
||
|
|
每笔交易风险限制在账户权益的10%,有助于长期资金管理。
|
||
|
|
|
||
|
|
#### 策略风险
|
||
|
|
|
||
|
|
1. 趋势反转风险:
|
||
|
|
在强劲趋势反转时,策略可能会出现较大回撤。可以通过引入更敏感的短期指标来提前捕捉反转信号。
|
||
|
|
|
||
|
|
2. 过度交易:
|
||
|
|
在震荡市场中,可能会产生频繁的虚假信号。可以考虑增加额外的过滤条件或延长信号确认时间。
|
||
|
|
|
||
|
|
3. 参数敏感性:
|
||
|
|
ATR周期和乘数的选择会显著影响策略表现。建议进行全面的参数优化和回测。
|
||
|
|
|
||
|
|
4. 滑点和佣金影响:
|
||
|
|
高频交易可能导致显著的滑点和佣金成本。可以通过设置最小持仓时间来减少交易频率。
|
||
|
|
|
||
|
|
5. 市场环境依赖:
|
||
|
|
策略在趋势明确的市场中表现较好,但在区间震荡市场可能效果不佳。可以考虑引入市场环境识别机制。
|
||
|
|
|
||
|
|
6. 黑天鹅事件风险:
|
||
|
|
突发性重大事件可能导致市场剧烈波动,突破常规止损水平。建议设置硬性止损或使用期权对冲。
|
||
|
|
|
||
|
|
#### 策略优化方向
|
||
|
|
|
||
|
|
1. 多时间框架分析:
|
||
|
|
引入多个时间周期的EMA,如50EMA和100EMA,以提供更全面的趋势判断。这可以帮助减少虚假信号,提高入场精确度。
|
||
|
|
|
||
|
|
2. 波动率适应:
|
||
|
|
根据不同的市场波动率动态调整ATR乘数。在低波动率环境下使用较大乘数,高波动率环境下使用较小乘数,以更好地适应市场变化。
|
||
|
|
|
||
|
|
3. 加入成交量分析:
|
||
|
|
结合成交量指标,如OBV(On-Balance Volume),以确认价格趋势的有效性,提高信号可靠性。
|
||
|
|
|
||
|
|
4. 引入动量指标:
|
||
|
|
如RSI或MACD,用于确认趋势强度和潜在的超买超卖状态,优化入场和出场时机。
|
||
|
|
|
||
|
|
5. 止盈策略优化:
|
||
|
|
实现动态止盈,如使用抛物线SAR或跟踪止盈,以在保护利润的同时允许趋势继续发展。
|
||
|
|
|
||
|
|
6. 资金管理优化:
|
||
|
|
实现基于凯利准则的仓位管理,根据策略的历史胜率和盈亏比动态调整每笔交易的风险敞口。
|
||
|
|
|
||
|
|
7. 市场regime识别:
|
||
|
|
加入市场状态分类(如趋势、震荡、反转),针对不同市场状态采用不同的参数设置或交易逻辑。
|
||
|
|
|
||
|
|
8. 机器学习优化:
|
||
|
|
使用机器学习算法如随机森林或支持向量机,优化参数选择和信号生成过程。
|
||
|
|
|
||
|
|
#### 总结
|
||
|
|
|
||
|
|
ChandelierExit-EMA动态止损趋势跟踪策略是一个融合了技术分析和风险管理的量化交易系统。通过结合Chandelier Exit的动态止损能力和EMA的趋势跟踪特性,该策略在捕捉市场趋势的同时,有效控制了交易风险。策略的主要优势在于其自适应性和清晰的交易规则,这不仅提高了交易的客观性,还为自动化交易提供了良好的基础。
|
||
|
|
|
||
|
|
然而,该策略也面临着趋势反转风险和参数敏感性等挑战。为了进一步提升策略的稳健性和盈利能力,可以考虑引入多时间框架分析、波动率自适应机制、成交量确认等优化方向。同时,加入机器学习算法进行参数优化和市场环境分类,也是提升策略性能的有效途径。
|
||
|
|
|
||
|
|
总的来说,ChandelierExit-EMA动态止损趋势跟踪策略为交易者提供了一个可靠的量化交易框架。通过持续的优化和适应市场变化,该策略有潜力在长期交易中取得稳定的收益。然而,使用者仍需谨记市场的不确定性,做好全面的风险管理,并在实盘交易前进行充分的回测和模拟交易。
|
||
|
|
|
||
|
|
||
|
||
|
|
|
||
|
|
#### Overview
|
||
|
|
|
||
|
|
The ChandelierExit-EMA Dynamic Stop-Loss Trend-Following Strategy is a quantitative trading system that combines the Chandelier Exit indicator with a 200-period Exponential Moving Average (EMA). This strategy aims to capture market trends while providing dynamic stop-loss levels for risk management and profit maximization. The core of the strategy lies in using the Chandelier Exit indicator to generate entry and exit signals, while employing the 200 EMA as a trend filter to ensure trade direction aligns with the overall market trend. This approach not only increases the probability of successful trades but also provides traders with clear rules, enhancing trading discipline and overall performance.
|
||
|
|
|
||
|
|
#### Strategy Principles
|
||
|
|
|
||
|
|
1. Chandelier Exit Indicator:
|
||
|
|
- Based on Average True Range (ATR) calculations
|
||
|
|
- Used to determine potential stop-loss levels
|
||
|
|
- Sets stops by multiplying ATR by a factor and subtracting/adding from highest high or lowest low
|
||
|
|
- Dynamically adjusts to market volatility
|
||
|
|
|
||
|
|
2. 200-period EMA:
|
||
|
|
- Acts as a trend filter
|
||
|
|
- Ensures trade direction aligns with overall trend
|
||
|
|
- Long trades require close price above 200 EMA
|
||
|
|
- Short trades require close price below 200 EMA
|
||
|
|
|
||
|
|
3. Trade Signal Generation:
|
||
|
|
- Long Entry: Chandelier Exit generates buy signal and close is above 200 EMA
|
||
|
|
- Short Entry: Chandelier Exit generates sell signal and close is below 200 EMA
|
||
|
|
- Long Exit: Chandelier Exit generates sell signal
|
||
|
|
- Short Exit: Chandelier Exit generates buy signal
|
||
|
|
|
||
|
|
4. Risk Management:
|
||
|
|
- Uses 0.5 times ATR as initial stop-loss
|
||
|
|
- Risk per trade limited to 10% of account equity
|
||
|
|
|
||
|
|
5. Parameter Settings:
|
||
|
|
- ATR Period: 22
|
||
|
|
- ATR Multiplier: 3.0
|
||
|
|
- EMA Period: 200
|
||
|
|
- Option to use close price for extremum calculations
|
||
|
|
- Option to display buy/sell labels and highlight state
|
||
|
|
|
||
|
|
#### Strategy Advantages
|
||
|
|
|
||
|
|
1. Dynamic Risk Management:
|
||
|
|
The Chandelier Exit indicator provides dynamic stop-loss levels based on market volatility, allowing the strategy to adapt to different market environments and effectively control risk.
|
||
|
|
|
||
|
|
2. Trend Confirmation:
|
||
|
|
Using the 200 EMA as a trend filter ensures trade direction aligns with long-term trends, increasing the success rate and potential profits of trades.
|
||
|
|
|
||
|
|
3. Clear Trading Rules:
|
||
|
|
The strategy provides explicit entry and exit conditions, reducing subjective judgment and helping to improve trading discipline.
|
||
|
|
|
||
|
|
4. High Adaptability:
|
||
|
|
By adjusting parameters, the strategy can adapt to different markets and trading instruments, offering excellent flexibility.
|
||
|
|
|
||
|
|
5. Composite Indicator Advantage:
|
||
|
|
Combines momentum (Chandelier Exit) and trend (EMA) indicators, providing multi-faceted market analysis.
|
||
|
|
|
||
|
|
6. Automation Potential:
|
||
|
|
The strategy logic is clear and easy to program, making it suitable for automated trading systems.
|
||
|
|
|
||
|
|
7. Risk Control:
|
||
|
|
Limiting risk to 10% of account equity per trade aids in long-term capital management.
|
||
|
|
|
||
|
|
#### Strategy Risks
|
||
|
|
|
||
|
|
1. Trend Reversal Risk:
|
||
|
|
The strategy may experience significant drawdowns during strong trend reversals. This can be mitigated by introducing more sensitive short-term indicators to capture reversal signals earlier.
|
||
|
|
|
||
|
|
2. Over-trading:
|
||
|
|
In oscillating markets, frequent false signals may occur. Consider adding additional filtering conditions or extending signal confirmation time.
|
||
|
|
|
||
|
|
3. Parameter Sensitivity:
|
||
|
|
The choice of ATR period and multiplier significantly affects strategy performance. Comprehensive parameter optimization and backtesting are recommended.
|
||
|
|
|
||
|
|
4. Slippage and Commission Impact:
|
||
|
|
High-frequency trading may lead to significant slippage and commission costs. Setting minimum holding periods can help reduce trading frequency.
|
||
|
|
|
||
|
|
5. Market Environment Dependency:
|
||
|
|
The strategy performs well in clear trend markets but may underperform in range-bound markets. Consider introducing a market environment recognition mechanism.
|
||
|
|
|
||
|
|
6. Black Swan Event Risk:
|
||
|
|
Sudden major events can cause extreme market volatility, breaking through normal stop-loss levels. It's advisable to set hard stops or use options for hedging.
|
||
|
|
|
||
|
|
#### Strategy Optimization Directions
|
||
|
|
|
||
|
|
1. Multi-timeframe Analysis:
|
||
|
|
Introduce EMAs from multiple time periods, such as 50 EMA and 100 EMA, to provide a more comprehensive trend judgment. This can help reduce false signals and improve entry accuracy.
|
||
|
|
|
||
|
|
2. Volatility Adaptation:
|
||
|
|
Dynamically adjust the ATR multiplier based on different market volatility levels. Use larger multipliers in low volatility environments and smaller multipliers in high volatility environments to better adapt to market changes.
|
||
|
|
|
||
|
|
3. Incorporate Volume Analysis:
|
||
|
|
Combine volume indicators, such as On-Balance Volume (OBV), to confirm the validity of price trends and increase signal reliability.
|
||
|
|
|
||
|
|
4. Introduce Momentum Indicators:
|
||
|
|
Use indicators like RSI or MACD to confirm trend strength and potential overbought/oversold conditions, optimizing entry and exit timing.
|
||
|
|
|
||
|
|
5. Profit-Taking Strategy Optimization:
|
||
|
|
Implement dynamic profit-taking, such as using Parabolic SAR or trailing stops, to protect profits while allowing trends to develop.
|
||
|
|
|
||
|
|
6. Capital Management Optimization:
|
||
|
|
Implement position sizing based on the Kelly Criterion, dynamically adjusting risk exposure for each trade based on the strategy's historical win rate and profit/loss ratio.
|
||
|
|
|
||
|
|
7. Market Regime Recognition:
|
||
|
|
Add market state classification (e.g., trending, oscillating, reversing) and adopt different parameter settings or trading logic for different market states.
|
||
|
|
|
||
|
|
8. Machine Learning Optimization:
|
||
|
|
Use machine learning algorithms such as Random Forests or Support Vector Machines to optimize parameter selection and signal generation processes.
|
||
|
|
|
||
|
|
#### Conclusion
|
||
|
|
|
||
|
|
The ChandelierExit-EMA Dynamic Stop-Loss Trend-Following Strategy is a quantitative trading system that integrates technical analysis and risk management. By combining the dynamic stop-loss capabilities of the Chandelier Exit with the trend-following characteristics of the EMA, this strategy effectively captures market trends while controlling trading risk. The main advantages of the strategy lie in its adaptability and clear trading rules, which not only enhance the objectivity of trading but also provide a solid foundation for automated trading.
|
||
|
|
|
||
|
|
However, the strategy also faces challenges such as trend reversal risk and parameter sensitivity. To further improve the robustness and profitability of the strategy, considerations can be made to introduce multi-timeframe analysis, volatility adaptive mechanisms, and volume confirmation. Additionally, incorporating machine learning algorithms for parameter optimization and market environment classification is an effective way to enhance strategy performance.
|
||
|
|
|
||
|
|
Overall, the ChandelierExit-EMA Dynamic Stop-Loss Trend-Following Strategy provides traders with a reliable quantitative trading framework. Through continuous optimization and adaptation to market changes, this strategy has the potential to achieve stable returns in long-term trading. However, users should still be mindful of market uncertainties, implement comprehensive risk management, and conduct thorough backtesting and paper trading before live implementation.
|
||
|
|
|
||
|
|
[/trans]
|
||
|
|
|
||
|
|
|
||
|
|
|
||
|
|
> Source (PineScript)
|
||
|
|
|
||
|
|
``` pinescript
|
||
|
|
/*backtest
|
||
|
|
start: 2023-07-23 00:00:00
|
||
|
|
end: 2024-07-28 00:00:00
|
||
|
|
period: 1d
|
||
|
|
basePeriod: 1h
|
||
|
|
exchanges: [{"eid":"Futures_Binance","currency":"BTC_USDT"}]
|
||
|
|
*/
|
||
|
|
|
||
|
|
// This Pine Script™ code is subject to the terms of the Mozilla Public License 2.0 at https://mozilla.org/MPL/2.0/
|
||
|
|
// © PakunFX
|
||
|
|
|
||
|
|
//@version=5
|
||
|
|
// Copyright (c) 2019-present, Alex Orekhov (everget)
|
||
|
|
// Chandelier Exit script may be freely distributed under the terms of the GPL-3.0 license.
|
||
|
|
strategy('Chandelier Exit Strategy with 200 EMA Filter', shorttitle='CES', overlay=true)
|
||
|
|
|
||
|
|
var string calcGroup = 'Calculation'
|
||
|
|
length = input.int(title='ATR Period', defval=22, group=calcGroup)
|
||
|
|
mult = input.float(title='ATR Multiplier', step=0.1, defval=3.0, group=calcGroup)
|
||
|
|
useClose = input.bool(title='Use Close Price for Extremums', defval=true, group=calcGroup)
|
||
|
|
|
||
|
|
var string visualGroup = 'Visuals'
|
||
|
|
showLabels = input.bool(title='Show Buy/Sell Labels', defval=true, group=visualGroup)
|
||
|
|
highlightState = input.bool(title='Highlight State', defval=true, group=visualGroup)
|
||
|
|
|
||
|
|
var string alertGroup = 'Alerts'
|
||
|
|
awaitBarConfirmation = input.bool(title="Await Bar Confirmation", defval=true, group=alertGroup)
|
||
|
|
|
||
|
|
atr = mult * ta.atr(length)
|
||
|
|
ema200 = ta.ema(close, 200)
|
||
|
|
|
||
|
|
longStop = (useClose ? ta.highest(close, length) : ta.highest(length)) - atr
|
||
|
|
longStopPrev = nz(longStop[1], longStop)
|
||
|
|
longStop := close[1] > longStopPrev ? math.max(longStop, longStopPrev) : longStop
|
||
|
|
|
||
|
|
shortStop = (useClose ? ta.lowest(close, length) : ta.lowest(length)) + atr
|
||
|
|
shortStopPrev = nz(shortStop[1], shortStop)
|
||
|
|
shortStop := close[1] < shortStopPrev ? math.min(shortStop, shortStopPrev) : shortStop
|
||
|
|
|
||
|
|
var int dir = 1
|
||
|
|
dir := close > shortStopPrev ? 1 : close < longStopPrev ? -1 : dir
|
||
|
|
|
||
|
|
buySignal = dir == 1 and dir[1] == -1
|
||
|
|
sellSignal = dir == -1 and dir[1] == 1
|
||
|
|
|
||
|
|
await = awaitBarConfirmation ? barstate.isconfirmed : true
|
||
|
|
|
||
|
|
// Trading logic
|
||
|
|
if (buySignal and await and close > ema200)
|
||
|
|
strategy.entry("Long", strategy.long, stop = low - atr * 0.5)
|
||
|
|
|
||
|
|
if (sellSignal and await and close < ema200)
|
||
|
|
strategy.entry("Short", strategy.short, stop = high + atr * 0.5)
|
||
|
|
|
||
|
|
if (sellSignal and await)
|
||
|
|
strategy.close("Long")
|
||
|
|
|
||
|
|
if (buySignal and await)
|
||
|
|
strategy.close("Short")
|
||
|
|
|
||
|
|
```
|
||
|
|
|
||
|
|
> Detail
|
||
|
|
|
||
|
|
https://www.fmz.com/strategy/458073
|
||
|
|
|
||
|
|
> Last Modified
|
||
|
|
|
||
|
|
2024-07-29 17:05:04
|