170 lines
15 KiB
Markdown
170 lines
15 KiB
Markdown

|
|
||
|
|
> Name
|
||
|
|
|
||
|
|
波林格带和EMA趋势跟踪策略-Bollinger-Bands-and-EMA-Trend-Following-Strategy
|
||
|
|
|
||
|
|
> Author
|
||
|
|
|
||
|
|
ChaoZhang
|
||
|
|
|
||
|
|
> Strategy Description
|
||
|
|
|
||
|
|
|
||
|
|
[trans]
|
||
|
|
#### 概述
|
||
|
|
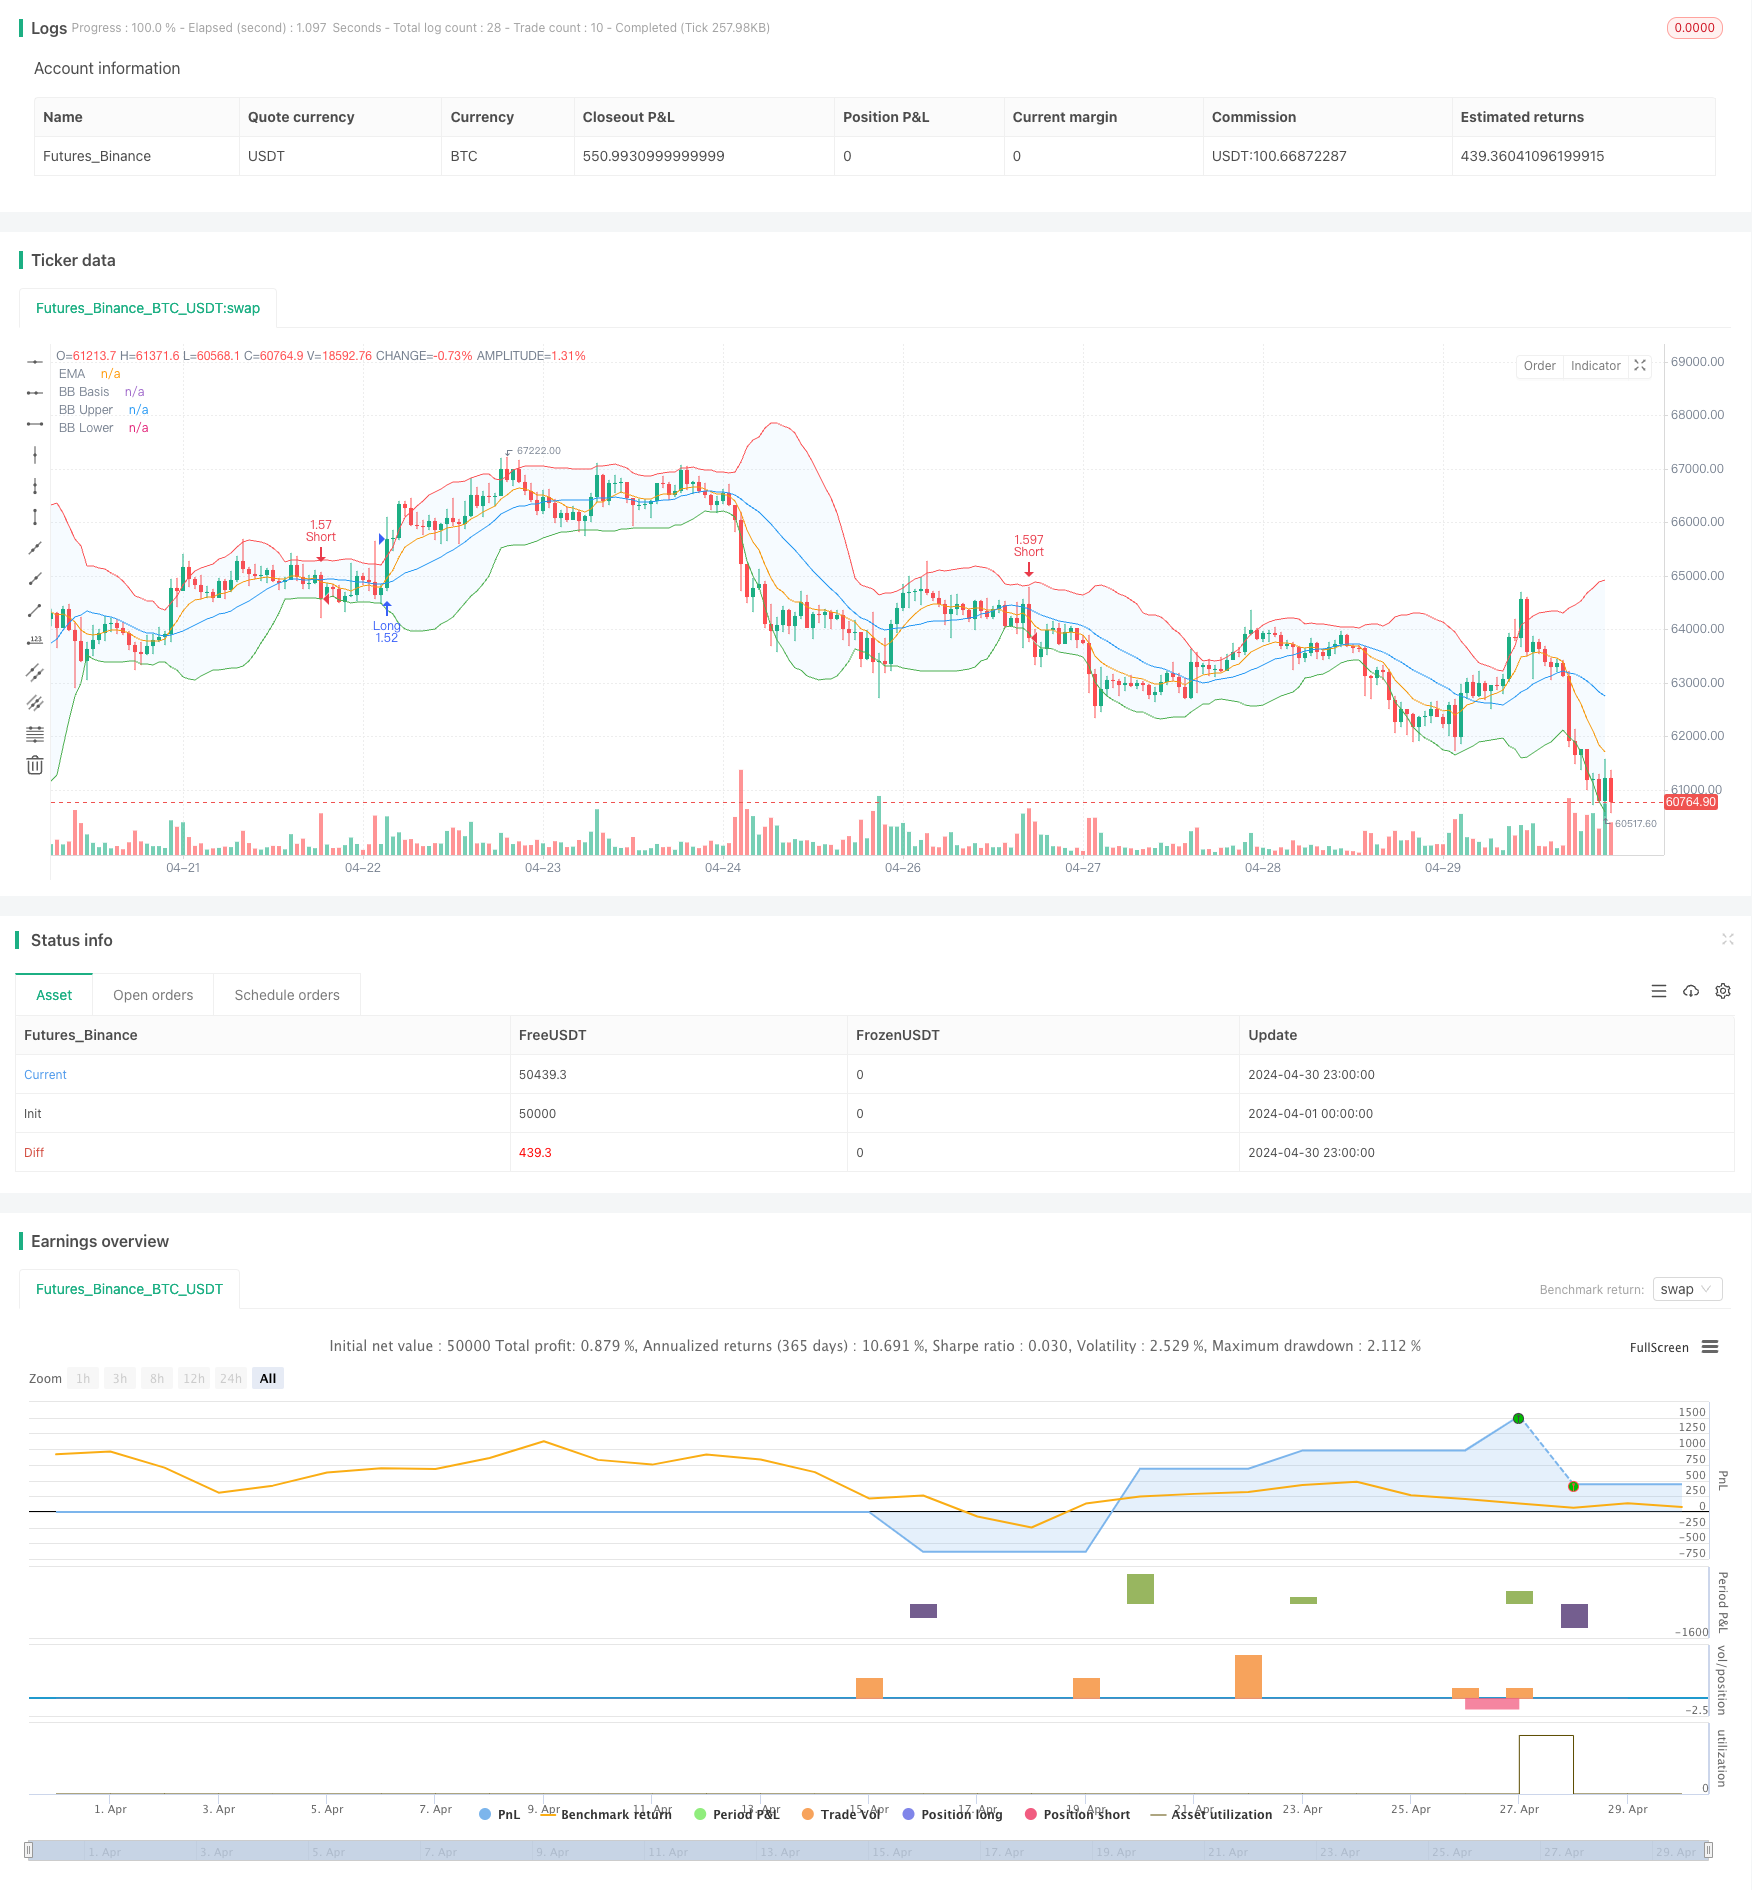
该策略结合了波林格带和指数移动平均线(EMA)两个技术指标,旨在捕捉市场的短期价格波动。波林格带用于衡量价格的波动性,而EMA用于评估趋势方向。当收盘价突破EMA并且超过上轨时,表明上升趋势可能延续,此时开仓做多;相反,当收盘价跌破EMA并且低于下轨时,表明下降趋势可能延续,此时开仓做空。该策略还结合了止损和止盈等风险管理技巧,以控制下行风险并锁定利润。总的来说,该策略基于明确定义的进场和出场条件,为交易者提供了一种系统化的交易方法,提高了成功交易的概率。
|
||
|
|
|
||
|
|
#### 策略原理
|
||
|
|
该策略的核心是利用波林格带和EMA的结合来识别潜在的交易机会。波林格带由三条线组成:中轨(通常为简单移动平均线)、上轨(中轨加上一定倍数的标准差)和下轨(中轨减去一定倍数的标准差)。价格突破上轨或下轨通常表明市场出现了较强的波动,而价格在中轨附近运行则表明市场相对平稳。EMA是一种趋势跟踪指标,它对最近的价格变化赋予更高的权重,因此对价格变化的反应比简单移动平均线更敏感。
|
||
|
|
|
||
|
|
该策略的交易逻辑如下:
|
||
|
|
1. 当收盘价突破EMA并且超过上轨时,开仓做多,表明上升趋势可能延续。
|
||
|
|
2. 当收盘价跌破EMA并且低于下轨时,开仓做空,表明下降趋势可能延续。
|
||
|
|
3. 设置止损和止盈水平,以管理下行风险并锁定利润。止损价格根据一定比例的亏损来计算,止盈价格根据一定比例的获利来计算。
|
||
|
|
4. 根据每笔交易的风险金额来计算仓位大小,以控制每笔交易的风险敞口。
|
||
|
|
|
||
|
|
#### 策略优势
|
||
|
|
1. 趋势跟踪:通过结合波林格带和EMA,该策略能够有效地识别和跟踪市场趋势,捕捉价格的短期波动。
|
||
|
|
2. 风险管理:该策略设置了明确的止损和止盈水平,以控制下行风险并锁定利润。这有助于限制潜在的亏损,并在趋势反转时及时退出交易。
|
||
|
|
3. 仓位管理:该策略根据每笔交易的风险金额来计算仓位大小,确保每笔交易的风险敞口在可接受的范围内。这有助于实现风险的合理分配和控制。
|
||
|
|
4. 适应性强:该策略使用的技术指标具有一定的灵活性,可以根据不同的市场条件和交易品种进行参数优化,以适应不同的交易环境。
|
||
|
|
|
||
|
|
#### 策略风险
|
||
|
|
1. 参数敏感性:该策略的表现在一定程度上取决于波林格带和EMA的参数设置。不恰当的参数选择可能导致错误的交易信号,从而影响策略的整体表现。因此,需要对参数进行仔细的优化和测试。
|
||
|
|
2. 市场噪音:在某些市场条件下,价格可能出现频繁的波动和假突破,导致策略产生错误的交易信号。这可能导致不必要的交易和潜在的亏损。
|
||
|
|
3. 趋势反转:该策略主要适用于趋势市场,在趋势反转或震荡市场中,策略的表现可能会受到影响。当市场缺乏明确的趋势方向时,该策略可能会产生虚假信号,导致潜在的亏损。
|
||
|
|
4. 滑点和交易成本:实际交易中,由于市场的波动性和流动性限制,可能会出现滑点,导致实际成交价格与预期价格存在差异。此外,频繁的交易可能会产生较高的交易成本,影响策略的整体收益。
|
||
|
|
|
||
|
|
#### 策略优化方向
|
||
|
|
1. 参数优化:对波林格带和EMA的参数进行优化,如调整波林格带的长度、标准差倍数以及EMA的周期等,以适应不同的市场条件和交易品种。通过参数优化,可以提高策略的适应性和稳定性。
|
||
|
|
2. 趋势确认:在开仓条件中加入其他趋势确认指标,如ADX、MACD等,以过滤掉一些假突破和噪音信号。这可以提高交易信号的可靠性,减少虚假信号带来的潜在亏损。
|
||
|
|
3. 动态止损和止盈:考虑采用动态止损和止盈机制,如跟踪止损或基于波动性的止损/止盈,以更好地适应市场变化。动态调整止损和止盈水平可以帮助策略更好地保护利润和限制风险。
|
||
|
|
4. 仓位管理优化:优化仓位管理规则,如考虑基于波动性或风险等因素动态调整仓位大小。合理的仓位管理可以帮助策略在不同市场环境中实现更好的风险调整后收益。
|
||
|
|
5. 多时间框架分析:结合不同时间框架的信号,如在高级别时间框架上确认趋势方向,在低级别时间框架上寻找入场点。多时间框架分析可以提供更全面的市场视角,帮助策略做出更informed的交易决策。
|
||
|
|
|
||
|
|
#### 总结
|
||
|
|
波林格带和EMA趋势跟踪策略通过结合波动性指标和趋势跟踪指标,为交易者提供了一种系统化的方法来捕捉市场的短期价格波动。该策略的优势在于能够有效地识别和跟踪市场趋势,同时结合了风险管理和仓位管理技巧。然而,该策略也面临着参数敏感性、市场噪音、趋势反转等风险,需要通过参数优化、趋势确认、动态止损止盈、仓位管理优化和多时间框架分析等方面进行改进和优化。总的来说,波林格带和EMA趋势跟踪策略为交易者提供了一个可行的交易框架,但在实际应用中需要根据具体的市场条件和交易目标进行适当的调整和优化。
|
||
|
|
|
||
|
|
||
|
||
|
|
|
||
|
|
#### Overview
|
||
|
|
The Bollinger Bands and EMA Trend Following Strategy combines two technical indicators, Bollinger Bands and Exponential Moving Average (EMA), to identify potential short-term price movements in the market. Bollinger Bands are used to measure price volatility, while EMA is used to assess the direction of the trend. When the closing price crosses above the EMA and exceeds the upper band, it indicates a potential continuation of an uptrend, triggering a long position. Conversely, when the closing price crosses below the EMA and falls below the lower band, it suggests a potential continuation of a downtrend, prompting a short position. The strategy also incorporates risk management techniques such as stop loss and take profit levels to control downside risk and lock in profits. Overall, the strategy provides traders with a systematic approach to trading based on well-defined entry and exit conditions, increasing the probability of successful trades.
|
||
|
|
|
||
|
|
#### Strategy Principle
|
||
|
|
The core of this strategy lies in the combination of Bollinger Bands and EMA to identify potential trading opportunities. Bollinger Bands consist of three lines: the middle band (usually a simple moving average), the upper band (middle band plus a certain number of standard deviations), and the lower band (middle band minus a certain number of standard deviations). Price breakouts above the upper band or below the lower band typically indicate strong market volatility, while prices moving near the middle band suggest relative market stability. EMA is a trend-following indicator that assigns higher weights to recent price changes, making it more responsive to price movements compared to simple moving averages.
|
||
|
|
|
||
|
|
The trading logic of this strategy is as follows:
|
||
|
|
1. When the closing price crosses above the EMA and exceeds the upper band, open a long position, indicating a potential continuation of an uptrend.
|
||
|
|
2. When the closing price crosses below the EMA and falls below the lower band, open a short position, suggesting a potential continuation of a downtrend.
|
||
|
|
3. Set stop loss and take profit levels to manage downside risk and lock in profits. The stop loss price is calculated based on a certain percentage of loss, while the take profit price is determined based on a certain percentage of gain.
|
||
|
|
4. Calculate position size based on the risk amount per trade to control the risk exposure of each trade.
|
||
|
|
|
||
|
|
#### Strategy Advantages
|
||
|
|
1. Trend Following: By combining Bollinger Bands and EMA, the strategy can effectively identify and follow market trends, capturing short-term price fluctuations.
|
||
|
|
2. Risk Management: The strategy sets well-defined stop loss and take profit levels to control downside risk and lock in profits. This helps limit potential losses and ensures timely exits when trends reverse.
|
||
|
|
3. Position Sizing: The strategy calculates position size based on the risk amount per trade, ensuring that the risk exposure of each trade is within an acceptable range. This helps achieve reasonable risk allocation and control.
|
||
|
|
4. Adaptability: The technical indicators used in this strategy have a certain degree of flexibility and can be optimized based on different market conditions and trading instruments to adapt to various trading environments.
|
||
|
|
|
||
|
|
#### Strategy Risks
|
||
|
|
1. Parameter Sensitivity: The performance of the strategy depends to some extent on the parameter settings of Bollinger Bands and EMA. Inappropriate parameter choices may lead to incorrect trading signals, affecting the overall performance of the strategy. Therefore, careful optimization and testing of parameters are necessary.
|
||
|
|
2. Market Noise: Under certain market conditions, prices may exhibit frequent fluctuations and false breakouts, causing the strategy to generate incorrect trading signals. This can result in unnecessary trades and potential losses.
|
||
|
|
3. Trend Reversal: The strategy is primarily suited for trending markets, and its performance may be impacted during trend reversals or choppy markets. When the market lacks clear trend direction, the strategy may produce false signals, leading to potential losses.
|
||
|
|
4. Slippage and Trading Costs: In real trading, slippage may occur due to market volatility and liquidity constraints, resulting in a difference between the actual execution price and the expected price. Additionally, frequent trading may incur higher transaction costs, impacting the overall profitability of the strategy.
|
||
|
|
|
||
|
|
#### Strategy Optimization Directions
|
||
|
|
1. Parameter Optimization: Optimize the parameters of Bollinger Bands and EMA, such as adjusting the length of Bollinger Bands, the number of standard deviations, and the period of EMA, to adapt to different market conditions and trading instruments. Parameter optimization can improve the adaptability and robustness of the strategy.
|
||
|
|
2. Trend Confirmation: Incorporate additional trend confirmation indicators, such as ADX or MACD, into the entry conditions to filter out false breakouts and noisy signals. This can enhance the reliability of trading signals and reduce potential losses caused by false signals.
|
||
|
|
3. Dynamic Stop Loss and Take Profit: Consider implementing dynamic stop loss and take profit mechanisms, such as trailing stops or volatility-based stops/targets, to better adapt to market changes. Dynamically adjusting stop loss and take profit levels can help the strategy better protect profits and limit risks.
|
||
|
|
4. Position Sizing Optimization: Optimize position sizing rules, such as considering dynamic position sizing based on volatility or risk factors. Proper position sizing can help the strategy achieve better risk-adjusted returns across different market environments.
|
||
|
|
5. Multiple Timeframe Analysis: Combine signals from different timeframes, such as confirming the trend direction on higher timeframes and seeking entry points on lower timeframes. Multi-timeframe analysis can provide a more comprehensive market perspective and help the strategy make more informed trading decisions.
|
||
|
|
|
||
|
|
#### Conclusion
|
||
|
|
The Bollinger Bands and EMA Trend Following Strategy offers traders a systematic approach to capture short-term price movements in the market by combining a volatility indicator and a trend-following indicator. The strategy's strengths lie in its ability to effectively identify and follow market trends while incorporating risk management and position sizing techniques. However, the strategy also faces risks such as parameter sensitivity, market noise, trend reversals, and needs to be improved and optimized through parameter optimization, trend confirmation, dynamic stop loss and take profit, position sizing optimization, and multi-timeframe analysis. Overall, the Bollinger Bands and EMA Trend Following Strategy provides traders with a viable trading framework, but it requires appropriate adjustments and optimizations based on specific market conditions and trading objectives in practical applications.
|
||
|
|
[/trans]
|
||
|
|
|
||
|
|
|
||
|
|
|
||
|
|
> Source (PineScript)
|
||
|
|
|
||
|
|
``` pinescript
|
||
|
|
/*backtest
|
||
|
|
start: 2024-04-01 00:00:00
|
||
|
|
end: 2024-04-30 23:59:59
|
||
|
|
period: 1h
|
||
|
|
basePeriod: 15m
|
||
|
|
exchanges: [{"eid":"Futures_Binance","currency":"BTC_USDT"}]
|
||
|
|
*/
|
||
|
|
|
||
|
|
//@version=5
|
||
|
|
strategy("Bollinger Bands and EMA Strategy", overlay=true)
|
||
|
|
|
||
|
|
// Bollinger Bands Inputs
|
||
|
|
bb_length = input.int(20, minval=1, title="Bollinger Bands Length")
|
||
|
|
bb_mult = input.float(2.0, minval=0.001, maxval=50, title="Bollinger Bands StdDev")
|
||
|
|
bb_src = input(close, title="Bollinger Bands Source")
|
||
|
|
bb_offset = input.int(0, title="Bollinger Bands Offset", minval=-500, maxval=500)
|
||
|
|
|
||
|
|
// EMA Inputs
|
||
|
|
ema_period = input.int(9, minval=1, title="EMA Period")
|
||
|
|
ema_src = input(close, title="EMA Source")
|
||
|
|
ema_offset = input.int(0, title="EMA Offset", minval=-500, maxval=500)
|
||
|
|
|
||
|
|
// Calculate Bollinger Bands
|
||
|
|
bb_basis = ta.sma(bb_src, bb_length)
|
||
|
|
bb_dev = bb_mult * ta.stdev(bb_src, bb_length)
|
||
|
|
bb_upper = bb_basis + bb_dev
|
||
|
|
bb_lower = bb_basis - bb_dev
|
||
|
|
|
||
|
|
// Plot Bollinger Bands
|
||
|
|
plot(bb_basis, "BB Basis", color=color.blue, offset=bb_offset)
|
||
|
|
p1 = plot(bb_upper, "BB Upper", color=color.red, offset=bb_offset)
|
||
|
|
p2 = plot(bb_lower, "BB Lower", color=color.green, offset=bb_offset)
|
||
|
|
fill(p1, p2, title="BB Background", color=color.rgb(33, 150, 243, 95))
|
||
|
|
|
||
|
|
// Calculate EMA
|
||
|
|
ema_value = ta.ema(ema_src, ema_period)
|
||
|
|
|
||
|
|
// Plot EMA
|
||
|
|
plot(ema_value, title="EMA", color=color.orange, offset=ema_offset)
|
||
|
|
|
||
|
|
// Strategy Conditions
|
||
|
|
long_condition = ta.crossover(close, ema_value) and close > bb_upper
|
||
|
|
short_condition = ta.crossunder(close, ema_value) and close < bb_lower
|
||
|
|
|
||
|
|
// Define Stop Loss and Take Profit Levels
|
||
|
|
stop_loss_pct = input.float(0.5, title="Stop Loss (%)")
|
||
|
|
take_profit_pct = input.float(1.0, title="Take Profit (%)")
|
||
|
|
stop_loss_level_long = close * (1 - stop_loss_pct / 100)
|
||
|
|
take_profit_level_long = close * (1 + take_profit_pct / 100)
|
||
|
|
stop_loss_level_short = close * (1 + stop_loss_pct / 100)
|
||
|
|
take_profit_level_short = close * (1 - take_profit_pct / 100)
|
||
|
|
|
||
|
|
// Calculate Position Size Based on Risk Per Trade
|
||
|
|
risk_per_trade = input.float(1.0, title="Risk Per Trade (%)")
|
||
|
|
capital_at_risk = strategy.equity * risk_per_trade / 100
|
||
|
|
risk_per_unit_long = math.abs(close - stop_loss_level_long)
|
||
|
|
risk_per_unit_short = math.abs(close - stop_loss_level_short)
|
||
|
|
position_size_long = capital_at_risk / risk_per_unit_long
|
||
|
|
position_size_short = capital_at_risk / risk_per_unit_short
|
||
|
|
|
||
|
|
// Enter Long and Short Trades
|
||
|
|
if long_condition
|
||
|
|
strategy.entry("Long", strategy.long, qty=position_size_long)
|
||
|
|
strategy.exit("Take Profit", "Long", limit=take_profit_level_long)
|
||
|
|
strategy.exit("Stop Loss", "Long", stop=stop_loss_level_long)
|
||
|
|
|
||
|
|
if short_condition
|
||
|
|
strategy.entry("Short", strategy.short, qty=position_size_short)
|
||
|
|
strategy.exit("Take Profit", "Short", limit=take_profit_level_short)
|
||
|
|
strategy.exit("Stop Loss", "Short", stop=stop_loss_level_short)
|
||
|
|
|
||
|
|
```
|
||
|
|
|
||
|
|
> Detail
|
||
|
|
|
||
|
|
https://www.fmz.com/strategy/452819
|
||
|
|
|
||
|
|
> Last Modified
|
||
|
|
|
||
|
|
2024-05-29 16:49:14
|