207 lines
8.7 KiB
Markdown
207 lines
8.7 KiB
Markdown

|
|
||
|
|
> Name
|
||
|
|
|
||
|
|
波林带结合伍迪CCI多重指标过滤交易信号策略-Multi-Indicator-Filtered-Trading-Strategy-with-Bollinger-Bands-and-Woodies-CCI
|
||
|
|
|
||
|
|
> Author
|
||
|
|
|
||
|
|
ChaoZhang
|
||
|
|
|
||
|
|
> Strategy Description
|
||
|
|
|
||
|
|
|
||
|
|
|
||
|
|
[trans]
|
||
|
|
#### 概述
|
||
|
|
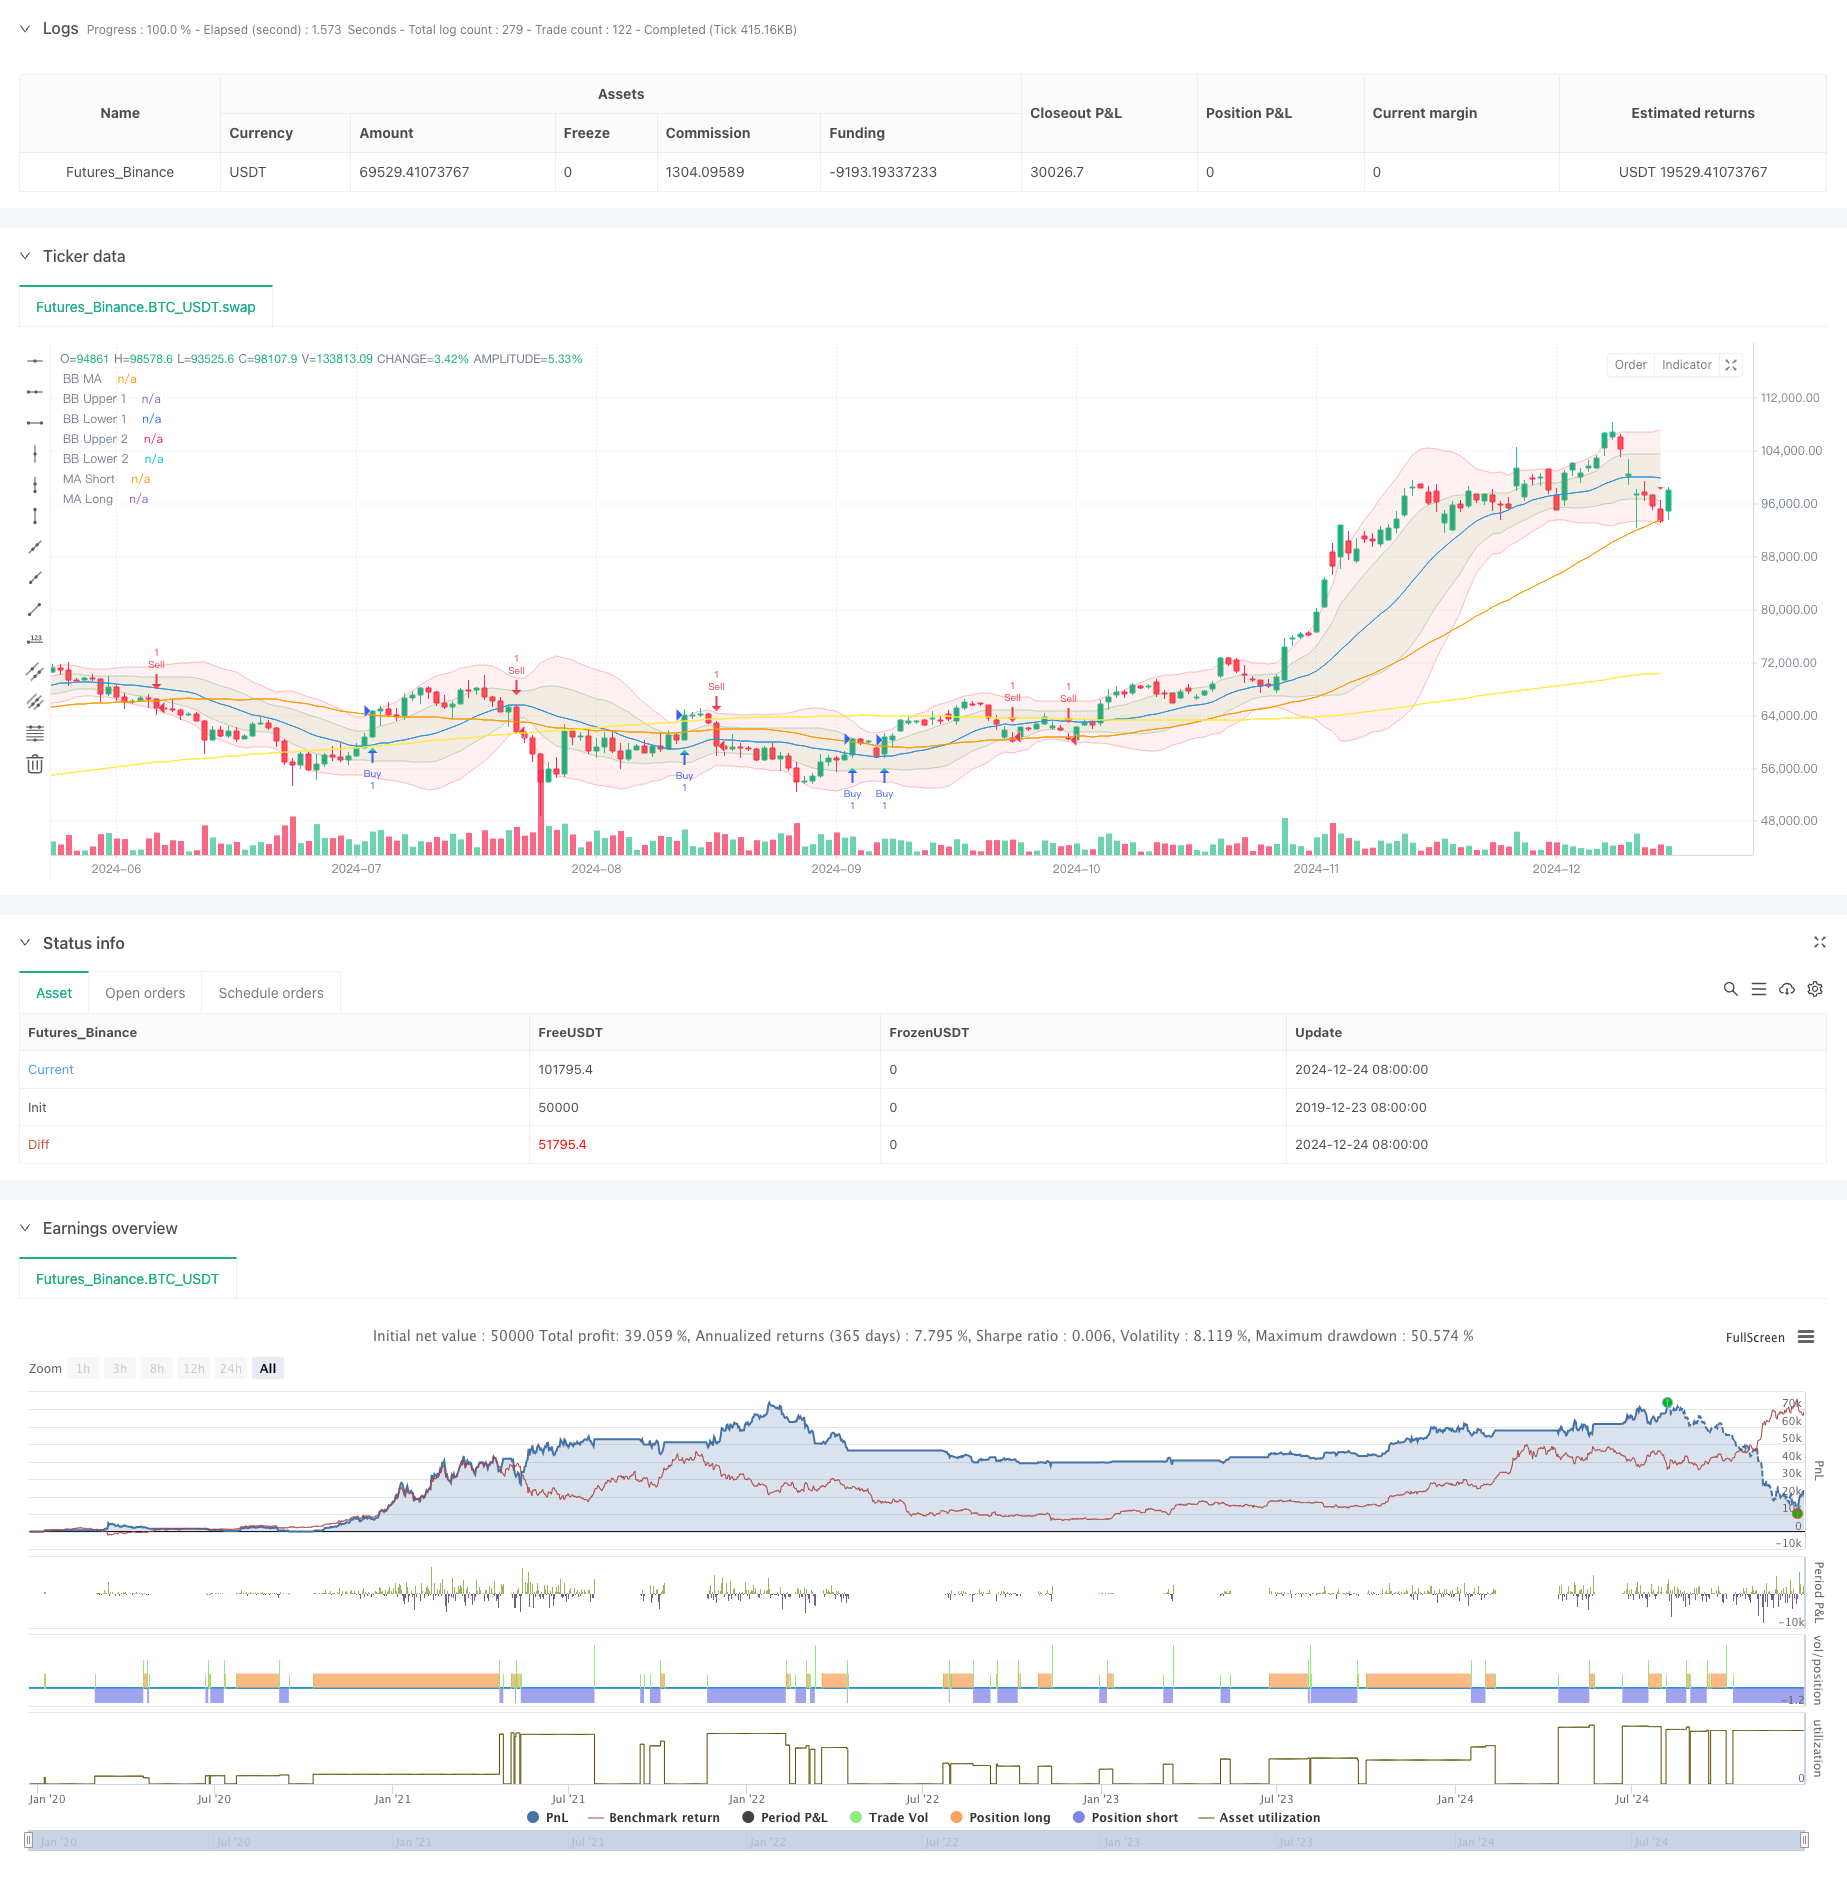
该策略是一个结合了波林带(Bollinger Bands)、伍迪商品通道指数(Woodies CCI)、移动平均线(MA)和交易量平衡指标(OBV)的多重指标交易系统。策略通过波林带提供市场波动区间,使用CCI指标过滤交易信号,再结合均线系统和交易量确认,从而在市场趋势明确时进行交易。同时使用ATR动态设置止盈止损位置,有效控制风险。
|
||
|
|
|
||
|
|
#### 策略原理
|
||
|
|
策略的核心逻辑基于以下几个关键要素:
|
||
|
|
1. 使用两条标准差的波林带(1倍和2倍)构建价格波动通道,提供市场波动范围参考
|
||
|
|
2. 采用6周期和14周期的CCI指标作为信号过滤器,要求两个周期的CCI同向确认
|
||
|
|
3. 结合50周期和200周期的移动平均线判断市场趋势,在均线交叉时产生初始交易信号
|
||
|
|
4. 通过OBV指标的10周期平滑确认成交量趋势
|
||
|
|
5. 使用14周期ATR动态设置止盈止损,多头止盈为2倍ATR,止损为1倍ATR,空头相反
|
||
|
|
|
||
|
|
#### 策略优势
|
||
|
|
1. 多重指标交叉验证,大大降低虚假信号概率
|
||
|
|
2. 波林带和CCI结合提供了准确的市场波动判断
|
||
|
|
3. 长短期均线系统有效把握大趋势
|
||
|
|
4. OBV确认交易量支撑,提高信号可靠性
|
||
|
|
5. 动态止盈止损设置,适应不同市场环境
|
||
|
|
6. 交易信号清晰,执行标准,易于量化实现
|
||
|
|
|
||
|
|
#### 策略风险
|
||
|
|
1. 多重指标可能导致信号滞后,错过最佳入场时机
|
||
|
|
2. 在震荡市场中可能频繁触发止损
|
||
|
|
3. 参数优化存在过度拟合风险
|
||
|
|
4. 剧烈波动时期止损可能不够及时
|
||
|
|
应对措施:
|
||
|
|
- 根据不同市场周期动态调整指标参数
|
||
|
|
- 实时监控回撤控制仓位
|
||
|
|
- 定期检验参数有效性
|
||
|
|
- 设置最大损失限制
|
||
|
|
|
||
|
|
#### 策略优化方向
|
||
|
|
1. 引入市场波动率指标,在高波动期调整仓位
|
||
|
|
2. 增加趋势强度过滤,避免震荡市交易
|
||
|
|
3. 优化CCI周期选择,提高信号灵敏度
|
||
|
|
4. 完善止盈止损机制,如考虑分批止盈
|
||
|
|
5. 加入交易量异常预警机制
|
||
|
|
|
||
|
|
#### 总结
|
||
|
|
这是一个基于技术指标组合的完整交易系统,通过多重信号确认提高交易准确性。策略设计合理,风险控制得当,具有良好的实战应用价值。建议在实盘中采用保守仓位进行测试,并根据市场情况持续优化参数。
|
||
|
|
|
||
|
|
||
|
||
|
|
|
||
|
|
#### Overview
|
||
|
|
This strategy is a multi-indicator trading system combining Bollinger Bands, Woodies CCI (Commodity Channel Index), Moving Averages (MA), and On-Balance Volume (OBV). It uses Bollinger Bands to provide market volatility ranges, CCI indicators for signal filtering, and combines MA systems with volume confirmation to execute trades when market trends are clear. Additionally, it employs ATR for dynamic stop-loss and take-profit placement to effectively control risk.
|
||
|
|
|
||
|
|
#### Strategy Principles
|
||
|
|
The core logic is based on the following key elements:
|
||
|
|
1. Uses two standard deviation Bollinger Bands (1x and 2x) to construct price volatility channels
|
||
|
|
2. Employs 6-period and 14-period CCI indicators as signal filters, requiring confirmation from both periods
|
||
|
|
3. Combines 50-period and 200-period moving averages to determine market trends
|
||
|
|
4. Confirms volume trends through 10-period smoothed OBV
|
||
|
|
5. Uses 14-period ATR for dynamic stop-loss and take-profit levels
|
||
|
|
|
||
|
|
#### Strategy Advantages
|
||
|
|
1. Multiple indicator cross-validation significantly reduces false signals
|
||
|
|
2. Bollinger Bands and CCI combination provides accurate market volatility judgment
|
||
|
|
3. Long and short-term MA systems effectively capture major trends
|
||
|
|
4. OBV confirms volume support, increasing signal reliability
|
||
|
|
5. Dynamic stop-loss and take-profit settings adapt to different market conditions
|
||
|
|
6. Clear trading signals with standardized execution, suitable for quantitative implementation
|
||
|
|
|
||
|
|
#### Strategy Risks
|
||
|
|
1. Multiple indicators may lead to delayed signals
|
||
|
|
2. Frequent stop-losses in ranging markets
|
||
|
|
3. Risk of parameter optimization overfitting
|
||
|
|
4. Stop-losses may not trigger quickly enough in volatile periods
|
||
|
|
Mitigation measures:
|
||
|
|
- Dynamically adjust indicator parameters for different market cycles
|
||
|
|
- Monitor drawdown for position control
|
||
|
|
- Regular parameter validation
|
||
|
|
- Set maximum loss limits
|
||
|
|
|
||
|
|
#### Optimization Directions
|
||
|
|
1. Introduce volatility indicators to adjust positions in high volatility periods
|
||
|
|
2. Add trend strength filtering to avoid ranging market trades
|
||
|
|
3. Optimize CCI period selection for improved signal sensitivity
|
||
|
|
4. Enhance profit/loss management with partial profit-taking
|
||
|
|
5. Implement volume anomaly warning system
|
||
|
|
|
||
|
|
#### Summary
|
||
|
|
This is a complete trading system based on technical indicator combinations that improves trading accuracy through multiple signal confirmations. The strategy design is reasonable with proper risk control and has good practical application value. It is recommended to test with conservative positions in live trading and continuously optimize parameters based on market conditions.[/trans]
|
||
|
|
|
||
|
|
|
||
|
|
|
||
|
|
> Source (PineScript)
|
||
|
|
|
||
|
|
``` pinescript
|
||
|
|
/*backtest
|
||
|
|
start: 2019-12-23 08:00:00
|
||
|
|
end: 2024-12-25 08:00:00
|
||
|
|
period: 1d
|
||
|
|
basePeriod: 1d
|
||
|
|
exchanges: [{"eid":"Futures_Binance","currency":"BTC_USDT"}]
|
||
|
|
*/
|
||
|
|
|
||
|
|
//@version=6
|
||
|
|
strategy(shorttitle="BB Debug + Woodies CCI Filter", title="Debug Buy/Sell Signals with Woodies CCI Filter", overlay=true)
|
||
|
|
|
||
|
|
// Input Parameters
|
||
|
|
length = input.int(20, minval=1, title="BB MA Length")
|
||
|
|
src = input.source(close, title="BB Source")
|
||
|
|
mult1 = input.float(1.0, minval=0.001, maxval=50, title="BB Multiplier 1 (Std Dev 1)")
|
||
|
|
mult2 = input.float(2.0, minval=0.001, maxval=50, title="BB Multiplier 2 (Std Dev 2)")
|
||
|
|
ma_length = input.int(50, minval=1, title="MA Length")
|
||
|
|
ma_long_length = input.int(200, minval=1, title="Long MA Length")
|
||
|
|
obv_smoothing = input.int(10, minval=1, title="OBV Smoothing Length")
|
||
|
|
atr_length = input.int(14, minval=1, title="ATR Length") // ATR Length for TP/SL
|
||
|
|
|
||
|
|
// Bollinger Bands
|
||
|
|
basis = ta.sma(src, length)
|
||
|
|
dev1 = mult1 * ta.stdev(src, length)
|
||
|
|
dev2 = mult2 * ta.stdev(src, length)
|
||
|
|
|
||
|
|
upper_1 = basis + dev1
|
||
|
|
lower_1 = basis - dev1
|
||
|
|
upper_2 = basis + dev2
|
||
|
|
lower_2 = basis - dev2
|
||
|
|
|
||
|
|
plot(basis, color=color.blue, title="BB MA")
|
||
|
|
p1 = plot(upper_1, color=color.new(color.green, 80), title="BB Upper 1")
|
||
|
|
p2 = plot(lower_1, color=color.new(color.green, 80), title="BB Lower 1")
|
||
|
|
p3 = plot(upper_2, color=color.new(color.red, 80), title="BB Upper 2")
|
||
|
|
p4 = plot(lower_2, color=color.new(color.red, 80), title="BB Lower 2")
|
||
|
|
|
||
|
|
fill(p1, p2, color=color.new(color.green, 90))
|
||
|
|
fill(p3, p4, color=color.new(color.red, 90))
|
||
|
|
|
||
|
|
// Moving Averages
|
||
|
|
ma_short = ta.sma(close, ma_length)
|
||
|
|
ma_long = ta.sma(close, ma_long_length)
|
||
|
|
plot(ma_short, color=color.orange, title="MA Short")
|
||
|
|
plot(ma_long, color=color.yellow, title="MA Long")
|
||
|
|
|
||
|
|
// OBV and Smoothing
|
||
|
|
obv = ta.cum(ta.change(close) > 0 ? volume : ta.change(close) < 0 ? -volume : 0)
|
||
|
|
obv_smooth = ta.sma(obv, obv_smoothing)
|
||
|
|
|
||
|
|
// Debugging: Buy/Sell Signals
|
||
|
|
debugBuy = ta.crossover(close, ma_short)
|
||
|
|
debugSell = ta.crossunder(close, ma_short)
|
||
|
|
|
||
|
|
// Woodies CCI
|
||
|
|
cciTurboLength = 6
|
||
|
|
cci14Length = 14
|
||
|
|
cciTurbo = ta.cci(src, cciTurboLength)
|
||
|
|
cci14 = ta.cci(src, cci14Length)
|
||
|
|
|
||
|
|
// Filter: Only allow trades when CCI confirms the signal
|
||
|
|
cciBuyFilter = cciTurbo > 0 and cci14 > 0
|
||
|
|
cciSellFilter = cciTurbo < 0 and cci14 < 0
|
||
|
|
|
||
|
|
finalBuySignal = debugBuy and cciBuyFilter
|
||
|
|
finalSellSignal = debugSell and cciSellFilter
|
||
|
|
|
||
|
|
// Plot Debug Buy/Sell Signals
|
||
|
|
plotshape(finalBuySignal, title="Filtered Buy", location=location.belowbar, color=color.lime, style=shape.triangleup, size=size.normal)
|
||
|
|
plotshape(finalSellSignal, title="Filtered Sell", location=location.abovebar, color=color.red, style=shape.triangledown, size=size.normal)
|
||
|
|
|
||
|
|
// Change candle color based on filtered signals
|
||
|
|
barcolor(finalBuySignal ? color.lime : finalSellSignal ? color.red : na)
|
||
|
|
|
||
|
|
// ATR for Stop Loss and Take Profit
|
||
|
|
atr = ta.atr(atr_length)
|
||
|
|
tp_long = close + 2 * atr // Take Profit for Long = 2x ATR
|
||
|
|
sl_long = close - 1 * atr // Stop Loss for Long = 1x ATR
|
||
|
|
tp_short = close - 2 * atr // Take Profit for Short = 2x ATR
|
||
|
|
sl_short = close + 1 * atr // Stop Loss for Short = 1x ATR
|
||
|
|
|
||
|
|
// Strategy Execution
|
||
|
|
if (finalBuySignal)
|
||
|
|
strategy.entry("Buy", strategy.long)
|
||
|
|
strategy.exit("Take Profit/Stop Loss", "Buy", limit=tp_long, stop=sl_long)
|
||
|
|
|
||
|
|
if (finalSellSignal)
|
||
|
|
strategy.entry("Sell", strategy.short)
|
||
|
|
strategy.exit("Take Profit/Stop Loss", "Sell", limit=tp_short, stop=sl_short)
|
||
|
|
|
||
|
|
// Check for BTC/USDT pair
|
||
|
|
isBTCUSDT = syminfo.ticker == "BTCUSDT"
|
||
|
|
|
||
|
|
// Add alerts only for BTC/USDT
|
||
|
|
alertcondition(isBTCUSDT and finalBuySignal, title="BTCUSDT Buy Signal", message="Buy signal detected for BTCUSDT!")
|
||
|
|
alertcondition(isBTCUSDT and finalSellSignal, title="BTCUSDT Sell Signal", message="Sell signal detected for BTCUSDT!")
|
||
|
|
```
|
||
|
|
|
||
|
|
> Detail
|
||
|
|
|
||
|
|
https://www.fmz.com/strategy/476266
|
||
|
|
|
||
|
|
> Last Modified
|
||
|
|
|
||
|
|
2024-12-27 15:32:30
|