219 lines
12 KiB
Markdown
219 lines
12 KiB
Markdown

|
|
|||
|
|
> Name
|
|||
|
|
|
|||
|
|
波动率动量突破交易策略结合趋势和动量过滤-Volatility-Momentum-Breakout-Strategy-with-Trend-and-Momentum-Filters
|
|||
|
|
|
|||
|
|
> Author
|
|||
|
|
|
|||
|
|
ianzeng123
|
|||
|
|
|
|||
|
|
> Strategy Description
|
|||
|
|
|
|||
|
|
|
|||
|
|
|
|||
|
|
|
|||
|
|
|
|||
|
|
|
|||
|
|
|
|||
|
|
[trans]
|
|||
|
|
#### 概述
|
|||
|
|
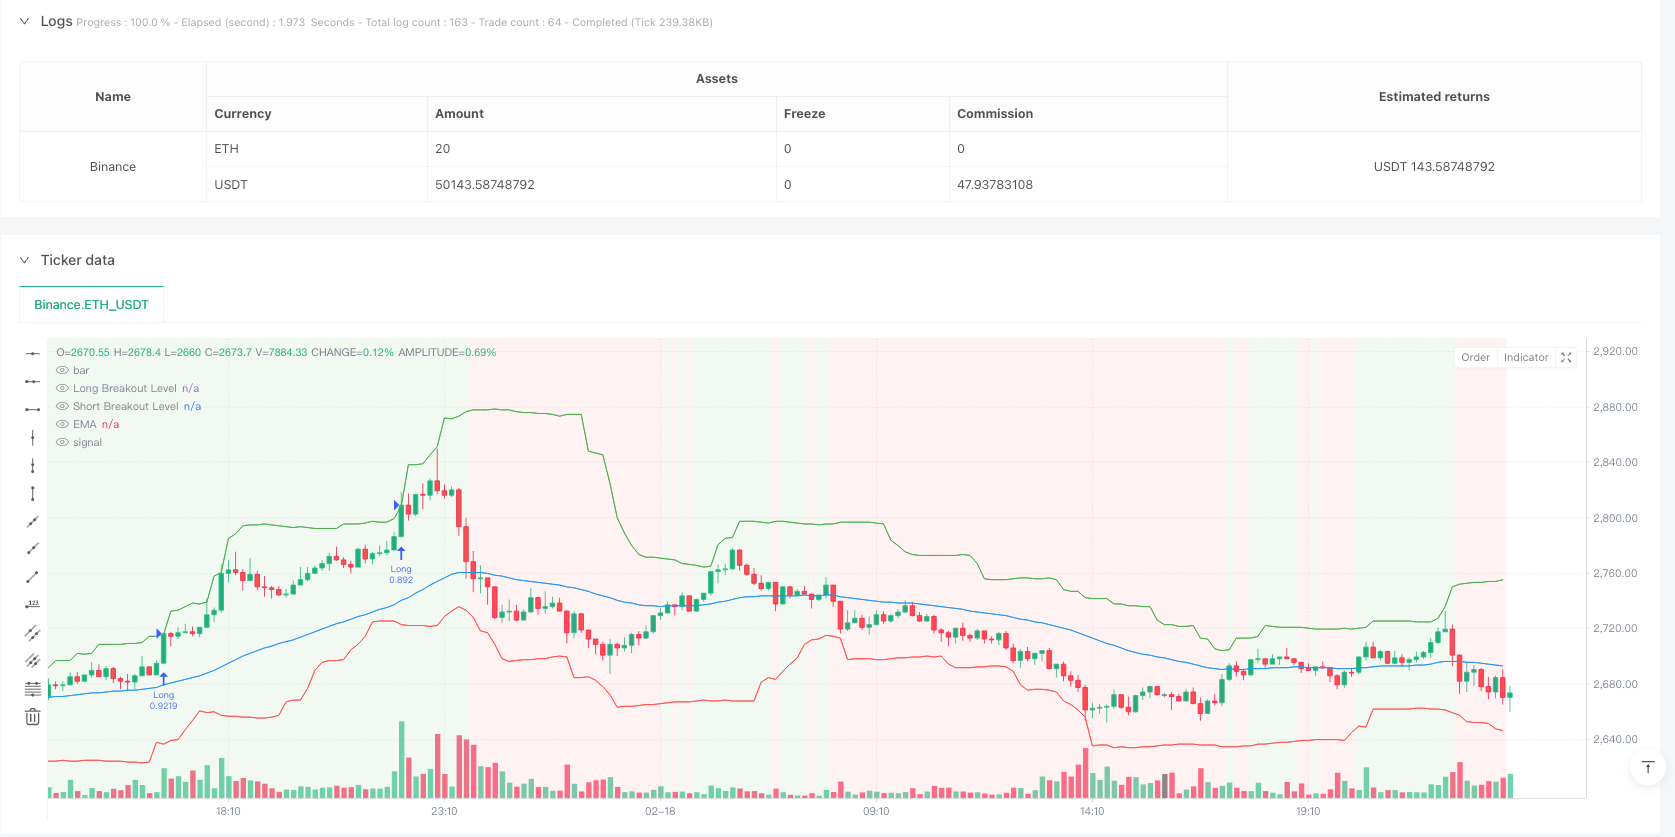
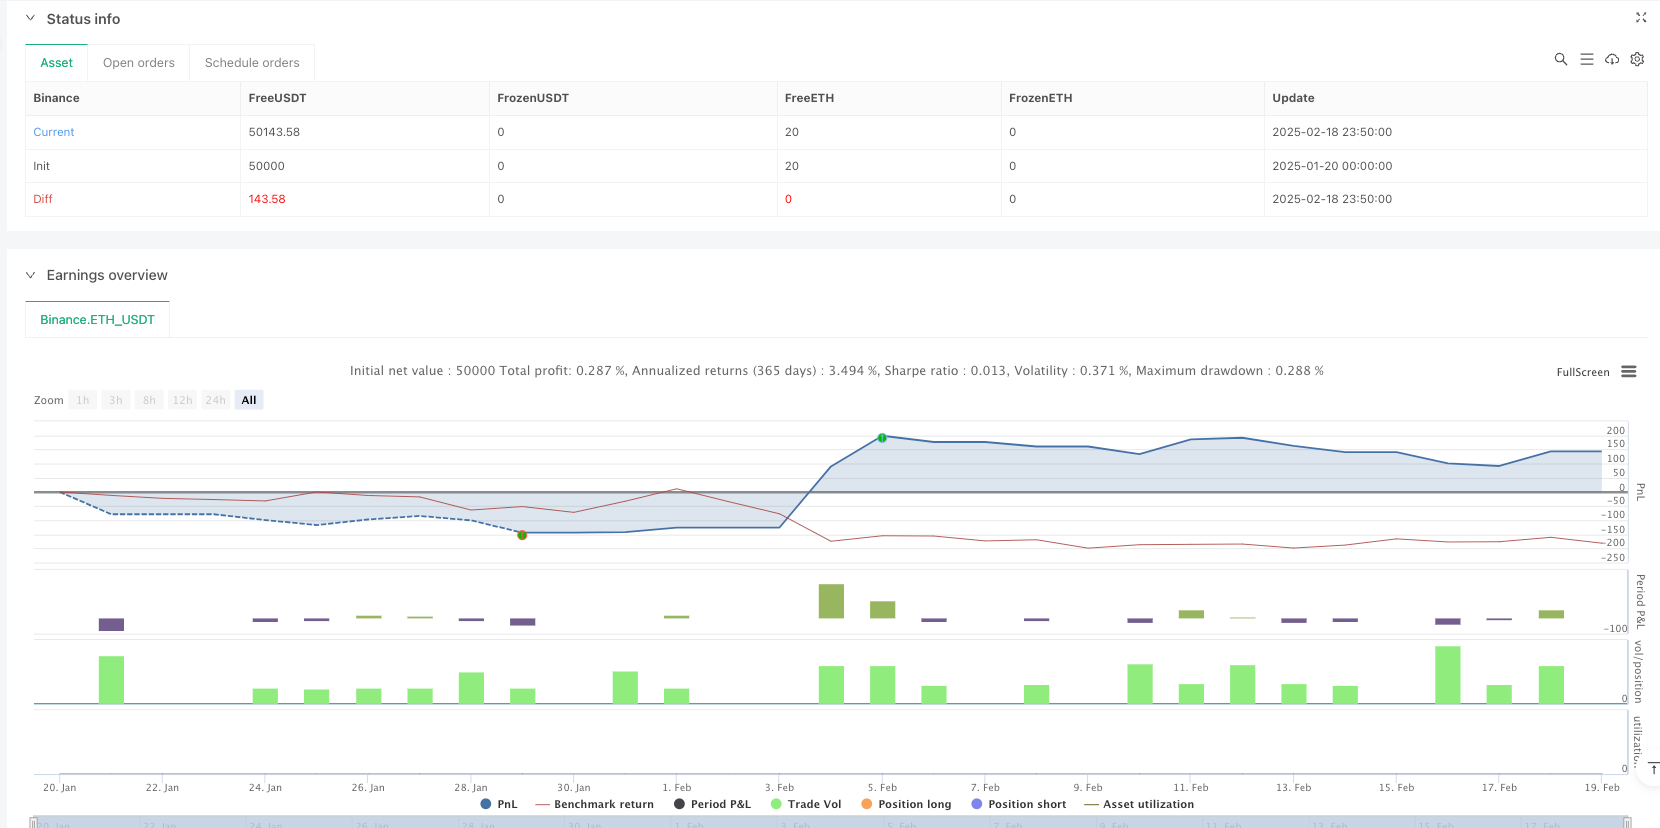
该策略是一个结合波动率突破、趋势跟踪和动量确认的量化交易系统。它通过计算基于ATR的动态突破水平,并结合EMA趋势过滤和RSI动量指标来识别交易机会。策略采用严格的风险控制措施,包括固定百分比风险管理和动态止损设置。
|
|||
|
|
|
|||
|
|
#### 策略原理
|
|||
|
|
策略包含三个核心组成部分:
|
|||
|
|
1. 波动率突破计算:使用回溯期内的最高价和最低价,结合ATR倍数计算动态突破阈值,避免前瞻偏差。
|
|||
|
|
2. 趋势过滤:采用短期EMA判断当前趋势方向,只在价格位于EMA之上开多单,位于EMA之下开空单。
|
|||
|
|
3. 动量确认:使用RSI指标确认市场动量,多头入场要求RSI大于50,空头入场要求RSI小于50。
|
|||
|
|
|
|||
|
|
#### 策略优势
|
|||
|
|
1. 动态适应性:突破水平会根据市场波动率自动调整,使策略能够适应不同市场环境。
|
|||
|
|
2. 多重过滤:结合趋势和动量指标降低虚假信号。
|
|||
|
|
3. 严格风险控制:采用固定风险百分比进行头寸管理,并使用动态止损保护。
|
|||
|
|
4. 可定制性强:关键参数如ATR周期、突破倍数、EMA周期等都可根据具体需求调整。
|
|||
|
|
|
|||
|
|
#### 策略风险
|
|||
|
|
1. 滞后性风险:使用移动平均等指标可能导致入场点滞后。
|
|||
|
|
2. 震荡市场风险:在横盘震荡市场中可能产生频繁的虚假突破信号。
|
|||
|
|
3. 参数敏感性:策略表现对参数设置较为敏感,需要充分测试。
|
|||
|
|
解决方案:
|
|||
|
|
- 建议在不同市场环境下进行回测优化
|
|||
|
|
- 可以添加市场环境识别模块
|
|||
|
|
- 建议采用更保守的资金管理方案
|
|||
|
|
|
|||
|
|
#### 策略优化方向
|
|||
|
|
1. 市场环境适应:添加波动率区间判断,在不同波动环境下使用不同的参数设置。
|
|||
|
|
2. 信号优化:可以考虑加入成交量确认,提高突破信号的可靠性。
|
|||
|
|
3. 止盈止损优化:可以实现动态调整的盈亏比,根据市场波动性调整目标。
|
|||
|
|
4. 时间过滤:增加交易时间窗口过滤,避免在不利时段交易。
|
|||
|
|
|
|||
|
|
#### 总结
|
|||
|
|
这是一个结构完整、逻辑清晰的量化交易策略。通过将波动率突破、趋势跟踪和动量确认相结合,在控制风险的同时捕捉显著的价格波动。策略的可定制性强,适合进一步优化以适应不同的交易品种和市场环境。建议在实盘之前进行充分的参数优化和回测验证。 ||
|
|||
|
|
|
|||
|
|
#### Overview
|
|||
|
|
This strategy is a quantitative trading system that combines volatility breakout, trend following, and momentum confirmation. It identifies trading opportunities by calculating ATR-based dynamic breakthrough levels combined with EMA trend filtering and RSI momentum indicators. The strategy employs strict risk control measures, including fixed percentage risk management and dynamic stop-loss settings.
|
|||
|
|
|
|||
|
|
#### Strategy Principles
|
|||
|
|
The strategy consists of three core components:
|
|||
|
|
1. Volatility Breakout Calculation: Uses highest and lowest prices within the lookback period, combined with ATR multiplier to calculate dynamic breakthrough thresholds, avoiding look-ahead bias.
|
|||
|
|
2. Trend Filtering: Uses short-term EMA to determine current trend direction, only taking long positions above EMA and short positions below EMA.
|
|||
|
|
3. Momentum Confirmation: Uses RSI indicator to confirm market momentum, requiring RSI above 50 for long entries and below 50 for short entries.
|
|||
|
|
|
|||
|
|
#### Strategy Advantages
|
|||
|
|
1. Dynamic Adaptability: Breakthrough levels automatically adjust based on market volatility, allowing the strategy to adapt to different market environments.
|
|||
|
|
2. Multiple Filters: Combines trend and momentum indicators to reduce false signals.
|
|||
|
|
3. Strict Risk Control: Uses fixed risk percentage for position management and dynamic stop-loss protection.
|
|||
|
|
4. High Customizability: Key parameters such as ATR period, breakthrough multiplier, EMA period can be adjusted according to specific needs.
|
|||
|
|
|
|||
|
|
#### Strategy Risks
|
|||
|
|
1. Lag Risk: Using moving averages may lead to delayed entry points.
|
|||
|
|
2. Sideways Market Risk: May generate frequent false breakthrough signals in ranging markets.
|
|||
|
|
3. Parameter Sensitivity: Strategy performance is sensitive to parameter settings, requiring thorough testing.
|
|||
|
|
Solutions:
|
|||
|
|
- Recommend backtesting and optimization under different market conditions
|
|||
|
|
- Can add market environment recognition module
|
|||
|
|
- Suggest adopting more conservative money management approach
|
|||
|
|
|
|||
|
|
#### Optimization Directions
|
|||
|
|
1. Market Environment Adaptation: Add volatility range judgment, using different parameter settings in different volatility environments.
|
|||
|
|
2. Signal Optimization: Consider adding volume confirmation to improve breakthrough signal reliability.
|
|||
|
|
3. Stop Profit/Loss Optimization: Implement dynamically adjusting risk-reward ratio based on market volatility.
|
|||
|
|
4. Time Filtering: Add trading time window filters to avoid trading during unfavorable periods.
|
|||
|
|
|
|||
|
|
#### Summary
|
|||
|
|
This is a well-structured quantitative trading strategy with clear logic. By combining volatility breakout, trend following, and momentum confirmation, it captures significant price movements while controlling risk. The strategy's high customizability makes it suitable for further optimization to adapt to different trading instruments and market environments. It is recommended to conduct thorough parameter optimization and backtesting before live trading.[/trans]
|
|||
|
|
|
|||
|
|
|
|||
|
|
|
|||
|
|
> Source (PineScript)
|
|||
|
|
|
|||
|
|
``` pinescript
|
|||
|
|
/*backtest
|
|||
|
|
start: 2025-01-20 00:00:00
|
|||
|
|
end: 2025-02-19 00:00:00
|
|||
|
|
period: 10m
|
|||
|
|
basePeriod: 10m
|
|||
|
|
exchanges: [{"eid":"Binance","currency":"ETH_USDT"}]
|
|||
|
|
*/
|
|||
|
|
|
|||
|
|
//@version=5
|
|||
|
|
// Volatility Momentum Breakout Strategy
|
|||
|
|
//
|
|||
|
|
// Description:
|
|||
|
|
// This strategy is designed to capture significant price moves by combining a volatility breakout method
|
|||
|
|
// with a momentum filter. Volatility is measured by the Average True Range (ATR), which is used to set dynamic
|
|||
|
|
// breakout levels. A short‑term Exponential Moving Average (EMA) is applied as a trend filter, and the Relative
|
|||
|
|
// Strength Index (RSI) is used to help avoid entries when the market is overextended.
|
|||
|
|
//
|
|||
|
|
// Signal Logic:
|
|||
|
|
// • Long Entry: When the current close is above the highest high of the previous N bars (excluding the current bar)
|
|||
|
|
// plus a multiple of ATR, provided that the price is above the short‑term EMA and the RSI is above 50.
|
|||
|
|
// • Short Entry: When the current close is below the lowest low of the previous N bars (excluding the current bar)
|
|||
|
|
// minus a multiple of ATR, provided that the price is below the short‑term EMA and the RSI is below 50.
|
|||
|
|
//
|
|||
|
|
// Risk Management:
|
|||
|
|
// • Trades are sized to risk 2% of account equity.
|
|||
|
|
// • A stop loss is placed at a fixed ATR multiple away from the entry price.
|
|||
|
|
// • A take profit target is set to achieve a 1:2 risk‑reward ratio.
|
|||
|
|
//
|
|||
|
|
// Backtesting Parameters:
|
|||
|
|
// • Initial Capital: $10,000
|
|||
|
|
// • Commission: 0.1% per trade
|
|||
|
|
// • Slippage: 1 tick per bar
|
|||
|
|
//
|
|||
|
|
// Disclaimer:
|
|||
|
|
// Past performance is not indicative of future results. This strategy is experimental and provided solely for educational
|
|||
|
|
// purposes. Always backtest and paper trade before any live deployment.
|
|||
|
|
//
|
|||
|
|
// Author: [Your Name]
|
|||
|
|
// Date: [Date]
|
|||
|
|
|
|||
|
|
strategy("Volatility Momentum Breakout Strategy", overlay=true, initial_capital=10000, default_qty_type=strategy.percent_of_equity, default_qty_value=5, commission_type=strategy.commission.percent, commission_value=0.1, slippage=1)
|
|||
|
|
|
|||
|
|
// ─── INPUTS ─────────────────────────────────────────────────────────────
|
|||
|
|
atrPeriod = input.int(14, "ATR Period", minval=1)
|
|||
|
|
atrMultiplier = input.float(1.5, "ATR Multiplier for Breakout", step=0.1)
|
|||
|
|
lookback = input.int(20, "Breakout Lookback Period", minval=1)
|
|||
|
|
emaPeriod = input.int(50, "EMA Period", minval=1)
|
|||
|
|
rsiPeriod = input.int(14, "RSI Period", minval=1)
|
|||
|
|
rsiLongThresh = input.float(50, "RSI Long Threshold", step=0.1)
|
|||
|
|
rsiShortThresh = input.float(50, "RSI Short Threshold", step=0.1)
|
|||
|
|
|
|||
|
|
// Risk management inputs:
|
|||
|
|
riskPercent = input.float(2.0, "Risk Percent per Trade (%)", step=0.1) * 0.01 // 2% risk per trade
|
|||
|
|
riskReward = input.float(2.0, "Risk-Reward Ratio", step=0.1) // Target profit is 2x risk
|
|||
|
|
atrStopMult = input.float(1.0, "ATR Multiplier for Stop Loss", step=0.1) // Stop loss distance in ATRs
|
|||
|
|
|
|||
|
|
// ─── INDICATOR CALCULATIONS ───────────────────────────────────────────────
|
|||
|
|
atrVal = ta.atr(atrPeriod)
|
|||
|
|
emaVal = ta.ema(close, emaPeriod)
|
|||
|
|
rsiVal = ta.rsi(close, rsiPeriod)
|
|||
|
|
|
|||
|
|
// Calculate breakout levels using the highest high and lowest low of the previous N bars,
|
|||
|
|
// excluding the current bar (to avoid look-ahead bias).
|
|||
|
|
highestHigh = ta.highest(high[1], lookback)
|
|||
|
|
lowestLow = ta.lowest(low[1], lookback)
|
|||
|
|
|
|||
|
|
// Define breakout thresholds.
|
|||
|
|
longBreakoutLevel = highestHigh + atrMultiplier * atrVal
|
|||
|
|
shortBreakoutLevel = lowestLow - atrMultiplier * atrVal
|
|||
|
|
|
|||
|
|
// ─── SIGNAL LOGIC ─────────────────────────────────────────────────────────
|
|||
|
|
// Long Entry: Price closes above the long breakout level,
|
|||
|
|
// the close is above the EMA, and RSI > 50.
|
|||
|
|
longCondition = (close > longBreakoutLevel) and (close > emaVal) and (rsiVal > rsiLongThresh)
|
|||
|
|
// Short Entry: Price closes below the short breakout level,
|
|||
|
|
// the close is below the EMA, and RSI < 50.
|
|||
|
|
shortCondition = (close < shortBreakoutLevel) and (close < emaVal) and (rsiVal < rsiShortThresh)
|
|||
|
|
|
|||
|
|
if (longCondition)
|
|||
|
|
strategy.entry("Long", strategy.long)
|
|||
|
|
if (shortCondition)
|
|||
|
|
strategy.entry("Short", strategy.short)
|
|||
|
|
|
|||
|
|
// ─── RISK MANAGEMENT ──────────────────────────────────────────────────────
|
|||
|
|
// For each new trade, use the entry price as the basis for stop loss and target calculations.
|
|||
|
|
// We assume the entry price equals the close on the bar where the trade is triggered.
|
|||
|
|
var float longEntryPrice = na
|
|||
|
|
var float shortEntryPrice = na
|
|||
|
|
|
|||
|
|
// Record entry prices when a trade is opened.
|
|||
|
|
if (strategy.position_size > 0 and na(longEntryPrice))
|
|||
|
|
longEntryPrice := strategy.position_avg_price
|
|||
|
|
if (strategy.position_size < 0 and na(shortEntryPrice))
|
|||
|
|
shortEntryPrice := strategy.position_avg_price
|
|||
|
|
|
|||
|
|
// Calculate stop loss and take profit levels based on ATR.
|
|||
|
|
longStop = longEntryPrice - atrStopMult * atrVal
|
|||
|
|
longTarget = longEntryPrice + (longEntryPrice - longStop) * riskReward
|
|||
|
|
shortStop = shortEntryPrice + atrStopMult * atrVal
|
|||
|
|
shortTarget= shortEntryPrice - (shortStop - shortEntryPrice) * riskReward
|
|||
|
|
|
|||
|
|
// Issue exit orders if a position is open.
|
|||
|
|
if (strategy.position_size > 0 and not na(longEntryPrice))
|
|||
|
|
strategy.exit("Long Exit", from_entry="Long", stop=longStop, limit=longTarget)
|
|||
|
|
if (strategy.position_size < 0 and not na(shortEntryPrice))
|
|||
|
|
strategy.exit("Short Exit", from_entry="Short", stop=shortStop, limit=shortTarget)
|
|||
|
|
|
|||
|
|
// Reset recorded entry prices when the position is closed.
|
|||
|
|
if (strategy.position_size == 0)
|
|||
|
|
longEntryPrice := na
|
|||
|
|
shortEntryPrice := na
|
|||
|
|
|
|||
|
|
// ─── CHART VISUAL AIDS ─────────────────────────────────────────────────────
|
|||
|
|
// Plot the breakout levels and EMA.
|
|||
|
|
plot(longBreakoutLevel, color=color.new(color.green, 0), title="Long Breakout Level", style=plot.style_linebr)
|
|||
|
|
plot(shortBreakoutLevel, color=color.new(color.red, 0), title="Short Breakout Level", style=plot.style_linebr)
|
|||
|
|
plot(emaVal, color=color.blue, title="EMA")
|
|||
|
|
|
|||
|
|
// Optionally, shade the background: green when price is above the EMA (bullish) and red when below.
|
|||
|
|
bgcolor(close > emaVal ? color.new(color.green, 90) : color.new(color.red, 90), title="Trend Background")
|
|||
|
|
```
|
|||
|
|
|
|||
|
|
> Detail
|
|||
|
|
|
|||
|
|
https://www.fmz.com/strategy/482848
|
|||
|
|
|
|||
|
|
> Last Modified
|
|||
|
|
|
|||
|
|
2025-02-20 15:13:31
|