173 lines
11 KiB
Markdown
173 lines
11 KiB
Markdown

|
|
||
|
|
> Name
|
||
|
|
|
||
|
|
斐波那契黄金分割回撤买入策略-Fibonacci-Golden-Ratio-Retracement-Buying-Strategy
|
||
|
|
|
||
|
|
> Author
|
||
|
|
|
||
|
|
ChaoZhang
|
||
|
|
|
||
|
|
> Strategy Description
|
||
|
|
|
||
|
|
|
||
|
|
|
||
|
|
[trans]
|
||
|
|
#### 概述
|
||
|
|
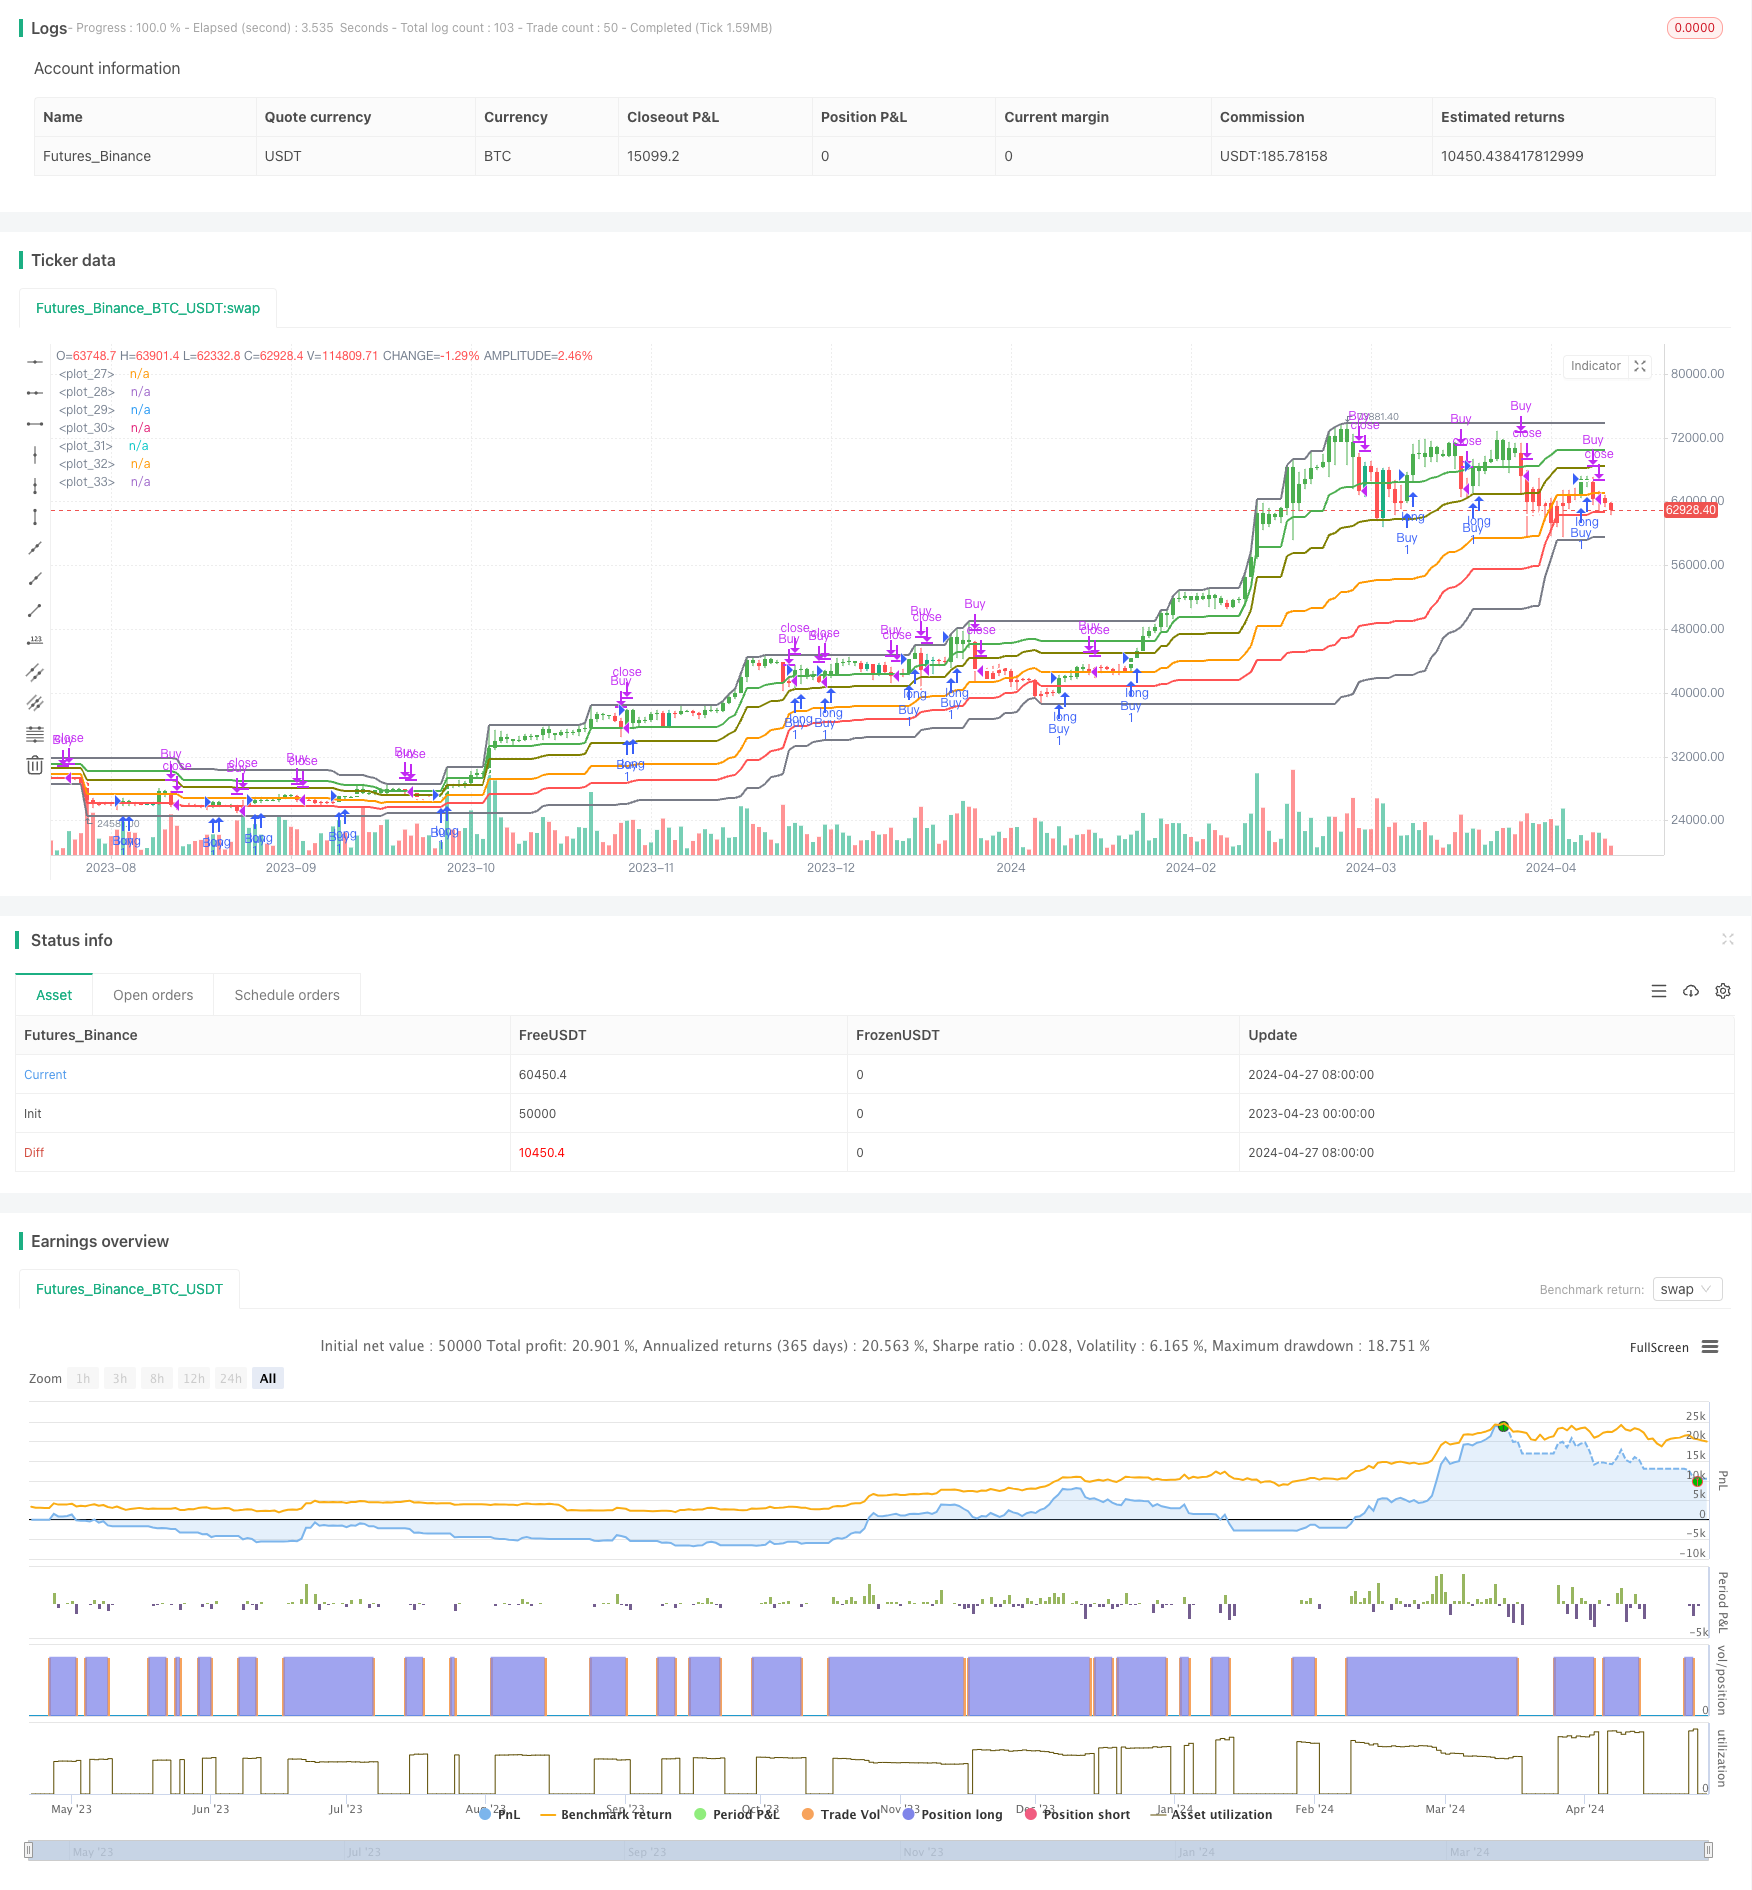
斐波那契黄金分割回撤买入策略是一种基于斐波那契回撤水平和趋势跟踪止损的交易策略。该策略利用斐波那契回撤水平作为潜在的支撑位和阻力位,并结合趋势跟踪止损来确定买入和卖出时机。当价格在上涨趋势中回撤到某个斐波那契水平并且高于趋势跟踪止损时,策略会发出买入信号;当价格跌破趋势跟踪止损或某个斐波那契水平时,策略会发出卖出信号。
|
||
|
|
|
||
|
|
#### 策略原理
|
||
|
|
1. 计算斐波那契回撤水平:根据指定价格区间内的最高价和最低价,计算出0%、23.6%、38.2%、50%、61.8%和78.6%等斐波那契回撤水平。
|
||
|
|
2. 识别摆动高点和低点:在指定数量的交易周期内,识别价格的摆动高点和低点。
|
||
|
|
3. 计算趋势跟踪止损:根据当前收盘价是高于前一个摆动高点还是低于前一个摆动低点,计算出趋势跟踪止损价格。
|
||
|
|
4. 定义买入和卖出条件:当收盘价高于趋势跟踪止损并且高于某个斐波那契回撤水平时,生成买入信号;当收盘价低于趋势跟踪止损并且低于某个斐波那契回撤水平时,生成卖出信号。
|
||
|
|
5. 执行交易:当买入条件满足时,策略进入多头仓位;当卖出条件满足时,策略平仓。
|
||
|
|
|
||
|
|
#### 策略优势
|
||
|
|
1. 结合技术分析和趋势跟踪:该策略利用斐波那契回撤水平作为潜在的支撑位和阻力位,同时结合趋势跟踪止损,能够有效捕捉趋势性机会并控制风险。
|
||
|
|
2. 适应不同市场状况:斐波那契回撤水平在不同的市场条件下都有一定的适用性,可以在上涨趋势和下跌趋势中为交易提供参考。
|
||
|
|
3. 明确的进场和出场条件:策略基于明确的买入和卖出条件,有助于交易者做出客观决策,避免主观情绪的影响。
|
||
|
|
|
||
|
|
#### 策略风险
|
||
|
|
1. 市场波动风险:在市场剧烈波动的情况下,价格可能会快速突破斐波那契回撤水平和趋势跟踪止损,导致策略出现失误或止损过多。
|
||
|
|
2. 参数设置风险:策略的表现依赖于斐波那契回撤水平和趋势跟踪止损的参数设置,不恰当的参数可能导致策略表现不佳。
|
||
|
|
3. 趋势识别风险:策略假设价格运动遵循趋势,但在实际市场中,价格可能出现震荡或反转,导致趋势识别出现误判。
|
||
|
|
|
||
|
|
#### 策略优化方向
|
||
|
|
1. 结合其他技术指标:可以考虑将斐波那契回撤水平与其他技术指标(如移动平均线、相对强弱指数等)结合使用,提高策略的可靠性。
|
||
|
|
2. 动态调整参数:根据市场状况的变化,动态调整斐波那契回撤水平和趋势跟踪止损的参数,以适应不同的市场环境。
|
||
|
|
3. 引入风险管理措施:在策略中引入风险管理措施,如仓位管理、止损管理等,以控制潜在的风险敞口。
|
||
|
|
|
||
|
|
#### 总结
|
||
|
|
斐波那契黄金分割回撤买入策略是一种结合斐波那契回撤水平和趋势跟踪止损的交易策略。该策略利用斐波那契回撤水平作为潜在的支撑位和阻力位,并结合趋势跟踪止损来确定买入和卖出时机。策略的优势在于结合技术分析和趋势跟踪,适应不同市场状况,并提供明确的进场和出场条件。然而,策略也面临市场波动风险、参数设置风险和趋势识别风险。为了优化策略表现,可以考虑结合其他技术指标、动态调整参数以及引入风险管理措施。
|
||
|
|
|
||
|
|
||
|
||
|
|
|
||
|
|
#### Overview
|
||
|
|
The Fibonacci Golden Ratio Retracement Buying Strategy is a trading strategy based on Fibonacci retracement levels and trend-following stop-loss. The strategy utilizes Fibonacci retracement levels as potential support and resistance levels and combines them with a trailing stop loss to determine buying and selling opportunities. When the price retraces to a certain Fibonacci level during an uptrend and is above the trailing stop loss, the strategy generates a buy signal. When the price falls below the trailing stop loss or a certain Fibonacci level, the strategy generates a sell signal.
|
||
|
|
|
||
|
|
#### Strategy Principle
|
||
|
|
1. Calculation of Fibonacci Retracement Levels: Based on the highest high and lowest low within a specified price range, the strategy calculates Fibonacci retracement levels at 0%, 23.6%, 38.2%, 50%, 61.8%, and 78.6%.
|
||
|
|
2. Identification of Swing Highs and Lows: The strategy identifies swing highs and lows within a specified number of trading periods.
|
||
|
|
3. Calculation of Trailing Stop Loss: Based on whether the current close price is above the previous swing high or below the previous swing low, the strategy calculates the trailing stop loss price.
|
||
|
|
4. Definition of Buy and Sell Conditions: When the close price is above the trailing stop loss and above a certain Fibonacci retracement level, a buy signal is generated. When the close price is below the trailing stop loss and below a certain Fibonacci retracement level, a sell signal is generated.
|
||
|
|
5. Trade Execution: When the buy condition is met, the strategy enters a long position. When the sell condition is met, the strategy closes the position.
|
||
|
|
|
||
|
|
#### Strategy Advantages
|
||
|
|
1. Combination of Technical Analysis and Trend Following: The strategy utilizes Fibonacci retracement levels as potential support and resistance levels while incorporating a trailing stop loss, effectively capturing trending opportunities and managing risk.
|
||
|
|
2. Adaptability to Different Market Conditions: Fibonacci retracement levels have applicability in various market conditions and can provide reference for trading in both uptrends and downtrends.
|
||
|
|
3. Clear Entry and Exit Rules: The strategy is based on well-defined buy and sell conditions, helping traders make objective decisions and avoid subjective emotional influences.
|
||
|
|
|
||
|
|
#### Strategy Risks
|
||
|
|
1. Market Volatility Risk: In highly volatile market conditions, prices may quickly break through Fibonacci retracement levels and the trailing stop loss, leading to strategy errors or excessive stop-outs.
|
||
|
|
2. Parameter Setting Risk: The performance of the strategy depends on the parameter settings for Fibonacci retracement levels and the trailing stop loss. Inappropriate parameters may result in suboptimal strategy performance.
|
||
|
|
3. Trend Identification Risk: The strategy assumes that price movements follow trends, but in real markets, prices may exhibit fluctuations or reversals, leading to misjudgments in trend identification.
|
||
|
|
|
||
|
|
#### Strategy Optimization Directions
|
||
|
|
1. Integration with Other Technical Indicators: Consider combining Fibonacci retracement levels with other technical indicators (such as moving averages, relative strength index, etc.) to enhance the reliability of the strategy.
|
||
|
|
2. Dynamic Parameter Adjustment: Dynamically adjust the parameters for Fibonacci retracement levels and the trailing stop loss based on changing market conditions to adapt to different market environments.
|
||
|
|
3. Introduction of Risk Management Measures: Incorporate risk management measures into the strategy, such as position sizing and stop-loss management, to control potential risk exposure.
|
||
|
|
|
||
|
|
#### Summary
|
||
|
|
The Fibonacci Golden Ratio Retracement Buying Strategy is a trading strategy that combines Fibonacci retracement levels with a trailing stop loss. The strategy utilizes Fibonacci retracement levels as potential support and resistance levels and incorporates a trailing stop loss to determine buying and selling opportunities. The advantages of the strategy lie in its combination of technical analysis and trend following, adaptability to different market conditions, and clear entry and exit rules. However, the strategy also faces risks such as market volatility risk, parameter setting risk, and trend identification risk. To optimize strategy performance, considerations include integrating other technical indicators, dynamically adjusting parameters, and introducing risk management measures.
|
||
|
|
[/trans]
|
||
|
|
|
||
|
|
> Strategy Arguments
|
||
|
|
|
||
|
|
|
||
|
|
|
||
|
|
|Argument|Default|Description|
|
||
|
|
|----|----|----|
|
||
|
|
|v_input_1|false|Fibonacci 0% Level|
|
||
|
|
|v_input_2|true|Fibonacci 1% Level|
|
||
|
|
|v_input_3|0.236|Fibonacci 23.6% Level|
|
||
|
|
|v_input_4|0.382|Fibonacci 38.2% Level|
|
||
|
|
|v_input_5|0.5|Fibonacci 50% Level|
|
||
|
|
|v_input_6|0.618|Fibonacci 61.8% Level|
|
||
|
|
|v_input_7|0.786|Fibonacci 78.6% Level|
|
||
|
|
|v_input_8|50|Price|
|
||
|
|
|v_input_9|true|Swing|
|
||
|
|
|
||
|
|
|
||
|
|
> Source (PineScript)
|
||
|
|
|
||
|
|
``` pinescript
|
||
|
|
/*backtest
|
||
|
|
start: 2023-04-23 00:00:00
|
||
|
|
end: 2024-04-28 00:00:00
|
||
|
|
period: 1d
|
||
|
|
basePeriod: 1h
|
||
|
|
exchanges: [{"eid":"Futures_Binance","currency":"BTC_USDT"}]
|
||
|
|
*/
|
||
|
|
|
||
|
|
//@version=5
|
||
|
|
strategy(title='Fibonacci BFSP', overlay=true)
|
||
|
|
|
||
|
|
// Define Fibonacci retracement levels
|
||
|
|
fib0 = input(0, title="Fibonacci 0% Level")
|
||
|
|
fib1 = input(1, title="Fibonacci 1% Level")
|
||
|
|
fib23 = input(0.236, title="Fibonacci 23.6% Level")
|
||
|
|
fib38 = input(0.382, title="Fibonacci 38.2% Level")
|
||
|
|
fib50 = input(0.5, title="Fibonacci 50% Level")
|
||
|
|
fib61 = input(0.618, title="Fibonacci 61.8% Level")
|
||
|
|
fib78 = input(0.786, title="Fibonacci 78.6% Level")
|
||
|
|
Price = input(50, title="Price")
|
||
|
|
|
||
|
|
// Calculate Fibonacci levels
|
||
|
|
priceHigh = ta.highest(high, Price)
|
||
|
|
priceLow = ta.lowest(low, Price)
|
||
|
|
priceRange = priceHigh - priceLow
|
||
|
|
fibRetracement0 = priceHigh - fib0 * priceRange
|
||
|
|
fibRetracement1 = priceHigh - fib1 * priceRange
|
||
|
|
fibRetracement23 = priceHigh - fib23 * priceRange
|
||
|
|
fibRetracement38 = priceHigh - fib38 * priceRange
|
||
|
|
fibRetracement50 = priceHigh - fib50 * priceRange
|
||
|
|
fibRetracement61 = priceHigh - fib61 * priceRange
|
||
|
|
fibRetracement78 = priceHigh - fib78 * priceRange
|
||
|
|
|
||
|
|
// Plot Fibonacci retracement levels
|
||
|
|
plot(fibRetracement0, color=color.gray, linewidth=2)
|
||
|
|
plot(fibRetracement1, color=color.gray, linewidth=2)
|
||
|
|
plot(fibRetracement23, color=color.green, linewidth=2)
|
||
|
|
plot(fibRetracement38, color=color.olive, linewidth=2)
|
||
|
|
plot(fibRetracement50, color=color.white, linewidth=2)
|
||
|
|
plot(fibRetracement61, color=color.orange, linewidth=2)
|
||
|
|
plot(fibRetracement78, color=color.red, linewidth=2)
|
||
|
|
|
||
|
|
// Inputs
|
||
|
|
no = input(1, title="Swing")
|
||
|
|
|
||
|
|
// Calculate swing highs and lows
|
||
|
|
res = ta.highest(high, no)
|
||
|
|
sup = ta.lowest(low, no)
|
||
|
|
|
||
|
|
// Calculate trailing stop loss
|
||
|
|
avd = close > res[1] ? 1 : close < sup[1] ? -1 : 0
|
||
|
|
avn = ta.valuewhen(avd != 0, avd, 0)
|
||
|
|
tsl = avn == 1 ? sup : res
|
||
|
|
|
||
|
|
// Define buy and sell conditions
|
||
|
|
buyCondition = (close > tsl) and (close > fibRetracement23 or close > fibRetracement38 or close > fibRetracement50 or close > fibRetracement61 or close > fibRetracement78)
|
||
|
|
sellCondition = (close < tsl) and (close < fibRetracement23 or close < fibRetracement38 or close < fibRetracement50 or close < fibRetracement61 or close < fibRetracement78)
|
||
|
|
|
||
|
|
// Entry strategy
|
||
|
|
if (buyCondition)
|
||
|
|
strategy.entry("Buy", strategy.long)
|
||
|
|
|
||
|
|
// Exit strategy
|
||
|
|
if (sellCondition)
|
||
|
|
strategy.close("Buy")
|
||
|
|
|
||
|
|
// Color bars based on buy and sell conditions
|
||
|
|
barColor = buyCondition ? color.green : sellCondition ? color.red : na
|
||
|
|
barcolor(barColor)
|
||
|
|
|
||
|
|
```
|
||
|
|
|
||
|
|
> Detail
|
||
|
|
|
||
|
|
https://www.fmz.com/strategy/449846
|
||
|
|
|
||
|
|
> Last Modified
|
||
|
|
|
||
|
|
2024-04-29 17:08:07
|