2023-12-11 09:35:59 +08:00
> Name
折线交易策略Trend-Line-Trading-Strategy
> Author
ChaoZhang
> Strategy Description
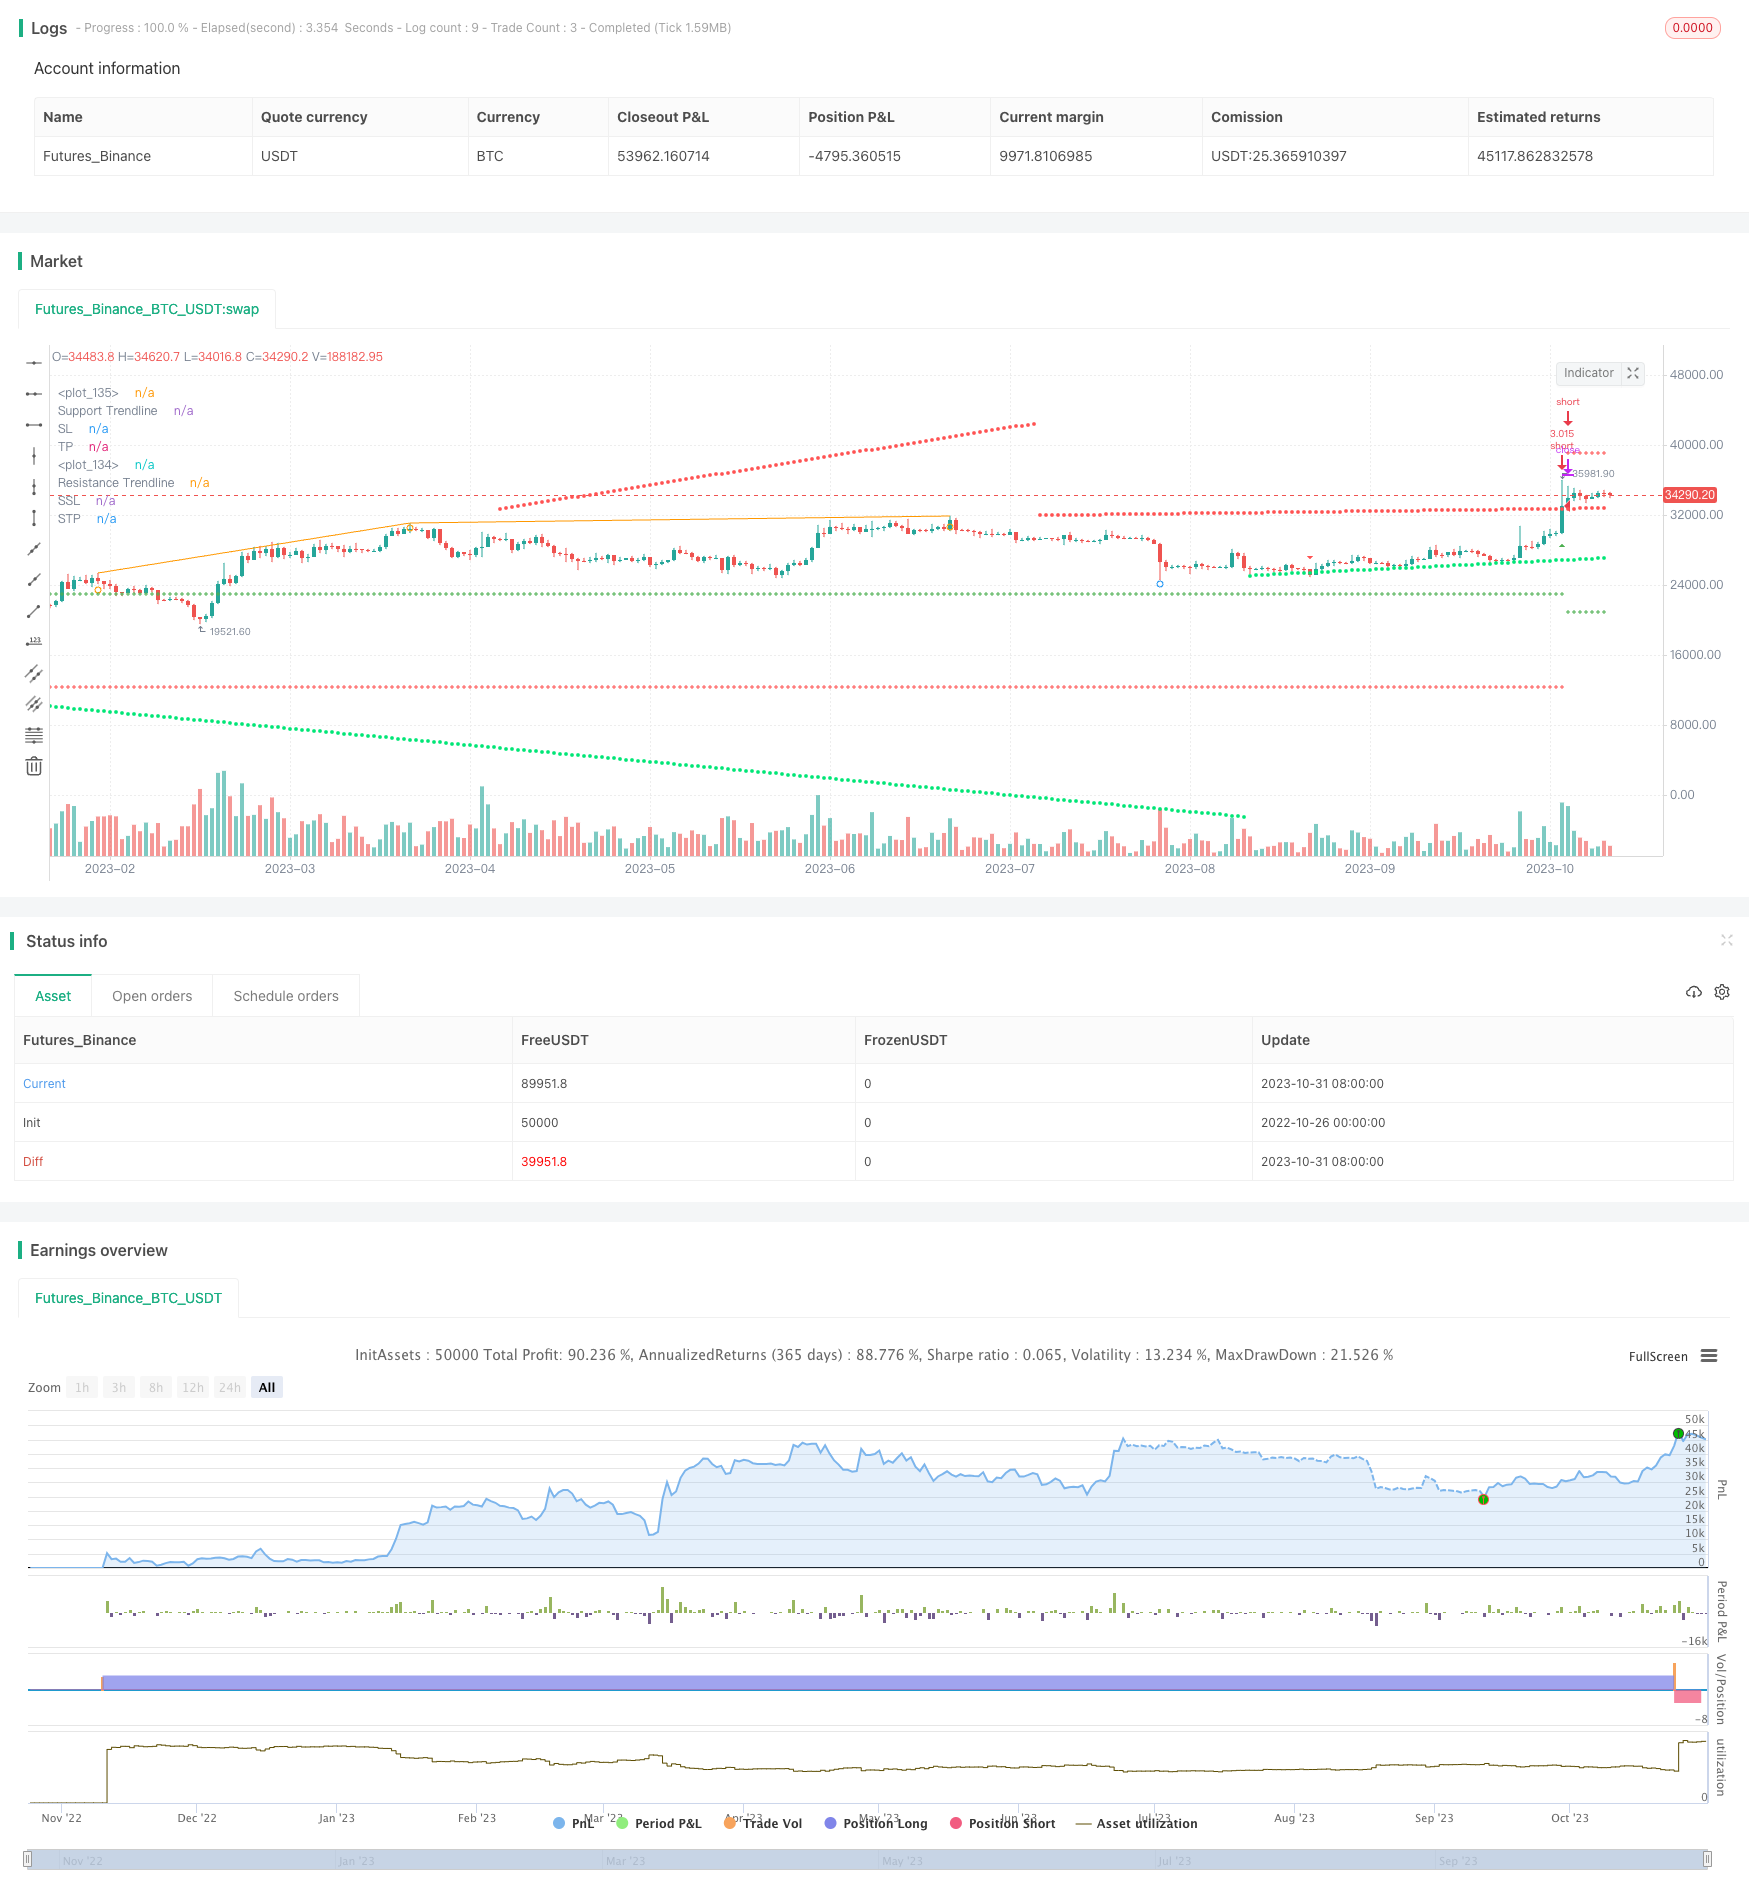
[trans]
## 概述
该策略基于突破关键支撑和阻力的思想,通过识别价格图表中的关键上升趋势线和下降趋势线,在价格突破趋势线时进行交易。策略简单可靠,适用于趋势明确的市场环境。
## 策略原理
该策略通过计算左侧和右侧柱形线的高点和低点,识别价格上升和下降的关键点,从而得到支撑线和压力线。 Specifically:
1. 使用`pivothigh()` 和`pivotlow()` 函数检测关键高点和低点。
2. 根据高低点绘制支撑线和压力线的方程。
3. 当价格突破压力线时,做多;当价格突破支撑线时,做空。
4. 根据趋势方向选择做多或做空。
5. 可选择是否在突破时直接平仓换向。
6. 可选择使用止损、止盈、尾随止损。
7. 可选择Swing点止损、ATR止损、固定止损。
该策略通过简单的趋势线据突破交易,兼顾趋势跟踪和趋势反转,简单实用。
## 优势分析
- 策略较为简单,容易理解和实现。
- 利用突破 Theory,有一定的概率优势。
- 可设定止损止盈,控制风险。
- 可实现趋势跟踪或趋势反转。
- 可优化参数,适用于不同市场环境。
## 风险分析
- 突破信号可能存在误报。
- 止损点设置不当可能增加亏损。
- 反转操作存在被套的风险。
- parameter tuning需要经验,不当设置可能失效。
- 纯趋势突破,对震荡行情不适用。
可以通过优化止损策略、评估突破信号质量、评估反转时机等方法降低风险。
## 优化方向
- 评估突破信号的可靠性,提高准确率。
- 结合volume,加强突破信号。
- 优化止损策略,适应市场波动。
- 评估最佳反转时机。
- parameter tuning。
- 评估多因子模型。
- 评估与其他indicator的结合使用。
## 总结
该策略整体简单实用,通过简单的趋势突破来捕捉价格趋势,可控的风险。策略可以通过多方面优化,适用于更多市场情况,整体是一个非常实用的趋势跟踪策略。
||
## Overview
This strategy is based on the idea of breaking through key support and resistance levels by identifying key uptrend and downtrend lines in price charts and trading when the price breaks through trend lines. The strategy is simple and reliable, suitable for market environments with clear trends.
## Strategy Principle
The strategy identifies key high and low points to obtain support and resistance lines by calculating the highs and lows of the left and right bar lines. Specifically:
1. Use `pivothigh()` and `pivotlow()` functions to detect key highs and lows.
2. Derive equations for support and resistance lines based on highs and lows.
3. Go long when the price breaks above resistance; go short when the price breaks below support.
4. Choose long or short based on trend direction.
5. Option to reverse position directly when breakout occurs.
6. Option to use stop loss, take profit, trailing stop loss.
7. Option for swing point stop loss, ATR stop loss, fixed stop loss.
The strategy trades simply based on trend line breakouts, balancing trend following and reversal, simple and practical.
## Advantage Analysis
- The strategy is relatively simple, easy to understand and implement.
- Utilizes breakout theory, has some probability edge.
- Can set stop loss and take profit to control risk.
- Can implement trend following or reversal.
- Optimizable parameters suit different market environments.
## Risk Analysis
- Breakout signals may have false signals.
- Improper stop loss placement may increase losses.
- Reversal trades risk being trapped.
- Parameter tuning needs experience, improper settings may fail.
- Pure trend breakout not suitable for range-bound market.
Risks can be reduced via optimizing stop loss strategy, evaluating signal quality, assessing reversal timing etc.
## Optimization Directions
- Evaluate breakout signal reliability to improve accuracy.
- Incorporate volume to strengthen signals.
- Optimize stop loss for market volatility.
- Assess optimal reversal timing.
- Parameter tuning.
- Evaluate multifactor models.
- Evaluate combining with other indicators.
## Summary
The strategy is simple and practical overall, capturing price trends through simple trend breakouts and manageable risks. It can be optimized across multiple dimensions to suit more market conditions, an very practical trend following strategy overall.
[/trans]
> Strategy Arguments
|Argument|Default|Description|
|----|----|----|
|v_input_1|false|Strategy Direction|
|v_input_2|true|-----------------Strategy Inputs-------------------|
|v_input_3|100|Pivot Detection: Left Bars|
|v_input_4|15|Pivot Detection: Right Bars|
|v_input_5|true|Plot Pivots|
|v_input_6|true|-----------------General Inputs-------------------|
|v_input_7|true|Use Stop Loss and Take Profit|
|v_input_8|false|Use Trailing Stop|
|v_input_9|0|Type Of Stop: ATR Stop|Swing Lo/Hi|Strategy Stop|
|v_input_10|10|Swing Point Lookback|
|v_input_11|3|Swing Point SL Perc Increment|
|v_input_12|14|ATR Length|
|v_input_13|4|ATR Multiple|
|v_input_14|2|Take Profit Risk Reward Ratio|
|v_input_15|true|Allow Direct Position Reverse|
|v_input_16|true|Reverse Trades|
> Source (PineScript)
2024-03-03 22:27:55 +08:00
``` pinescript
2023-12-11 09:35:59 +08:00
/*backtest
start: 2022-10-26 00:00:00
end: 2023-11-01 00:00:00
period: 1d
basePeriod: 1h
exchanges: [{"eid":"Futures_Binance","currency":"BTC_USDT"}]
*/
// This source code is subject to the terms of the Mozilla Public License 2.0 at https://mozilla.org/MPL/2.0/
// © tweakerID and © BacktestRookies
// Using the clever calculations and code by BacktestRookies, here is a strategy that buys
// when the price breaks above a trendline and sells (or shorts) when it crosses below.
// This logic can be reversed, which seems to work better with recent market conditions.
//@version=4
strategy("Trendlines Strategy",
overlay=true,
default_qty_type=strategy.percent_of_equity,
default_qty_value=100,
initial_capital=10000,
commission_value=0.04,
calc_on_every_tick=false,
slippage=0)
direction = input(0, title = "Strategy Direction", type=input.integer, minval=-1, maxval=1)
strategy.risk.allow_entry_in(direction == 0 ? strategy.direction.all :
(direction < 0 ? strategy.direction.short : strategy.direction.long))
// Bought and Sold Boolean Signal
bought = strategy.position_size > strategy.position_size[1]
or strategy.position_size < strategy.position_size[1]
/////////////////////// STRATEGY INPUTS ////////////////////////////////////////
title1=input(true, "-----------------Strategy Inputs-------------------")
leftbars = input(100, minval=1, title='Pivot Detection: Left Bars')
rightbars = input(15, minval=1, title='Pivot Detection: Right Bars')
plotpivots = input(true, title='Plot Pivots')
/////////////////////// BACKTESTER /////////////////////////////////////////////
title2=input(true, "-----------------General Inputs-------------------")
// Backtester General Inputs
i_SL=input(true, title="Use Stop Loss and Take Profit")
TS=input(false, title="Use Trailing Stop")
i_SLType=input(defval="ATR Stop", title="Type Of Stop", options=["Strategy Stop", "Swing Lo/Hi", "ATR Stop"])
i_SPL=input(defval=10, title="Swing Point Lookback")
i_PercIncrement=input(defval=3, step=.1, title="Swing Point SL Perc Increment")*0.01
i_ATR = input(14, title="ATR Length")
i_ATRMult = input(4, step=.1, title="ATR Multiple")
i_TPRRR = input(2, step=.1, title="Take Profit Risk Reward Ratio")
DPR=input(true, "Allow Direct Position Reverse")
reverse=input(true, "Reverse Trades")
// Swing Points Stop and Take Profit
SwingStopProfit() =>
LL=(lowest(i_SPL))*(1-i_PercIncrement)
HH=(highest(i_SPL))*(1+i_PercIncrement)
LL_price = valuewhen(bought, LL, 0)
HH_price = valuewhen(bought, HH, 0)
entry_LL_price = strategy.position_size > 0 ? LL_price : na
entry_HH_price = strategy.position_size < 0 ? HH_price : na
tp=strategy.position_avg_price + (strategy.position_avg_price - entry_LL_price)*i_TPRRR
stp=strategy.position_avg_price - (entry_HH_price - strategy.position_avg_price)*i_TPRRR
[entry_LL_price, entry_HH_price, tp, stp]
// ATR Stop
ATRStop() =>
ATR=atr(i_ATR)*i_ATRMult
ATRLong = ohlc4 - ATR
ATRShort = ohlc4 + ATR
ATRLongStop = valuewhen(bought, ATRLong, 0)
ATRShortStop = valuewhen(bought, ATRShort, 0)
LongSL_ATR_price = strategy.position_size > 0 ? ATRLongStop : na
ShortSL_ATR_price = strategy.position_size < 0 ? ATRShortStop : na
ATRtp=strategy.position_avg_price + (strategy.position_avg_price - LongSL_ATR_price)*i_TPRRR
ATRstp=strategy.position_avg_price - (ShortSL_ATR_price - strategy.position_avg_price)*i_TPRRR
[LongSL_ATR_price, ShortSL_ATR_price, ATRtp, ATRstp]
// Strategy Stop
StrategyStop(bought) =>
float LongStop = na
float ShortStop = na
float StratTP = na
float StratSTP = na
[LongStop, ShortStop, StratTP, StratSTP]
//TrailingStop
TrailingStop(SL,SSL) =>
dif=(valuewhen(strategy.position_size>0 and strategy.position_size[1]<=0, high,0))
-strategy.position_avg_price
trailOffset = strategy.position_avg_price - SL
var tstop = float(na)
if strategy.position_size > 0
tstop := high- trailOffset - dif
if tstop<tstop[1]
tstop:=tstop[1]
else
tstop := na
StrailOffset = SSL - strategy.position_avg_price
var Ststop = float(na)
Sdif=strategy.position_avg_price-(valuewhen(strategy.position_size<0
and strategy.position_size[1]>=0, low,0))
if strategy.position_size < 0
Ststop := low+ StrailOffset + Sdif
if Ststop>Ststop[1]
Ststop:=Ststop[1]
else
Ststop := na
[tstop, Ststop]
//Stop Loss & Take Profit Switches
SLTPLogic(LongStop, ShortStop, StratTP, StratSTP, LongSL_ATR_price, ShortSL_ATR_price, ATRtp, ATRstp,
entry_LL_price, entry_HH_price, tp, stp) =>
SL= i_SLType == "Swing Lo/Hi" ? entry_LL_price : i_SLType == "ATR Stop" ? LongSL_ATR_price : LongStop
SSL= i_SLType == "Swing Lo/Hi" ? entry_HH_price : i_SLType == "ATR Stop" ? ShortSL_ATR_price : ShortStop
TP= i_SLType == "Swing Lo/Hi" ? tp : i_SLType == "ATR Stop" ? ATRtp : StratTP
STP= i_SLType == "Swing Lo/Hi" ? stp : i_SLType == "ATR Stop" ? ATRstp : StratSTP
[SL, SSL, TP, STP]
/////////////////////// STRATEGY LOGIC /////////////////////////////////////////
// Pivots
ph = pivothigh(high, leftbars, rightbars)
pl = pivotlow(low, leftbars, rightbars)
phv1 = valuewhen(ph, high[rightbars], 0)
phb1 = valuewhen(ph, bar_index[rightbars], 0)
phv2 = valuewhen(ph, high[rightbars], 1)
phb2 = valuewhen(ph, bar_index[rightbars], 1)
plv1 = valuewhen(pl, low[rightbars], 0)
plb1 = valuewhen(pl, bar_index[rightbars], 0)
plv2 = valuewhen(pl, low[rightbars], 1)
plb2 = valuewhen(pl, bar_index[rightbars], 1)
plotshape(ph, style=shape.circle, location=location.abovebar, color=color.orange, title='Pivot High', offset=-rightbars)
plotshape(pl, style=shape.circle, location=location.belowbar, color=color.blue, title='Pivot Low', offset=-rightbars)
plot(ph ? high[rightbars] : na, color=color.orange, offset=-rightbars)
plot(pl ? low[rightbars] : na, color=color.purple, offset=-rightbars)
// TRENDLINE CODE
// --------------
get_slope(x1,x2,y1,y2)=>
m = (y2-y1)/(x2-x1)
get_y_intercept(m, x1, y1)=>
b=y1-m*x1
get_y(m, b, ts)=>
Y = m * ts + b
int res_x1 = na
float res_y1 = na
int res_x2 = na
float res_y2 = na
int sup_x1 = na
float sup_y1 = na
int sup_x2 = na
float sup_y2 = na
// Resistance
res_x1 := ph ? phb1 : res_x1[1]
res_y1 := ph ? phv1 : res_y1[1]
res_x2 := ph ? phb2 : res_x2[1]
res_y2 := ph ? phv2 : res_y2[1]
res_m = get_slope(res_x1,res_x2,res_y1,res_y2)
res_b = get_y_intercept(res_m, res_x1, res_y1)
res_y = get_y(res_m, res_b, bar_index)
// Support
sup_x1 := pl ? plb1 : sup_x1[1]
sup_y1 := pl ? plv1 : sup_y1[1]
sup_x2 := pl ? plb2 : sup_x2[1]
sup_y2 := pl ? plv2 : sup_y2[1]
sup_m = get_slope(sup_x1,sup_x2,sup_y1,sup_y2)
sup_b = get_y_intercept(sup_m, sup_x1, sup_y1)
sup_y = get_y(sup_m, sup_b, bar_index)
// plot(line.get_y2(line1))
plot(res_y, color=color.red, title='Resistance Trendline', linewidth=2, style=plot.style_circles)
plot(sup_y, color=color.lime, title='Support Trendline', linewidth=2, style=plot.style_circles)
// if ph
// line.new(phb1,phv1, bar_index, res_y, style=line.style_dashed, color=color.blue)
// if pl
// line.new(plb1,plv1, bar_index, sup_y, style=line.style_dashed, color=color.blue)
// Breaks
long_break = crossover(close, res_y)
short_break = crossunder(close, sup_y)
plotshape(long_break, style=shape.triangleup, color=color.green, size=size.tiny, location=location.belowbar, title='Long Break')
plotshape(short_break, style=shape.triangledown, color=color.red, size=size.tiny, location=location.abovebar, title='Short Break')
BUY=long_break
SELL=short_break
/////////////////////// FUNCTION CALLS /////////////////////////////////////////
// Stops and Profits
[entry_LL_price, entry_HH_price, tp, stp] = SwingStopProfit()
[LongSL_ATR_price, ShortSL_ATR_price, ATRtp, ATRstp] = ATRStop()
[LongStop, ShortStop, StratTP, StratSTP] = StrategyStop(bought)
[SL, SSL, TP, STP] = SLTPLogic(LongStop, ShortStop, StratTP, StratSTP,
LongSL_ATR_price, ShortSL_ATR_price, ATRtp, ATRstp, entry_LL_price, entry_HH_price, tp, stp)
[tstop, Ststop] = TrailingStop(SL,SSL)
// Entries
if reverse
if not DPR
strategy.entry("long", strategy.long, when=SELL and strategy.position_size == 0)
strategy.entry("short", strategy.short, when=BUY and strategy.position_size == 0)
else
strategy.entry("long", strategy.long, when=SELL)
strategy.entry("short", strategy.short, when=BUY)
else
if not DPR
strategy.entry("long", strategy.long, when=BUY and strategy.position_size == 0)
strategy.entry("short", strategy.short, when=SELL and strategy.position_size == 0)
else
strategy.entry("long", strategy.long, when=BUY)
strategy.entry("short", strategy.short, when=SELL)
// Exits
if i_SL
strategy.exit("TP & SL", "long", limit=TP, stop=TS? tstop : SL)
strategy.exit("TP & SL", "short", limit=STP, stop=TS? Ststop : SSL)
/////////////////////// PLOTS //////////////////////////////////////////////////
plot(i_SL and strategy.position_size > 0 and not TS ? SL : i_SL and
strategy.position_size > 0 and TS ? tstop : na , title='SL', style=plot.style_cross, color=color.red)
plot(i_SL and strategy.position_size < 0 and not TS ? SSL : i_SL and
strategy.position_size < 0 and TS ? Ststop : na , title='SSL', style=plot.style_cross, color=color.red)
plot(i_SL and strategy.position_size > 0 ? TP : na, title='TP', style=plot.style_cross, color=color.green)
plot(i_SL and strategy.position_size < 0 ? STP : na, title='STP', style=plot.style_cross, color=color.green)
// Draw price action setup arrows
plotshape(BUY ? 1 : na, style=shape.triangleup, location=location.belowbar,
color=color.green, title="Bullish Setup", size=size.auto)
plotshape(SELL ? 1 : na, style=shape.triangledown, location=location.abovebar,
color=color.red, title="Bearish Setup", size=size.auto)
` ``
> Detail
https://www.fmz.com/strategy/430840
> Last Modified
2023-11-02 14:14:34
