165 lines
13 KiB
Markdown
165 lines
13 KiB
Markdown

|
|
||
|
|
> Name
|
||
|
|
|
||
|
|
布林带随机RSI极值信号策略-Bollinger-Bands-Stochastic-RSI-Extreme-Signal-Strategy
|
||
|
|
|
||
|
|
> Author
|
||
|
|
|
||
|
|
ChaoZhang
|
||
|
|
|
||
|
|
> Strategy Description
|
||
|
|
|
||
|
|
|
||
|
|
|
||
|
|
[trans]
|
||
|
|
#### 概述
|
||
|
|
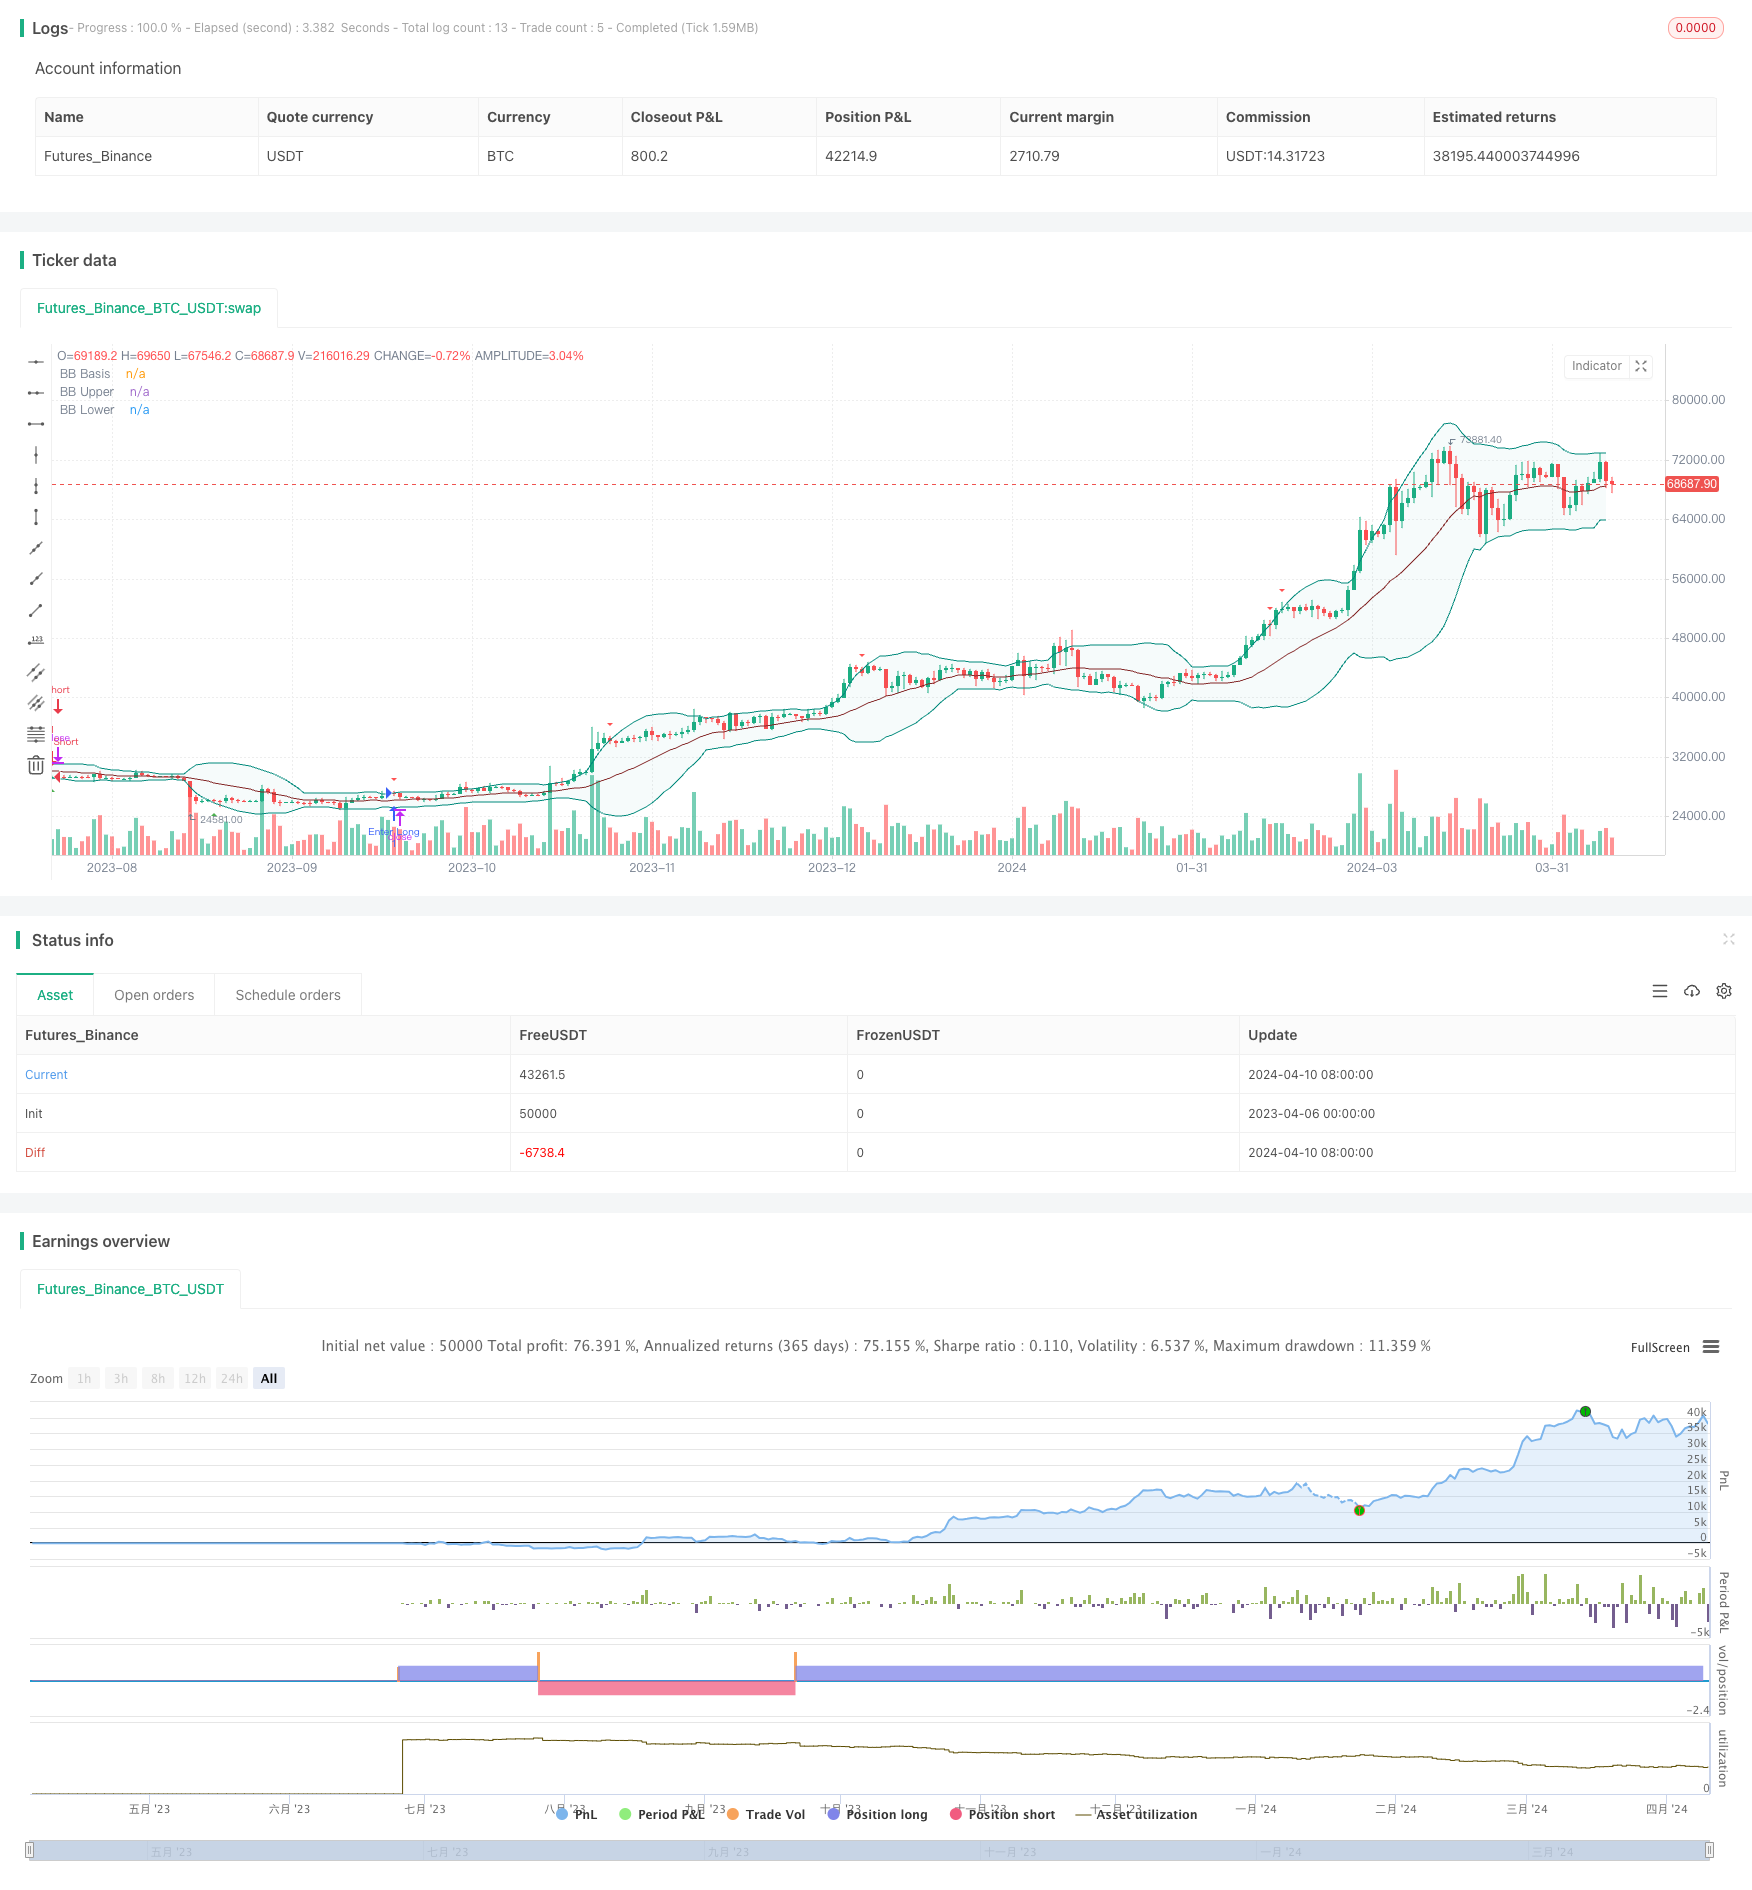
该策略使用布林带和随机RSI指标来生成可能表明价格反转的信号。默认情况下,看跌信号显示为红色箭头,看涨信号显示为绿色箭头。在发出信号之前,该策略会寻找以下情况:(看涨)蜡烛线在布林带上轨之上收盘,随后的蜡烛线在上轨内收盘,随机RSI低于预设阈值(默认为10);(看跌)蜡烛线在布林带下轨之下收盘,随后的蜡烛线在下轨内收盘,随机RSI高于预设阈值(默认为90)。
|
||
|
|
|
||
|
|
#### 策略原理
|
||
|
|
该策略的核心原理是利用布林带和随机RSI这两个技术指标来捕捉潜在的价格反转信号。布林带由一条中轨(通常是移动平均线)和两条上下轨道(中轨加减标准差)组成,可以反映价格的波动情况。当价格突破上轨或下轨时,通常意味着市场情绪过于乐观或悲观,价格可能会出现反转。随机RSI是在RSI指标的基础上再次应用随机指标,更加灵敏地反映了市场的超买超卖状态。当随机RSI达到极值区域(如超过90或低于10)时,也预示着潜在的反转。该策略结合布林带突破和随机RSI极值这两个条件,可以比较可靠地捕捉到价格反转的时机。
|
||
|
|
|
||
|
|
#### 策略优势
|
||
|
|
1. 双重确认:该策略同时使用布林带和随机RSI两个指标,形成了双重确认机制,可以有效过滤掉假信号,提高信号的可靠性。
|
||
|
|
2. 及时捕捉反转:布林带突破和随机RSI极值是市场情绪逆转的重要标志,策略能够及时捕捉到这些关键时刻,为投资者提供及时的交易信号。
|
||
|
|
3. 参数灵活:策略的参数设置较为灵活,如布林带的周期和宽度,随机RSI的周期和超买超卖阈值等,可以根据不同市场和品种进行优化调整。
|
||
|
|
4. 适用范围广:该策略可以适用于各类金融市场和交易品种,如股票、期货、外汇、加密货币等,通过参数调整可以适应不同的市场特征。
|
||
|
|
|
||
|
|
#### 策略风险
|
||
|
|
1. 震荡市中表现欠佳:在震荡市场中,价格经常在布林带上下轨附近波动,随机RSI也频繁进入超买超卖区域,可能会给出较多的假信号,导致频繁交易和资金损耗。
|
||
|
|
2. 趋势市中滞后:在强趋势市场中,价格可能长时间突破布林带上轨或下轨,随机RSI也可能长时间维持在超买超卖区域,此时该策略可能会发出滞后的反转信号,错失趋势交易机会。
|
||
|
|
3. 参数设置敏感:该策略的表现对于参数设置较为敏感,不同的参数组合可能带来显著不同的结果,参数设置需要根据市场状况不断调试和优化,增加了使用难度。
|
||
|
|
|
||
|
|
#### 策略优化方向
|
||
|
|
1. 加入趋势确认:在当前策略的基础上,可以加入一些趋势确认指标,如移动平均线,MACD等,用于甄别当前的趋势方向和强度,在趋势明确的情况下避免逆势交易,提高策略的适应性。
|
||
|
|
2. 动态调整参数:可以根据市场波动率的变化,动态调整布林带的宽度和随机RSI的超买超卖阈值,在波动率较高时使用较宽的布林带和较高的阈值,降低交易频率;在波动率较低时使用较窄的布林带和较低的阈值,提高交易灵敏度。
|
||
|
|
3. 引入止损止盈:在策略产生交易信号后,可以设置相应的止损和止盈规则,控制单次交易的风险敞口和盈利目标,提高策略的风险收益比。
|
||
|
|
4. 结合其他技术指标:可以将该策略与其他技术指标相结合,如支撑阻力位,交易量等,形成更加稳健的信号确认机制,提高策略的可靠性和盈利能力。
|
||
|
|
|
||
|
|
#### 总结
|
||
|
|
布林带随机RSI极值信号策略通过结合布林带和随机RSI两个技术指标,以价格突破布林带上下轨和随机RSI达到超买超卖极值区域作为潜在的反转信号,形成了一套简单易用的交易策略。该策略具有信号可靠,适用范围广等优势,但在震荡市中表现欠佳,趋势市中可能滞后,对参数设置也比较敏感。因此在实际应用中,可以考虑从趋势确认,动态参数,止损止盈,结合其他指标等方面对策略进行优化和改进,以提高其适应性和盈利能力,更好地服务于量化交易实践。
|
||
|
|
|
||
|
|
||
|
||
|
|
|
||
|
|
#### Overview
|
||
|
|
This strategy uses Bollinger Bands and Stochastic RSI indicators to generate signals that may indicate price reversals. By default, bearish signals are shown as red arrows and bullish signals as green arrows. Before sending a signal, the strategy looks for the following conditions: (bullish) the candle closes above the upper Bollinger Band, the subsequent candle closes inside the upper band, and the Stochastic RSI is below a preset threshold (default 10); (bearish) the candle closes below the lower Bollinger Band, the subsequent candle closes inside the lower band, and the Stochastic RSI is above a preset threshold (default 90).
|
||
|
|
|
||
|
|
#### Strategy Principle
|
||
|
|
The core principle of this strategy is to use Bollinger Bands and Stochastic RSI, two technical indicators, to capture potential price reversal signals. Bollinger Bands consist of a middle band (usually a moving average) and two upper and lower bands (middle band plus/minus standard deviations), which can reflect price volatility. When the price breaks through the upper or lower band, it usually indicates that market sentiment is overly optimistic or pessimistic, and the price may reverse. Stochastic RSI is a stochastic indicator applied on top of the RSI indicator, which more sensitively reflects the overbought and oversold state of the market. When the Stochastic RSI reaches extreme areas (such as above 90 or below 10), it also indicates a potential reversal. This strategy combines the conditions of Bollinger Band breakout and Stochastic RSI extremes, which can reliably capture the timing of price reversals.
|
||
|
|
|
||
|
|
#### Strategy Advantages
|
||
|
|
1. Double confirmation: The strategy uses both Bollinger Bands and Stochastic RSI indicators, forming a double confirmation mechanism that can effectively filter out false signals and improve signal reliability.
|
||
|
|
2. Timely reversal capture: Bollinger Band breakouts and Stochastic RSI extremes are important signs of market sentiment reversal. The strategy can capture these key moments in a timely manner and provide timely trading signals to investors.
|
||
|
|
3. Flexible parameters: The parameter settings of the strategy are relatively flexible, such as the period and width of Bollinger Bands, the period and overbought/oversold thresholds of Stochastic RSI, etc., which can be optimized and adjusted according to different markets and varieties.
|
||
|
|
4. Wide applicability: The strategy can be applied to various financial markets and trading products, such as stocks, futures, foreign exchange, cryptocurrencies, etc. By adjusting parameters, it can adapt to different market characteristics.
|
||
|
|
|
||
|
|
#### Strategy Risks
|
||
|
|
1. Poor performance in rangebound markets: In rangebound markets, prices often fluctuate near the upper and lower bands of Bollinger Bands, and the Stochastic RSI frequently enters overbought and oversold zones, which may give more false signals, leading to frequent trades and fund attrition.
|
||
|
|
2. Lag in trending markets: In strong trending markets, prices may break through the upper or lower Bollinger Bands for a long time, and the Stochastic RSI may also remain in overbought or oversold areas for a long time. At this time, the strategy may issue lagging reversal signals and miss trend trading opportunities.
|
||
|
|
3. Sensitive to parameter settings: The performance of the strategy is quite sensitive to parameter settings. Different parameter combinations may bring significantly different results. Parameter settings need to be constantly debugged and optimized according to market conditions, which increases the difficulty of use.
|
||
|
|
|
||
|
|
#### Strategy Optimization Directions
|
||
|
|
1. Add trend confirmation: On the basis of the current strategy, some trend confirmation indicators can be added, such as moving averages, MACD, etc., to identify the current trend direction and strength, avoid counter-trend trading when the trend is clear, and improve the adaptability of the strategy.
|
||
|
|
2. Dynamic parameter adjustment: According to changes in market volatility, dynamically adjust the width of Bollinger Bands and the overbought/oversold thresholds of Stochastic RSI. Use wider bands and higher thresholds when volatility is high to reduce trading frequency; use narrower bands and lower thresholds when volatility is low to improve trading sensitivity.
|
||
|
|
3. Introduce stop-loss and take-profit: After the strategy generates trading signals, corresponding stop-loss and take-profit rules can be set to control the risk exposure and profit target of a single transaction, thereby improving the risk-reward ratio of the strategy.
|
||
|
|
4. Combine with other technical indicators: The strategy can be combined with other technical indicators, such as support and resistance levels, trading volume, etc., to form a more robust signal confirmation mechanism and improve the reliability and profitability of the strategy.
|
||
|
|
|
||
|
|
#### Summary
|
||
|
|
The Bollinger Bands Stochastic RSI Extreme Signal Strategy combines two technical indicators, Bollinger Bands and Stochastic RSI, using price breakouts of the upper and lower Bollinger Bands and Stochastic RSI reaching overbought/oversold extreme areas as potential reversal signals, forming a simple and easy-to-use trading strategy. The strategy has advantages such as reliable signals and wide applicability, but it performs poorly in rangebound markets, may lag in trending markets, and is quite sensitive to parameter settings. Therefore, in practical applications, we can consider optimizing and improving the strategy from aspects such as trend confirmation, dynamic parameters, stop-loss and take-profit, and combining with other indicators, in order to improve its adaptability and profitability and better serve quantitative trading practice.
|
||
|
|
[/trans]
|
||
|
|
|
||
|
|
> Strategy Arguments
|
||
|
|
|
||
|
|
|
||
|
|
|
||
|
|
|Argument|Default|Description|
|
||
|
|
|----|----|----|
|
||
|
|
|v_input_1_close|0|Source: close|high|low|open|hl2|hlc3|hlcc4|ohlc4|
|
||
|
|
|v_input_int_1|false|Offset|
|
||
|
|
|v_input_int_2|20|Bollinger Band Length|
|
||
|
|
|v_input_float_1|2|StdDev|
|
||
|
|
|v_input_int_3|3|K|
|
||
|
|
|v_input_int_4|3|D|
|
||
|
|
|v_input_int_5|14|RSI Length|
|
||
|
|
|v_input_int_6|14|Stochastic Length|
|
||
|
|
|v_input_float_2|90|Upper Limit|
|
||
|
|
|v_input_float_3|10|Upper Limit|
|
||
|
|
|
||
|
|
|
||
|
|
> Source (PineScript)
|
||
|
|
|
||
|
|
``` pinescript
|
||
|
|
/*backtest
|
||
|
|
start: 2023-04-06 00:00:00
|
||
|
|
end: 2024-04-11 00:00:00
|
||
|
|
period: 1d
|
||
|
|
basePeriod: 1h
|
||
|
|
exchanges: [{"eid":"Futures_Binance","currency":"BTC_USDT"}]
|
||
|
|
*/
|
||
|
|
|
||
|
|
//@version=5
|
||
|
|
strategy(shorttitle='BBSR Extreme', title='Bollinger Bands Stochastic RSI Extreme Signal', overlay=true)
|
||
|
|
|
||
|
|
//General Inputs
|
||
|
|
src = input(close, title='Source')
|
||
|
|
offset = input.int(0, 'Offset', minval=-500, maxval=500)
|
||
|
|
|
||
|
|
//Bollinger Inputs
|
||
|
|
length = input.int(20, title='Bollinger Band Length', minval=1)
|
||
|
|
mult = input.float(2.0, minval=0.001, maxval=50, title='StdDev')
|
||
|
|
|
||
|
|
//Bollinger Code
|
||
|
|
basis = ta.sma(src, length)
|
||
|
|
dev = mult * ta.stdev(src, length)
|
||
|
|
upper = basis + dev
|
||
|
|
lower = basis - dev
|
||
|
|
plot(basis, 'BB Basis', color=color.new(#872323, 0), offset=offset)
|
||
|
|
p1 = plot(upper, 'BB Upper', color=color.new(color.teal, 0), offset=offset)
|
||
|
|
p2 = plot(lower, 'BB Lower', color=color.new(color.teal, 0), offset=offset)
|
||
|
|
fill(p1, p2, title='BB Background', color=color.new(#198787, 95))
|
||
|
|
|
||
|
|
|
||
|
|
//Stoch Inputs
|
||
|
|
smoothK = input.int(3, 'K', minval=1)
|
||
|
|
smoothD = input.int(3, 'D', minval=1)
|
||
|
|
lengthRSI = input.int(14, 'RSI Length', minval=1)
|
||
|
|
lengthStoch = input.int(14, 'Stochastic Length', minval=1)
|
||
|
|
|
||
|
|
upperlimit = input.float(90, 'Upper Limit', minval=0.01)
|
||
|
|
lowerlimit = input.float(10, 'Upper Limit', minval=0.01)
|
||
|
|
|
||
|
|
//Stochastic Code
|
||
|
|
rsi1 = ta.rsi(src, lengthRSI)
|
||
|
|
k = ta.sma(ta.stoch(rsi1, rsi1, rsi1, lengthStoch), smoothK)
|
||
|
|
d = ta.sma(k, smoothD)
|
||
|
|
|
||
|
|
//Evaluation
|
||
|
|
Bear = close[1] > upper[1] and close < upper and k[1] > upperlimit and d[1] > upperlimit
|
||
|
|
Bull = close[1] < lower[1] and close > lower and k[1] < lowerlimit and d[1] < lowerlimit
|
||
|
|
|
||
|
|
|
||
|
|
//Plots
|
||
|
|
plotshape(Bear, style=shape.triangledown, location=location.abovebar, color=color.new(color.red, 0), size=size.tiny)
|
||
|
|
plotshape(Bull, style=shape.triangleup, location=location.belowbar, color=color.new(color.green, 0), size=size.tiny)
|
||
|
|
|
||
|
|
// Alert Functionality
|
||
|
|
alertcondition(Bear or Bull, title='Any Signal', message='{{exchange}}:{{ticker}}' + ' {{interval}}' + ' BB Stochastic Extreme!')
|
||
|
|
alertcondition(Bear, title='Bearish Signal', message='{{exchange}}:{{ticker}}' + ' {{interval}}' + ' Bearish BB Stochastic Extreme!')
|
||
|
|
alertcondition(Bull, title='Bullish Signal', message='{{exchange}}:{{ticker}}' + ' {{interval}}' + ' Bullish BB Stochastic Extreme!')
|
||
|
|
|
||
|
|
|
||
|
|
if Bear
|
||
|
|
strategy.entry('Enter Long', strategy.long)
|
||
|
|
else if Bull
|
||
|
|
strategy.entry('Enter Short', strategy.short)
|
||
|
|
|
||
|
|
|
||
|
|
```
|
||
|
|
|
||
|
|
> Detail
|
||
|
|
|
||
|
|
https://www.fmz.com/strategy/448061
|
||
|
|
|
||
|
|
> Last Modified
|
||
|
|
|
||
|
|
2024-04-12 16:36:42
|