190 lines
9.3 KiB
Markdown
190 lines
9.3 KiB
Markdown

|
|
||
|
|
> Name
|
||
|
|
|
||
|
|
布林带结合超级趋势的智能波动区间交易策略-Intelligent-Volatility-Range-Trading-Strategy-Combining-Bollinger-Bands-and-SuperTrend
|
||
|
|
|
||
|
|
> Author
|
||
|
|
|
||
|
|
ChaoZhang
|
||
|
|
|
||
|
|
> Strategy Description
|
||
|
|
|
||
|
|
|
||
|
|
|
||
|
|
[trans]
|
||
|
|
#### 策略概述
|
||
|
|
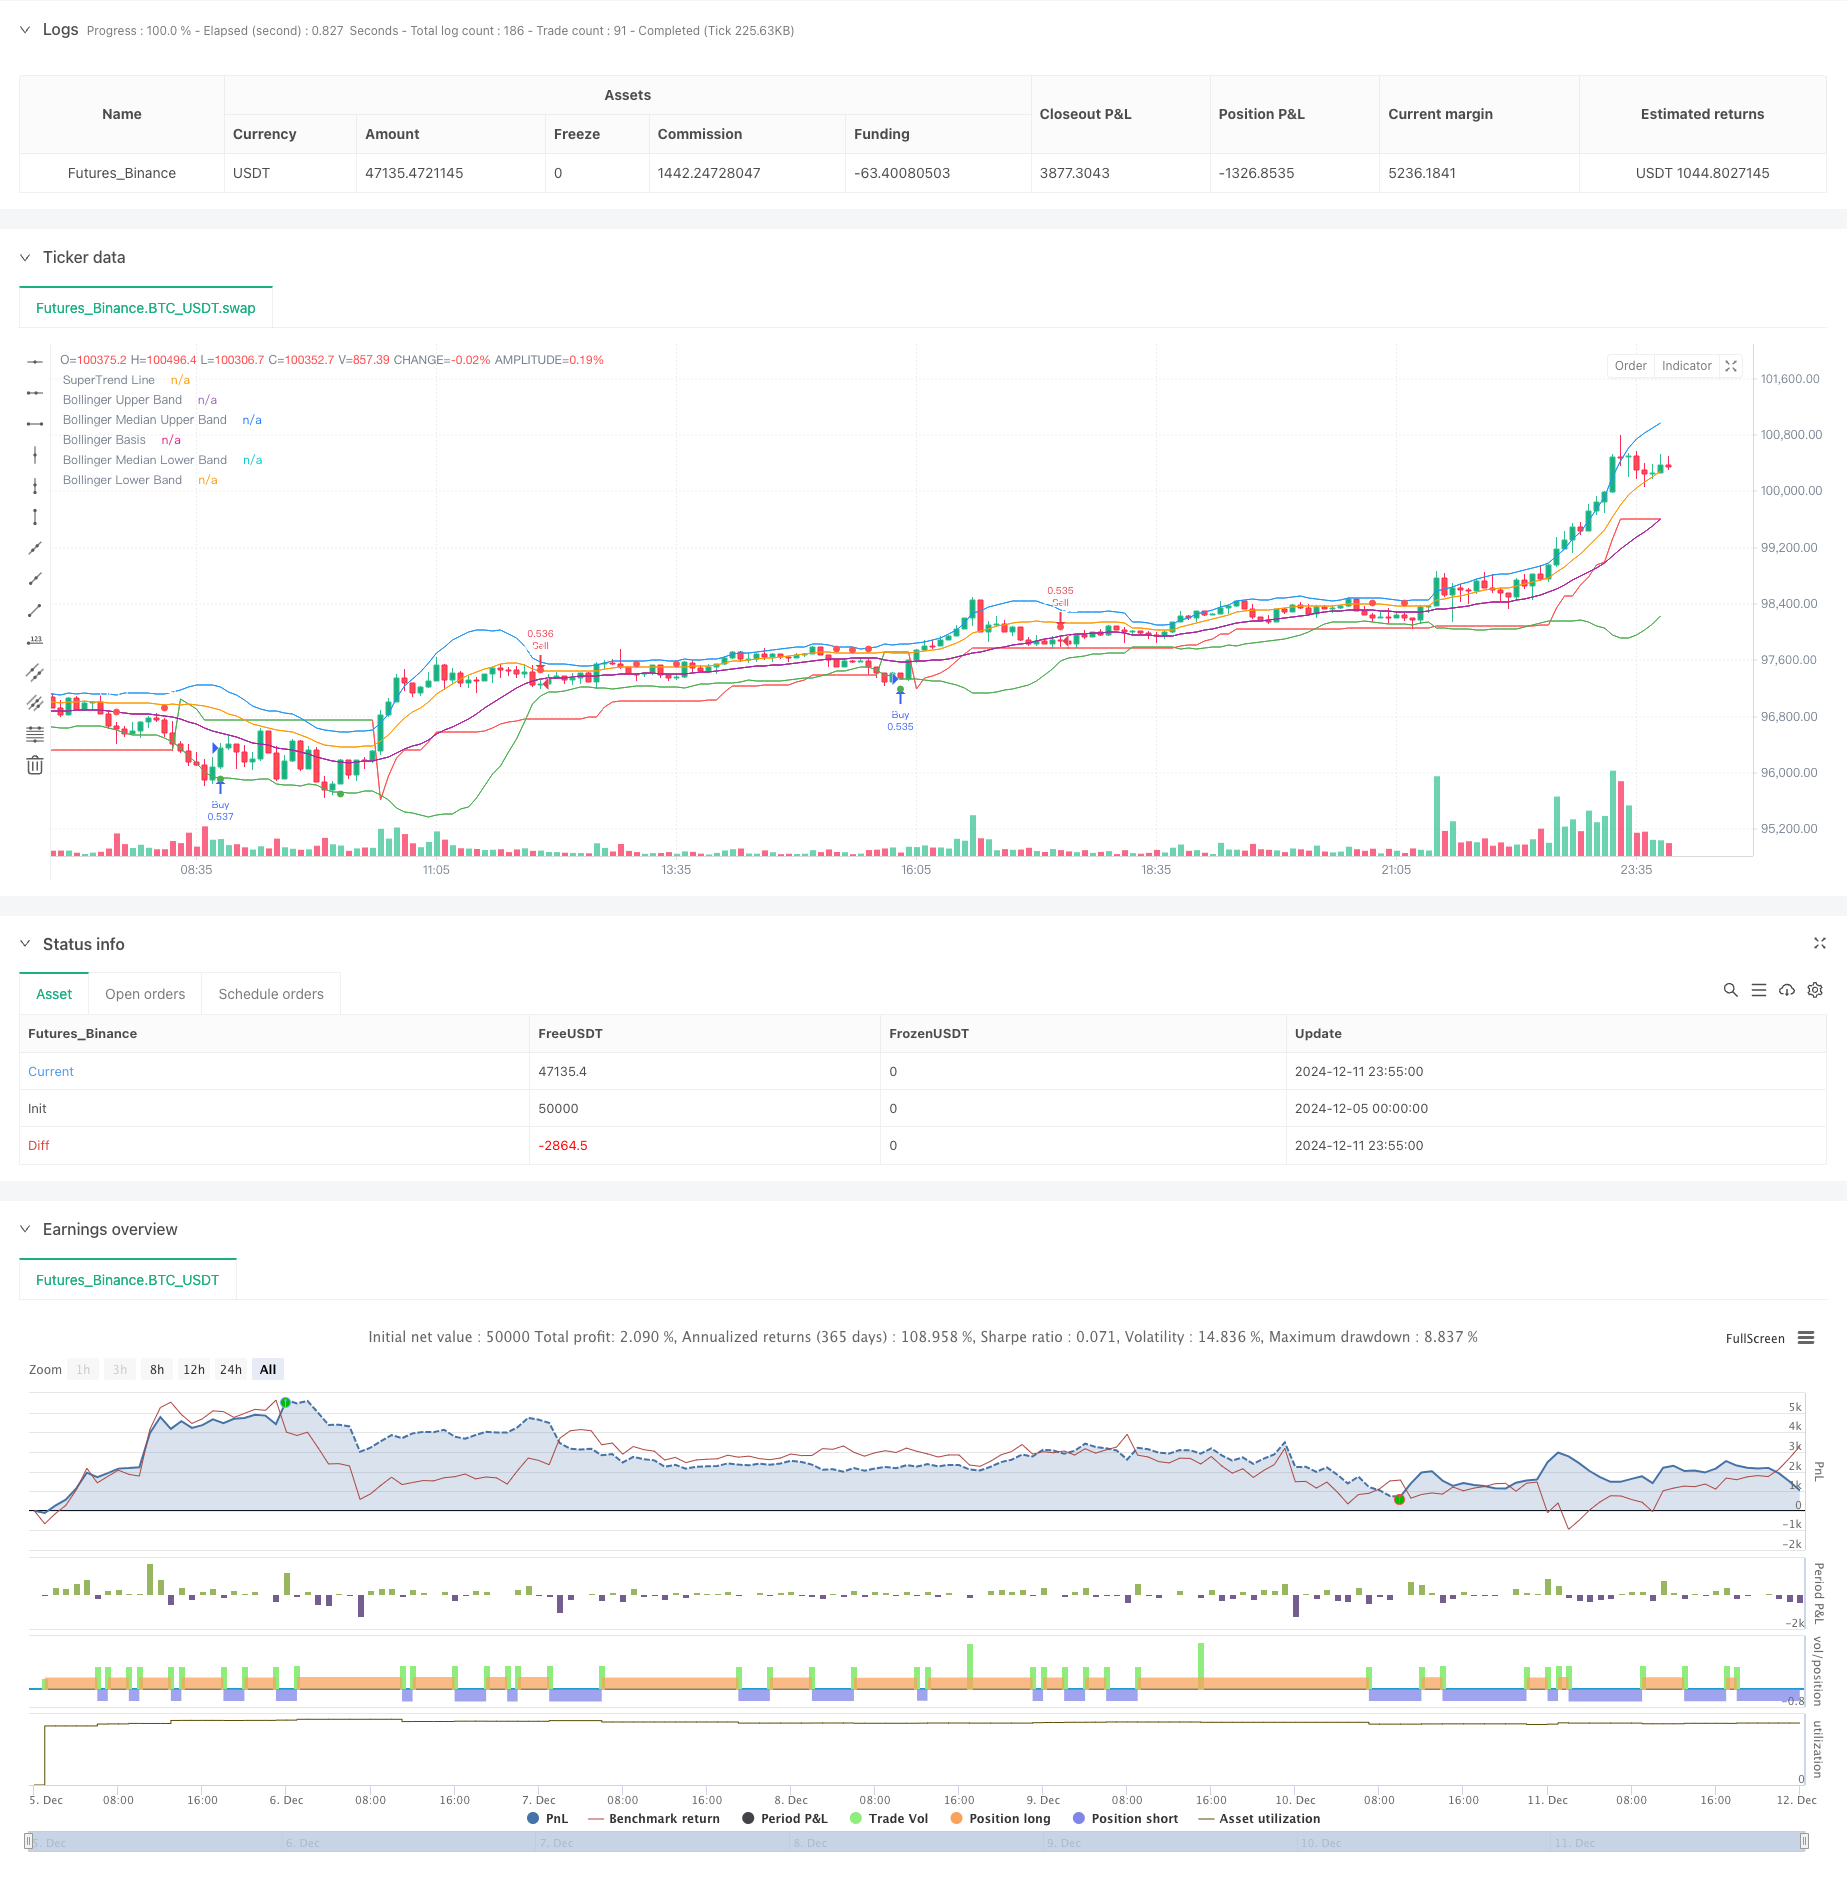
这是一个结合布林带和超级趋势指标的智能交易策略。该策略主要通过布林带来识别市场波动区间,同时利用超级趋势指标来确认市场趋势方向,从而在高概率位置进行交易。策略设计适用于各种交易品种和时间周期,特别是在30分钟和2小时时间周期上表现较好。
|
||
|
|
|
||
|
|
#### 策略原理
|
||
|
|
策略的核心逻辑基于以下几个关键要素:
|
||
|
|
1. 使用20周期的布林带,带宽为2个标准差,构建出上轨、中轨、下轨以及两条中位线
|
||
|
|
2. 采用10周期ATR和3倍因子计算超级趋势指标
|
||
|
|
3. 入场信号:
|
||
|
|
- 多头入场:当价格触及布林带下轨且超级趋势指标为多头方向时
|
||
|
|
- 空头入场:当价格触及布林带上轨且超级趋势指标为空头方向时
|
||
|
|
4. 出场信号:
|
||
|
|
- 多头出场:当收盘价跌破超级趋势线且趋势转为空头时
|
||
|
|
- 空头出场:当收盘价突破超级趋势线且趋势转为多头时
|
||
|
|
|
||
|
|
#### 策略优势
|
||
|
|
1. 双重确认机制增加交易可靠性:结合布林带的波动区间和超级趋势的方向判断,有效降低假突破风险
|
||
|
|
2. 自适应市场波动:布林带会根据市场波动自动调整带宽,使策略具有良好的适应性
|
||
|
|
3. 清晰的交易信号:入场和出场条件明确,易于执行和回测
|
||
|
|
4. 灵活的参数设置:可根据不同市场条件调整布林带长度、带宽倍数和超级趋势参数
|
||
|
|
5. 可视化效果优秀:使用不同颜色和形状标记交易信号,便于分析和监控
|
||
|
|
|
||
|
|
#### 策略风险
|
||
|
|
1. 震荡市场风险:在横盘震荡行情中可能产生频繁的假信号
|
||
|
|
2. 滞后性风险:布林带和超级趋势都属于滞后指标,在快速行情中可能错过最佳入场点
|
||
|
|
3. 参数敏感性:不同参数设置可能导致策略表现差异较大
|
||
|
|
建议对策略进行以下风险控制:
|
||
|
|
- 设置止损位置来控制单笔风险
|
||
|
|
- 在剧烈波动期间考虑暂停交易
|
||
|
|
- 定期优化参数以适应市场变化
|
||
|
|
|
||
|
|
#### 策略优化方向
|
||
|
|
1. 增加市场波动率过滤:
|
||
|
|
- 在高波动率环境下调整仓位大小
|
||
|
|
- 增加ATR过滤器避免过度波动期间的交易
|
||
|
|
2. 完善止盈止损机制:
|
||
|
|
- 基于布林带宽度动态设置止损位置
|
||
|
|
- 结合超级趋势斜率设计动态止盈策略
|
||
|
|
3. 增加时间过滤:
|
||
|
|
- 避开重要数据公布时间
|
||
|
|
- 针对不同时间段设置不同的参数
|
||
|
|
4. 优化信号确认机制:
|
||
|
|
- 增加成交量确认
|
||
|
|
- 考虑增加趋势强度指标
|
||
|
|
|
||
|
|
#### 总结
|
||
|
|
这是一个结合技术分析经典指标的完整交易系统,通过布林带和超级趋势的协同作用,能够在趋势和波动中都有不错的表现。策略的可视化设计和参数灵活性使其具有很好的实用性。通过建议的优化方向,可以进一步提升策略的稳定性和盈利能力。建议在实盘使用前进行充分的回测和参数优化。 ||
|
||
|
|
|
||
|
|
#### Strategy Overview
|
||
|
|
This is an intelligent trading strategy that combines Bollinger Bands and SuperTrend indicators. The strategy primarily uses Bollinger Bands to identify market volatility ranges while utilizing the SuperTrend indicator to confirm market trend direction, enabling trades at high-probability positions. The strategy is designed for various trading instruments and timeframes, performing particularly well on 30-minute and 2-hour timeframes.
|
||
|
|
|
||
|
|
#### Strategy Principles
|
||
|
|
The core logic of the strategy is based on the following key elements:
|
||
|
|
1. Uses 20-period Bollinger Bands with 2 standard deviations bandwidth, constructing upper, middle, lower bands, and two median lines
|
||
|
|
2. Employs 10-period ATR and factor of 3 to calculate the SuperTrend indicator
|
||
|
|
3. Entry signals:
|
||
|
|
- Long entry: When price touches the lower Bollinger Band and SuperTrend indicates bullish direction
|
||
|
|
- Short entry: When price touches the upper Bollinger Band and SuperTrend indicates bearish direction
|
||
|
|
4. Exit signals:
|
||
|
|
- Long exit: When closing price breaks below the SuperTrend line and trend turns bearish
|
||
|
|
- Short exit: When closing price breaks above the SuperTrend line and trend turns bullish
|
||
|
|
|
||
|
|
#### Strategy Advantages
|
||
|
|
1. Dual confirmation mechanism increases trade reliability: Combining Bollinger Bands' volatility range and SuperTrend's direction judgment effectively reduces false breakout risks
|
||
|
|
2. Adaptive to market volatility: Bollinger Bands automatically adjust bandwidth based on market volatility, providing good adaptability
|
||
|
|
3. Clear trading signals: Entry and exit conditions are explicit, easy to execute and backtest
|
||
|
|
4. Flexible parameter settings: Can adjust Bollinger Bands length, bandwidth multiplier, and SuperTrend parameters based on different market conditions
|
||
|
|
5. Excellent visualization: Uses different colors and shapes to mark trading signals, convenient for analysis and monitoring
|
||
|
|
|
||
|
|
#### Strategy Risks
|
||
|
|
1. Choppy market risk: May generate frequent false signals in sideways markets
|
||
|
|
2. Lag risk: Both Bollinger Bands and SuperTrend are lagging indicators, may miss optimal entry points in fast-moving markets
|
||
|
|
3. Parameter sensitivity: Different parameter settings may lead to significant performance variations
|
||
|
|
Recommended risk controls:
|
||
|
|
- Set stop-loss positions to control single-trade risk
|
||
|
|
- Consider pausing trading during extreme volatility periods
|
||
|
|
- Regularly optimize parameters to adapt to market changes
|
||
|
|
|
||
|
|
#### Strategy Optimization Directions
|
||
|
|
1. Add market volatility filtering:
|
||
|
|
- Adjust position sizes in high volatility environments
|
||
|
|
- Add ATR filter to avoid trading during excessive volatility
|
||
|
|
2. Improve profit-taking and stop-loss mechanisms:
|
||
|
|
- Dynamically set stop-loss positions based on Bollinger Band width
|
||
|
|
- Design dynamic profit-taking strategy based on SuperTrend slope
|
||
|
|
3. Add time filtering:
|
||
|
|
- Avoid important data release times
|
||
|
|
- Set different parameters for different time periods
|
||
|
|
4. Optimize signal confirmation mechanism:
|
||
|
|
- Add volume confirmation
|
||
|
|
- Consider adding trend strength indicators
|
||
|
|
|
||
|
|
#### Summary
|
||
|
|
This is a complete trading system combining classic technical analysis indicators, which can perform well in both trending and volatile markets through the synergy of Bollinger Bands and SuperTrend. The strategy's visualization design and parameter flexibility make it highly practical. Through the suggested optimization directions, the strategy's stability and profitability can be further enhanced. It is recommended to conduct thorough backtesting and parameter optimization before live trading.[/trans]
|
||
|
|
|
||
|
|
|
||
|
|
|
||
|
|
> Source (PineScript)
|
||
|
|
|
||
|
|
``` pinescript
|
||
|
|
/*backtest
|
||
|
|
start: 2024-12-05 00:00:00
|
||
|
|
end: 2024-12-12 00:00:00
|
||
|
|
period: 5m
|
||
|
|
basePeriod: 5m
|
||
|
|
exchanges: [{"eid":"Futures_Binance","currency":"BTC_USDT"}]
|
||
|
|
*/
|
||
|
|
|
||
|
|
//@version=5
|
||
|
|
strategy("Bollinger Band & SuperTrend Strategy (Standard Chart)", overlay=true, default_qty_type=strategy.percent_of_equity, default_qty_value=100)
|
||
|
|
|
||
|
|
// Bollinger Bands Settings
|
||
|
|
length_bb = input.int(20, title="Bollinger Band Length")
|
||
|
|
mult_bb = input.float(2.0, title="Bollinger Band Multiplier")
|
||
|
|
[bb_upper, bb_basis, bb_lower] = ta.bb(close, length_bb, mult_bb)
|
||
|
|
|
||
|
|
// Median Bands
|
||
|
|
bb_median_upper = (bb_upper + bb_basis) / 2
|
||
|
|
bb_median_lower = (bb_lower + bb_basis) / 2
|
||
|
|
|
||
|
|
// SuperTrend Settings
|
||
|
|
atr_length = input.int(10, title="ATR Length")
|
||
|
|
factor = input.float(3.0, title="SuperTrend Factor")
|
||
|
|
|
||
|
|
// SuperTrend Calculation based on standard chart OHLC data
|
||
|
|
[supertrend, direction] = ta.supertrend(factor, atr_length)
|
||
|
|
|
||
|
|
// Plotting Bollinger Bands
|
||
|
|
plot(bb_upper, color=color.red, title="Bollinger Upper Band")
|
||
|
|
plot(bb_median_upper, color=color.orange, title="Bollinger Median Upper Band")
|
||
|
|
plot(bb_basis, color=color.blue, title="Bollinger Basis")
|
||
|
|
plot(bb_median_lower, color=color.purple, title="Bollinger Median Lower Band")
|
||
|
|
plot(bb_lower, color=color.green, title="Bollinger Lower Band")
|
||
|
|
|
||
|
|
// Plotting SuperTrend
|
||
|
|
supertrend_color = direction > 0 ? color.green : color.red
|
||
|
|
plot(supertrend, color=supertrend_color, style=plot.style_line, title="SuperTrend Line")
|
||
|
|
|
||
|
|
// Customizable Signal Shape Inputs
|
||
|
|
buy_shape = input.string("shape_triangle_up", title="Buy Signal Shape", options=["shape_triangle_up", "shape_circle", "shape_cross", "shape_diamond", "shape_flag"])
|
||
|
|
sell_shape = input.string("shape_triangle_down", title="Sell Signal Shape", options=["shape_triangle_down", "shape_circle", "shape_cross", "shape_diamond", "shape_flag"])
|
||
|
|
|
||
|
|
// Entry Conditions
|
||
|
|
buy_condition = ta.crossover(low, bb_lower) and direction > 0
|
||
|
|
sell_condition = ta.crossunder(high, bb_upper) and direction < 0
|
||
|
|
|
||
|
|
// Exit Conditions
|
||
|
|
exit_buy_condition = ta.crossunder(close, supertrend) and direction < 0
|
||
|
|
exit_sell_condition = ta.crossover(close, supertrend) and direction > 0
|
||
|
|
|
||
|
|
// Strategy Logic
|
||
|
|
if buy_condition
|
||
|
|
strategy.entry("Buy", strategy.long)
|
||
|
|
if sell_condition
|
||
|
|
strategy.entry("Sell", strategy.short)
|
||
|
|
|
||
|
|
if exit_buy_condition
|
||
|
|
strategy.close("Buy")
|
||
|
|
if exit_sell_condition
|
||
|
|
strategy.close("Sell")
|
||
|
|
|
||
|
|
// Plot Buy Signal Shape
|
||
|
|
plotshape(series=buy_condition, title="Buy Signal", location=location.belowbar, color=color.green, style=buy_shape, text="BUY", textcolor=color.white)
|
||
|
|
|
||
|
|
// Plot Sell Signal Shape
|
||
|
|
plotshape(series=sell_condition, title="Sell Signal", location=location.abovebar, color=color.red, style=sell_shape, text="SELL", textcolor=color.white)
|
||
|
|
|
||
|
|
```
|
||
|
|
|
||
|
|
> Detail
|
||
|
|
|
||
|
|
https://www.fmz.com/strategy/474980
|
||
|
|
|
||
|
|
> Last Modified
|
||
|
|
|
||
|
|
2024-12-13 11:47:54
|