380 lines
20 KiB
Markdown
380 lines
20 KiB
Markdown

|
|
|||
|
|
> Name
|
|||
|
|
|
|||
|
|
多重指标趋势确认动态止盈止损交易策略-Multi-Indicator-Trend-Confirmation-Dynamic-Risk-Management-Trading-Strategy
|
|||
|
|
|
|||
|
|
> Author
|
|||
|
|
|
|||
|
|
ianzeng123
|
|||
|
|
|
|||
|
|
> Strategy Description
|
|||
|
|
|
|||
|
|
|
|||
|
|
|
|||
|
|
|
|||
|
|
|
|||
|
|
|
|||
|
|
|
|||
|
|
[trans]# 概述
|
|||
|
|
|
|||
|
|
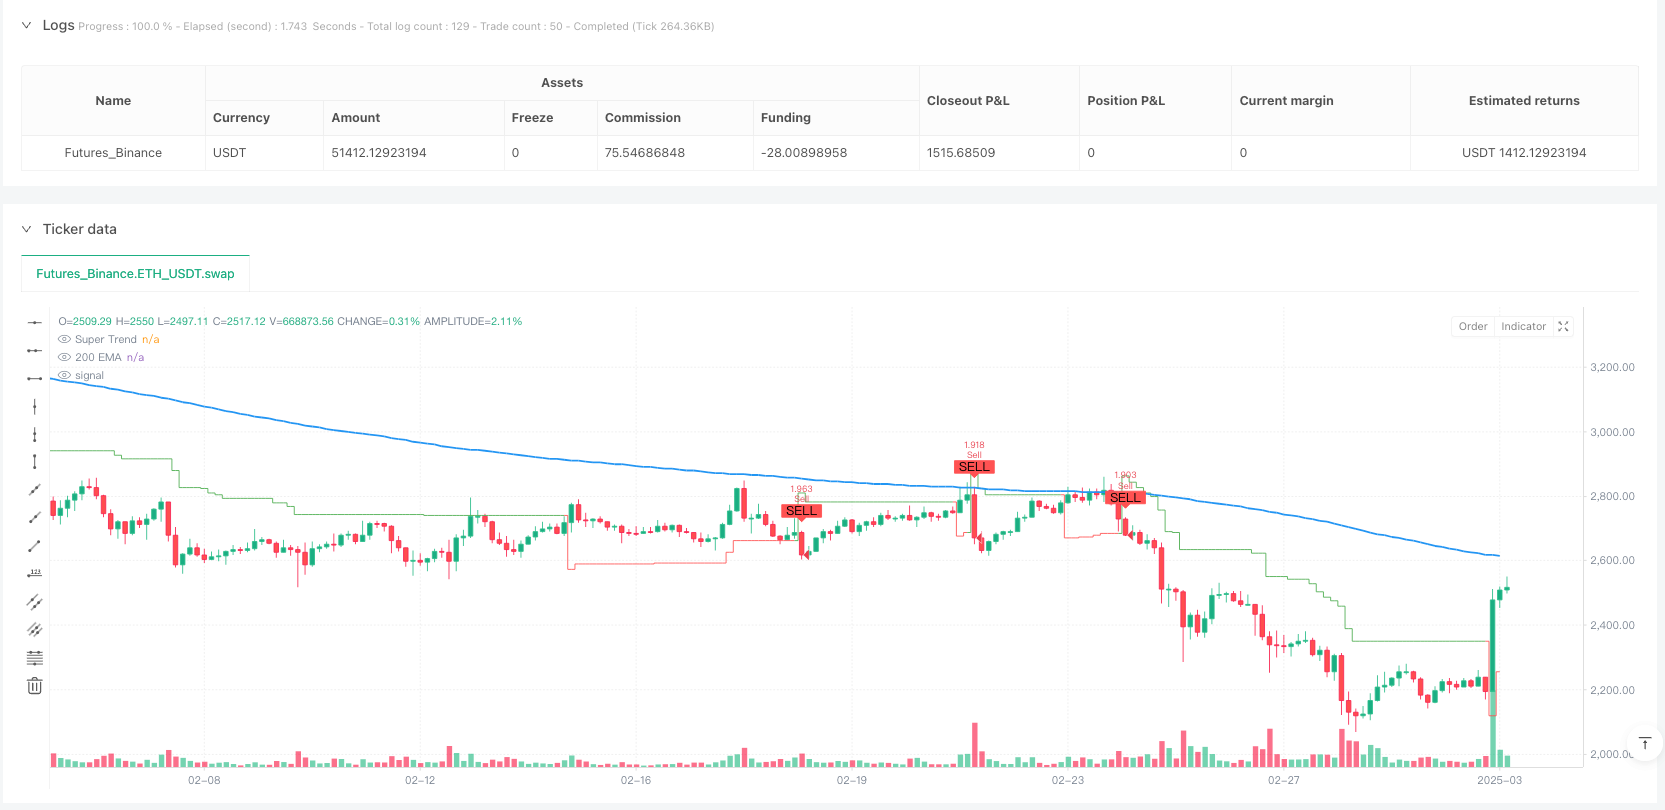
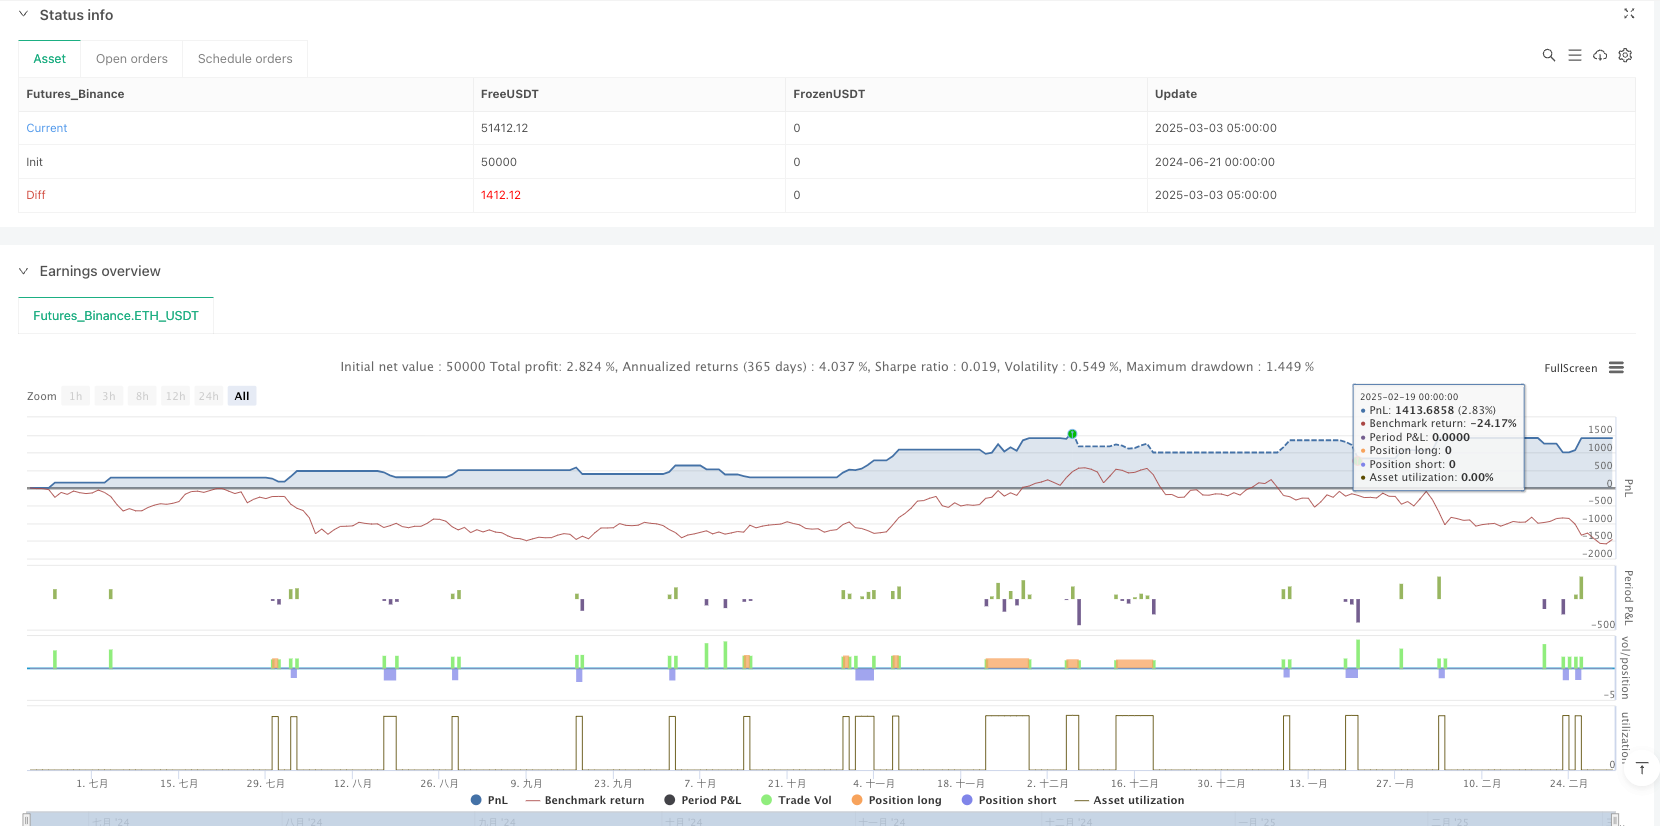
这是一个基于多重指标确认的量化交易策略,核心指标为超级趋势线(SuperTrend),同时结合200日指数移动平均线(EMA)作为趋势确认,相对强弱指数(RSI)作为动量确认,并通过平均真实波幅(ATR)动态设置止损和止盈水平。该策略采用多层过滤机制,确保交易信号的可靠性,同时通过灵活的风险管理系统保护资金安全。策略设计遵循趋势跟踪原则,通过多重指标协同验证,提高交易成功率。
|
|||
|
|
|
|||
|
|
# 策略原理
|
|||
|
|
|
|||
|
|
该策略的核心原理是通过多层指标协同确认,过滤掉低质量交易信号,同时动态管理风险:
|
|||
|
|
|
|||
|
|
1. **超级趋势线(SuperTrend)信号识别**:
|
|||
|
|
- 利用SuperTrend指标(基于ATR的趋势跟踪指标)识别价格突破
|
|||
|
|
- 当价格向上突破超级趋势线时产生买入信号基础
|
|||
|
|
- 当价格向下跌破超级趋势线时产生卖出信号基础
|
|||
|
|
|
|||
|
|
2. **趋势确认机制**:
|
|||
|
|
- 使用200日EMA确认中长期趋势方向
|
|||
|
|
- 买入条件要求价格必须位于EMA之上,确保顺应上升趋势
|
|||
|
|
- 卖出条件要求价格必须位于EMA之下,确保顺应下降趋势
|
|||
|
|
|
|||
|
|
3. **动量确认过滤**:
|
|||
|
|
- 通过RSI指标验证市场动量
|
|||
|
|
- 买入信号要求RSI大于50,确认上升动量
|
|||
|
|
- 卖出信号要求RSI小于50,确认下降动量
|
|||
|
|
- 可选择是否启用RSI过滤功能
|
|||
|
|
|
|||
|
|
4. **动态风险管理**:
|
|||
|
|
- 基于ATR动态设置止损位置,自适应市场波动性
|
|||
|
|
- 买入交易止损设置为:当前价格 - (ATR乘数 × ATR值)
|
|||
|
|
- 卖出交易止损设置为:当前价格 + (ATR乘数 × ATR值)
|
|||
|
|
|
|||
|
|
5. **风险回报比例控制**:
|
|||
|
|
- 通过固定乘数关系设置止盈目标
|
|||
|
|
- 止盈水平根据止损距离自动计算,默认风险回报比为1:2
|
|||
|
|
|
|||
|
|
策略交易逻辑清晰:只有当SuperTrend给出信号,且同时满足趋势方向(EMA)和市场动量(RSI可选)条件时,才执行交易。进场后,系统会根据当前市场波动性自动设置止损和止盈水平,保障风险管理的有效性。
|
|||
|
|
|
|||
|
|
# 策略优势
|
|||
|
|
|
|||
|
|
1. **多重确认过滤机制**:
|
|||
|
|
- 通过SuperTrend、EMA和RSI三重指标确认,有效降低虚假信号
|
|||
|
|
- 多层过滤确保只在高概率趋势环境中交易
|
|||
|
|
- 可以显著减少震荡市场中的亏损交易
|
|||
|
|
|
|||
|
|
2. **自适应市场波动性**:
|
|||
|
|
- 基于ATR的止损设置能够自动适应不同市场条件下的波动
|
|||
|
|
- 高波动期间自动扩大止损距离,低波动期间自动收窄止损距离
|
|||
|
|
- 避免了固定止损造成的过早出局或风险过大问题
|
|||
|
|
|
|||
|
|
3. **风险管理完善**:
|
|||
|
|
- 每笔交易自动设置止损和止盈,无需手动监控
|
|||
|
|
- 通过比例控制(默认1:2)确保良好的风险回报比
|
|||
|
|
- 系统化的风险控制降低情绪干扰
|
|||
|
|
|
|||
|
|
4. **策略参数灵活可调**:
|
|||
|
|
- 所有关键参数均可自定义,适应不同市场和个人风险偏好
|
|||
|
|
- 可选择性启用或禁用RSI过滤,调整策略严格程度
|
|||
|
|
- ATR乘数和止盈比例可根据不同市场特性进行优化
|
|||
|
|
|
|||
|
|
5. **可视化交易信号**:
|
|||
|
|
- 策略提供清晰的图形化指标和交易信号标记
|
|||
|
|
- 超级趋势线颜色变化直观显示市场趋势状态
|
|||
|
|
- 买卖信号通过箭头明确标注,便于回测分析
|
|||
|
|
|
|||
|
|
6. **资金管理合理**:
|
|||
|
|
- 默认每笔交易使用账户总值的固定比例(10%),而非固定合约数量
|
|||
|
|
- 随着账户规模变化自动调整头寸大小,实现复利效应
|
|||
|
|
- 避免了固定手数交易可能带来的资金管理问题
|
|||
|
|
|
|||
|
|
# 策略风险
|
|||
|
|
|
|||
|
|
1. **趋势转折点反应滞后**:
|
|||
|
|
- SuperTrend和EMA都属于滞后性指标,在趋势转折点可能反应不及时
|
|||
|
|
- 在急剧反转市场中可能面临较大回撤
|
|||
|
|
- 缓解方法:可考虑增加短期动量指标或波动率突破检测机制
|
|||
|
|
|
|||
|
|
2. **横盘震荡市场表现不佳**:
|
|||
|
|
- 策略设计基于趋势跟踪理念,在无明确趋势的横盘市场可能频繁进出
|
|||
|
|
- 震荡市场可能产生连续亏损交易
|
|||
|
|
- 缓解方法:增加趋势强度过滤或在识别到震荡市场时暂停交易
|
|||
|
|
|
|||
|
|
3. **固定RSI阈值局限性**:
|
|||
|
|
- 使用固定的RSI阈值(50)可能不适用于所有市场环境
|
|||
|
|
- 在某些偏向性市场中,RSI长期维持在高区或低区
|
|||
|
|
- 缓解方法:考虑使用自适应RSI阈值或RSI变化率而非绝对水平
|
|||
|
|
|
|||
|
|
4. **止损设置风险**:
|
|||
|
|
- 虽然基于ATR的动态止损有优势,但在极端波动市场中可能设置过宽
|
|||
|
|
- 黑天鹅事件可能直接突破止损水平
|
|||
|
|
- 缓解方法:增加最大止损限制或设置波动率异常检测机制
|
|||
|
|
|
|||
|
|
5. **过度优化风险**:
|
|||
|
|
- 策略具有多个可调参数,存在过度拟合历史数据的风险
|
|||
|
|
- 优化后的参数组合可能不适用于未来市场
|
|||
|
|
- 缓解方法:采用步进式前向测试或分段验证参数稳健性
|
|||
|
|
|
|||
|
|
6. **资金管理考量**:
|
|||
|
|
- 默认使用账户10%的比例可能在某些情况下风险过高
|
|||
|
|
- 连续亏损可能对资金造成较大影响
|
|||
|
|
- 缓解方法:根据策略回测表现和个人风险承受能力调整头寸比例
|
|||
|
|
|
|||
|
|
# 策略优化方向
|
|||
|
|
|
|||
|
|
1. **增加市场环境适应性**:
|
|||
|
|
- 开发市场类型识别功能,区分趋势市场和震荡市场
|
|||
|
|
- 在不同市场环境中动态调整交易参数
|
|||
|
|
- 理由:提高策略在多种市场条件下的适应性,减少震荡市场中的虚假信号
|
|||
|
|
|
|||
|
|
2. **引入动态参数调整**:
|
|||
|
|
- 根据市场波动性自动调整SuperTrend因子
|
|||
|
|
- 高波动市场增加因子值,低波动市场减小因子值
|
|||
|
|
- 理由:避免参数固定带来的局限性,提高策略对市场变化的响应能力
|
|||
|
|
|
|||
|
|
3. **优化RSI应用方式**:
|
|||
|
|
- 将RSI固定阈值替换为动态阈值或趋势线突破
|
|||
|
|
- 考虑RSI背离信号作为辅助指标
|
|||
|
|
- 理由:提高RSI指标在不同市场环境下的有效性,增加策略的稳健性
|
|||
|
|
|
|||
|
|
4. **完善风险管理系统**:
|
|||
|
|
- 增加最大承受回撤控制
|
|||
|
|
- 实现基于波动率的头寸动态调整
|
|||
|
|
- 引入复合止损策略(跟踪止损+固定止损)
|
|||
|
|
- 理由:多层次风险控制可以更好地保护资金,提高长期生存能力
|
|||
|
|
|
|||
|
|
5. **增加时间过滤机制**:
|
|||
|
|
- 添加交易时间窗口限制,避开低流动性时段
|
|||
|
|
- 考虑日内波动模式分析
|
|||
|
|
- 理由:避免在不利交易时段产生信号,提高执行质量和减少滑点
|
|||
|
|
|
|||
|
|
6. **增强信号质量评估**:
|
|||
|
|
- 开发信号强度评分系统,综合多项指标
|
|||
|
|
- 基于信号质量动态调整头寸大小
|
|||
|
|
- 理由:区分高质量和低质量信号,提高资金配置效率
|
|||
|
|
|
|||
|
|
7. **考虑增加机器学习组件**:
|
|||
|
|
- 使用机器学习方法优化参数组合
|
|||
|
|
- 探索使用神经网络预测信号可靠性
|
|||
|
|
- 理由:现代算法可以挖掘传统技术指标无法捕捉的市场规律
|
|||
|
|
|
|||
|
|
# 总结
|
|||
|
|
|
|||
|
|
多重指标趋势确认动态止盈止损交易策略是一个结构完善、逻辑清晰的量化交易系统。它通过SuperTrend、EMA和RSI三重指标确认,形成可靠的交易信号,同时利用基于ATR的动态风险管理机制控制每笔交易的风险。
|
|||
|
|
|
|||
|
|
该策略的核心优势在于多层过滤机制减少了虚假信号,自适应的止损设置能够应对不同的市场波动环境,完善的风险管理系统保障了资金安全。策略参数设计灵活可调,使用者可以根据不同市场特性和个人风险偏好进行定制。
|
|||
|
|
|
|||
|
|
然而,策略也存在趋势转折点反应滞后、横盘震荡市场表现不佳等固有风险。未来优化方向可考虑增加市场环境识别功能,实现参数动态调整,完善RSI应用方式,加强风险管理系统,以及增加信号质量评估机制等。
|
|||
|
|
|
|||
|
|
总体而言,这是一个平衡了信号质量和风险控制的全面策略系统,适合偏好趋势跟踪的交易者。通过持续优化和完善,该策略有潜力成为一个长期稳定盈利的交易系统。 || # Overview
|
|||
|
|
|
|||
|
|
This is a quantitative trading strategy based on multiple indicator confirmations, with the SuperTrend indicator as the core component, combined with the 200-day Exponential Moving Average (EMA) for trend confirmation, Relative Strength Index (RSI) for momentum confirmation, and Average True Range (ATR) for dynamically setting stop-loss and take-profit levels. The strategy employs a multi-layered filtering mechanism to ensure the reliability of trading signals while protecting capital through a flexible risk management system. The strategy design follows trend-following principles, using multiple indicators for collaborative verification to improve trade success rates.
|
|||
|
|
|
|||
|
|
# Strategy Principles
|
|||
|
|
|
|||
|
|
The core principle of this strategy is to filter out low-quality trading signals through multi-layered indicator confirmation while dynamically managing risk:
|
|||
|
|
|
|||
|
|
1. **SuperTrend Signal Identification**:
|
|||
|
|
- Uses the SuperTrend indicator (an ATR-based trend-following indicator) to identify price breakouts
|
|||
|
|
- Generates basic buy signals when price breaks above the SuperTrend line
|
|||
|
|
- Generates basic sell signals when price breaks below the SuperTrend line
|
|||
|
|
|
|||
|
|
2. **Trend Confirmation Mechanism**:
|
|||
|
|
- Uses 200-day EMA to confirm medium to long-term trend direction
|
|||
|
|
- Buy conditions require price to be above the EMA, ensuring alignment with uptrends
|
|||
|
|
- Sell conditions require price to be below the EMA, ensuring alignment with downtrends
|
|||
|
|
|
|||
|
|
3. **Momentum Confirmation Filter**:
|
|||
|
|
- Verifies market momentum using the RSI indicator
|
|||
|
|
- Buy signals require RSI greater than 50, confirming upward momentum
|
|||
|
|
- Sell signals require RSI less than 50, confirming downward momentum
|
|||
|
|
- RSI filtering can be optionally enabled or disabled
|
|||
|
|
|
|||
|
|
4. **Dynamic Risk Management**:
|
|||
|
|
- Dynamically sets stop-loss positions based on ATR, adapting to market volatility
|
|||
|
|
- Buy trade stop-loss is set at: Current price - (ATR multiplier × ATR value)
|
|||
|
|
- Sell trade stop-loss is set at: Current price + (ATR multiplier × ATR value)
|
|||
|
|
|
|||
|
|
5. **Risk-Reward Ratio Control**:
|
|||
|
|
- Sets take-profit targets using a fixed multiplier relationship
|
|||
|
|
- Take-profit levels are automatically calculated based on stop-loss distance, with a default risk-reward ratio of 1:2
|
|||
|
|
|
|||
|
|
The strategy's trading logic is clear: trades are executed only when SuperTrend gives a signal and simultaneously meets trend direction (EMA) and market momentum (optional RSI) conditions. After entry, the system automatically sets stop-loss and take-profit levels based on current market volatility, ensuring effective risk management.
|
|||
|
|
|
|||
|
|
# Strategy Advantages
|
|||
|
|
|
|||
|
|
1. **Multiple Confirmation Filtering Mechanism**:
|
|||
|
|
- Effectively reduces false signals through triple confirmation with SuperTrend, EMA, and RSI
|
|||
|
|
- Multi-layered filtering ensures trading only in high-probability trend environments
|
|||
|
|
- Significantly reduces losing trades in choppy markets
|
|||
|
|
|
|||
|
|
2. **Adaptation to Market Volatility**:
|
|||
|
|
- ATR-based stop-loss settings automatically adapt to volatility in different market conditions
|
|||
|
|
- Automatically widens stop-loss distance during high volatility periods and narrows it during low volatility periods
|
|||
|
|
- Avoids the problems of premature exits or excessive risk caused by fixed stop-losses
|
|||
|
|
|
|||
|
|
3. **Comprehensive Risk Management**:
|
|||
|
|
- Automatically sets stop-loss and take-profit for each trade, eliminating the need for manual monitoring
|
|||
|
|
- Ensures favorable risk-reward ratios through proportional control (default 1:2)
|
|||
|
|
- Systematic risk control reduces emotional interference
|
|||
|
|
|
|||
|
|
4. **Flexible Strategy Parameters**:
|
|||
|
|
- All key parameters can be customized to adapt to different markets and personal risk preferences
|
|||
|
|
- RSI filtering can be optionally enabled or disabled to adjust strategy strictness
|
|||
|
|
- ATR multipliers and take-profit ratios can be optimized according to different market characteristics
|
|||
|
|
|
|||
|
|
5. **Visualization of Trading Signals**:
|
|||
|
|
- Strategy provides clear graphical indicators and trade signal markers
|
|||
|
|
- SuperTrend line color changes intuitively display market trend status
|
|||
|
|
- Buy and sell signals are clearly marked with arrows for backtesting analysis
|
|||
|
|
|
|||
|
|
6. **Rational Capital Management**:
|
|||
|
|
- By default, each trade uses a fixed percentage of the account equity (10%) rather than a fixed contract quantity
|
|||
|
|
- Position sizes automatically adjust with changes in account size, achieving compound growth
|
|||
|
|
- Avoids potential capital management issues associated with fixed lot trading
|
|||
|
|
|
|||
|
|
# Strategy Risks
|
|||
|
|
|
|||
|
|
1. **Delayed Reaction at Trend Reversal Points**:
|
|||
|
|
- Both SuperTrend and EMA are lagging indicators that may not respond promptly at trend reversal points
|
|||
|
|
- May face significant drawdowns in rapidly reversing markets
|
|||
|
|
- Mitigation: Consider adding short-term momentum indicators or volatility breakout detection mechanisms
|
|||
|
|
|
|||
|
|
2. **Poor Performance in Sideways Markets**:
|
|||
|
|
- The strategy design is based on trend-following principles and may result in frequent entries and exits in sideways markets with no clear trend
|
|||
|
|
- May produce consecutive losing trades in choppy markets
|
|||
|
|
- Mitigation: Add trend strength filtering or pause trading when sideways markets are identified
|
|||
|
|
|
|||
|
|
3. **Limitations of Fixed RSI Threshold**:
|
|||
|
|
- Using a fixed RSI threshold (50) may not be suitable for all market environments
|
|||
|
|
- In certain biased markets, RSI may remain in high or low zones for extended periods
|
|||
|
|
- Mitigation: Consider using adaptive RSI thresholds or RSI rate of change rather than absolute levels
|
|||
|
|
|
|||
|
|
4. **Stop-Loss Setting Risks**:
|
|||
|
|
- Although dynamic stop-losses based on ATR have advantages, they may be set too wide in extremely volatile markets
|
|||
|
|
- Black swan events may directly breach stop-loss levels
|
|||
|
|
- Mitigation: Add maximum stop-loss limits or implement volatility anomaly detection mechanisms
|
|||
|
|
|
|||
|
|
5. **Over-Optimization Risk**:
|
|||
|
|
- The strategy has multiple adjustable parameters, creating a risk of overfitting historical data
|
|||
|
|
- Optimized parameter combinations may not be applicable to future markets
|
|||
|
|
- Mitigation: Use step-forward testing or segmented validation to ensure parameter robustness
|
|||
|
|
|
|||
|
|
6. **Capital Management Considerations**:
|
|||
|
|
- Using a default 10% account equity per trade may be too risky in some situations
|
|||
|
|
- Consecutive losses could significantly impact capital
|
|||
|
|
- Mitigation: Adjust position sizing based on strategy backtest performance and personal risk tolerance
|
|||
|
|
|
|||
|
|
# Strategy Optimization Directions
|
|||
|
|
|
|||
|
|
1. **Enhance Market Environment Adaptability**:
|
|||
|
|
- Develop market type identification functionality to distinguish between trending and ranging markets
|
|||
|
|
- Dynamically adjust trading parameters in different market environments
|
|||
|
|
- Rationale: Improve strategy adaptability across various market conditions and reduce false signals in ranging markets
|
|||
|
|
|
|||
|
|
2. **Implement Dynamic Parameter Adjustments**:
|
|||
|
|
- Automatically adjust SuperTrend factors based on market volatility
|
|||
|
|
- Increase factor values in high-volatility markets and decrease them in low-volatility markets
|
|||
|
|
- Rationale: Avoid limitations of fixed parameters and improve strategy responsiveness to market changes
|
|||
|
|
|
|||
|
|
3. **Optimize RSI Application Method**:
|
|||
|
|
- Replace fixed RSI thresholds with dynamic thresholds or trendline breakouts
|
|||
|
|
- Consider RSI divergence signals as auxiliary indicators
|
|||
|
|
- Rationale: Enhance RSI indicator effectiveness across different market environments and increase strategy robustness
|
|||
|
|
|
|||
|
|
4. **Enhance Risk Management System**:
|
|||
|
|
- Add maximum drawdown control
|
|||
|
|
- Implement volatility-based dynamic position sizing
|
|||
|
|
- Introduce compound stop-loss strategies (trailing stops + fixed stops)
|
|||
|
|
- Rationale: Multi-level risk control can better protect capital and improve long-term survival ability
|
|||
|
|
|
|||
|
|
5. **Add Time Filtering Mechanism**:
|
|||
|
|
- Add trading time window restrictions to avoid low liquidity periods
|
|||
|
|
- Consider intraday volatility pattern analysis
|
|||
|
|
- Rationale: Avoid generating signals during unfavorable trading sessions, improve execution quality, and reduce slippage
|
|||
|
|
|
|||
|
|
6. **Enhance Signal Quality Assessment**:
|
|||
|
|
- Develop a signal strength scoring system integrating multiple indicators
|
|||
|
|
- Dynamically adjust position sizes based on signal quality
|
|||
|
|
- Rationale: Differentiate between high and low-quality signals and improve capital allocation efficiency
|
|||
|
|
|
|||
|
|
7. **Consider Adding Machine Learning Components**:
|
|||
|
|
- Use machine learning methods to optimize parameter combinations
|
|||
|
|
- Explore using neural networks to predict signal reliability
|
|||
|
|
- Rationale: Modern algorithms can uncover market patterns that traditional technical indicators cannot capture
|
|||
|
|
|
|||
|
|
# Summary
|
|||
|
|
|
|||
|
|
The Multi-Indicator Trend Confirmation Dynamic Risk Management Trading Strategy is a well-structured, logically sound quantitative trading system. It forms reliable trading signals through triple confirmation with SuperTrend, EMA, and RSI indicators, while controlling risk for each trade using an ATR-based dynamic risk management mechanism.
|
|||
|
|
|
|||
|
|
The core advantages of this strategy lie in its multi-layered filtering mechanism that reduces false signals, adaptive stop-loss settings that handle different market volatility environments, and comprehensive risk management system that ensures capital protection. The strategy parameters are designed to be flexible and adjustable, allowing users to customize according to different market characteristics and personal risk preferences.
|
|||
|
|
|
|||
|
|
However, the strategy also has inherent risks such as delayed reactions at trend reversal points and poor performance in sideways markets. Future optimization directions may include adding market environment identification functionality, implementing dynamic parameter adjustments, improving RSI application methods, enhancing the risk management system, and adding signal quality assessment mechanisms.
|
|||
|
|
|
|||
|
|
Overall, this is a comprehensive strategy system that balances signal quality and risk control, suitable for traders who prefer trend following. Through continuous optimization and improvement, this strategy has the potential to become a long-term, consistently profitable trading system.[/trans]
|
|||
|
|
|
|||
|
|
|
|||
|
|
|
|||
|
|
> Source (PineScript)
|
|||
|
|
|
|||
|
|
``` pinescript
|
|||
|
|
/*backtest
|
|||
|
|
start: 2024-06-21 00:00:00
|
|||
|
|
end: 2025-03-03 08:00:00
|
|||
|
|
period: 3h
|
|||
|
|
basePeriod: 3h
|
|||
|
|
exchanges: [{"eid":"Futures_Binance","currency":"ETH_USDT"}]
|
|||
|
|
*/
|
|||
|
|
|
|||
|
|
//@version=6
|
|||
|
|
strategy("Super Trend with EMA, RSI & Signals", overlay=true, default_qty_type=strategy.percent_of_equity, default_qty_value=10)
|
|||
|
|
|
|||
|
|
// Super Trend Indicator
|
|||
|
|
atrLength = input.int(10, title="ATR Length")
|
|||
|
|
factor = input.float(3.0, title="Super Trend Multiplier")
|
|||
|
|
[st, direction] = ta.supertrend(factor, atrLength)
|
|||
|
|
|
|||
|
|
// 200 EMA for Trend Confirmation
|
|||
|
|
emaLength = input.int(200, title="EMA Length")
|
|||
|
|
ema200 = ta.ema(close, emaLength)
|
|||
|
|
|
|||
|
|
// RSI for Momentum Confirmation
|
|||
|
|
rsiLength = input.int(14, title="RSI Length")
|
|||
|
|
rsi = ta.rsi(close, rsiLength)
|
|||
|
|
useRSIFilter = input.bool(true, title="Use RSI Filter?")
|
|||
|
|
rsiThreshold = 50
|
|||
|
|
|
|||
|
|
// Buy & Sell Conditions
|
|||
|
|
buyCondition = ta.crossover(close, st) and close > ema200 and (not useRSIFilter or rsi > rsiThreshold)
|
|||
|
|
sellCondition = ta.crossunder(close, st) and close < ema200 and (not useRSIFilter or rsi < rsiThreshold)
|
|||
|
|
|
|||
|
|
// Stop Loss & Take Profit (Based on ATR)
|
|||
|
|
atrMultiplier = input.float(1.5, title="ATR Stop Loss Multiplier")
|
|||
|
|
atrValue = ta.atr(atrLength)
|
|||
|
|
stopLossBuy = close - (atrMultiplier * atrValue)
|
|||
|
|
stopLossSell = close + (atrMultiplier * atrValue)
|
|||
|
|
takeProfitMultiplier = input.float(2.0, title="Take Profit Multiplier")
|
|||
|
|
takeProfitBuy = close + (takeProfitMultiplier * (close - stopLossBuy))
|
|||
|
|
takeProfitSell = close - (takeProfitMultiplier * (stopLossSell - close))
|
|||
|
|
|
|||
|
|
// Execute Trades
|
|||
|
|
if buyCondition
|
|||
|
|
strategy.entry("Buy", strategy.long)
|
|||
|
|
strategy.exit("Take Profit Buy", from_entry="Buy", limit=takeProfitBuy, stop=stopLossBuy)
|
|||
|
|
|
|||
|
|
if sellCondition
|
|||
|
|
strategy.entry("Sell", strategy.short)
|
|||
|
|
strategy.exit("Take Profit Sell", from_entry="Sell", limit=takeProfitSell, stop=stopLossSell)
|
|||
|
|
|
|||
|
|
// Plot Indicators
|
|||
|
|
plot(ema200, title="200 EMA", color=color.blue, linewidth=2)
|
|||
|
|
plot(st, title="Super Trend", color=(direction == 1 ? color.green : color.red), style=plot.style_stepline)
|
|||
|
|
|
|||
|
|
// Plot Buy & Sell Signals as Arrows
|
|||
|
|
plotshape(series=buyCondition, location=location.belowbar, color=color.green, style=shape.labelup, title="Buy Signal", text="BUY")
|
|||
|
|
plotshape(series=sellCondition, location=location.abovebar, color=color.red, style=shape.labeldown, title="Sell Signal", text="SELL")
|
|||
|
|
|
|||
|
|
```
|
|||
|
|
|
|||
|
|
> Detail
|
|||
|
|
|
|||
|
|
https://www.fmz.com/strategy/484921
|
|||
|
|
|
|||
|
|
> Last Modified
|
|||
|
|
|
|||
|
|
2025-03-05 10:19:52
|