189 lines
6.8 KiB
Markdown
189 lines
6.8 KiB
Markdown

|
|
||
|
|
> Name
|
||
|
|
|
||
|
|
多重指数移动平均线交叉策略-Multi-EMA-Crossover-Strategy
|
||
|
|
|
||
|
|
> Author
|
||
|
|
|
||
|
|
ianzeng123
|
||
|
|
|
||
|
|
> Strategy Description
|
||
|
|
|
||
|
|
|
||
|
|
|
||
|
|
|
||
|
|
|
||
|
|
|
||
|
|
[trans]
|
||
|
|
#### 概述
|
||
|
|
|
||
|
|
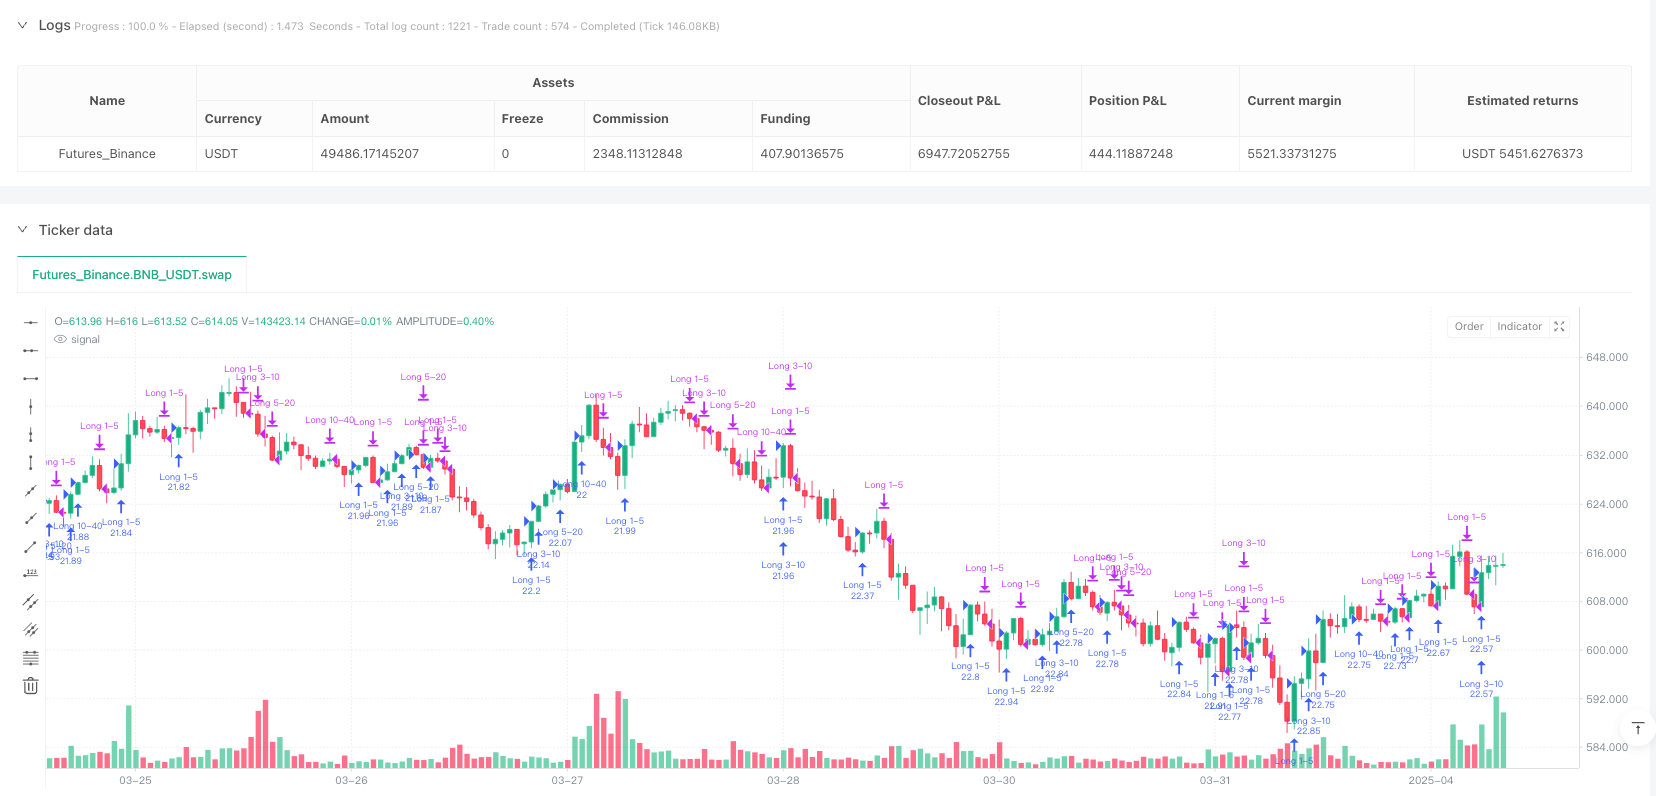
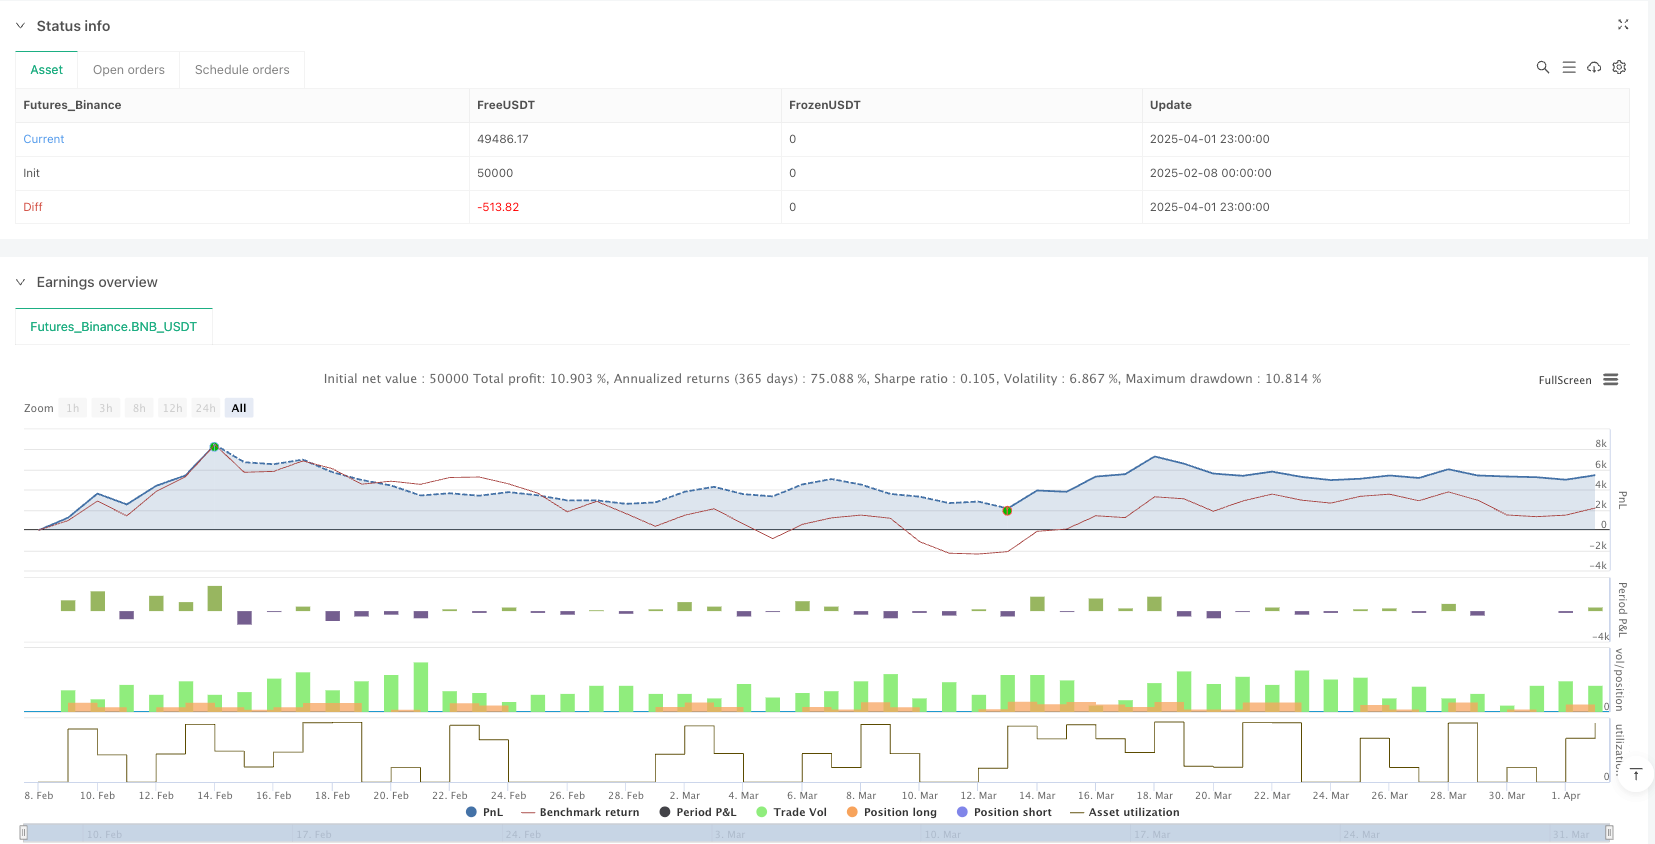
这是一种基于多重指数移动平均线(EMA)交叉的量化交易策略,通过捕捉不同时间周期EMA的交叉点来识别市场趋势,并生成交易信号。该策略旨在通过逐步确认的方式捕捉市场动量,并提供直观的可视化趋势判断机制。
|
||
|
|
|
||
|
|
#### 策略原理
|
||
|
|
|
||
|
|
策略的核心逻辑基于四个不同周期EMA的交叉信号:
|
||
|
|
1. 第一入场信号:1日EMA上穿5日EMA,表示初步上涨动量
|
||
|
|
2. 第二入场信号:3日EMA上穿10日EMA,确认更强的上涨趋势
|
||
|
|
3. 第三入场信号:5日EMA上穿20日EMA,显示趋势进一步发展
|
||
|
|
4. 第四入场信号:10日EMA上穿40日EMA,表明长期牛市动能
|
||
|
|
|
||
|
|
策略通过颜色编码直观展示市场情绪:蓝色系表示看涨,红色系表示看跌。颜色深浅反映了短期EMA相对长期EMA的位置关系。
|
||
|
|
|
||
|
|
#### 策略优势
|
||
|
|
|
||
|
|
1. 渐进式确认:多重EMA交叉提供分层趋势确认机制
|
||
|
|
2. 可视化反馈:柱状图颜色快速呈现市场情绪变化
|
||
|
|
3. 灵活性强:适用于比特币等具有明显趋势性的市场
|
||
|
|
4. 动态头寸管理:可逐步增加仓位,降低单次交易风险
|
||
|
|
5. 趋势跟踪能力:能捕捉不同时间尺度的市场动量
|
||
|
|
|
||
|
|
#### 策略风险
|
||
|
|
|
||
|
|
1. 滞后性:EMA作为滞后指标,可能对突发价格变化反应缓慢
|
||
|
|
2. 假突破风险:在震荡市场中可能产生错误信号
|
||
|
|
3. 多头仓位风险:金字塔式建仓可能增加整体风险敞口
|
||
|
|
|
||
|
|
#### 策略优化方向
|
||
|
|
|
||
|
|
1. 引入附加过滤条件,如成交量确认、波动率指标
|
||
|
|
2. 结合止损机制,如凯利准则控制单笔交易风险
|
||
|
|
3. 针对不同市场环境调整EMA参数
|
||
|
|
4. 增加趋势强度评估模块
|
||
|
|
5. 引入机器学习算法动态调整入场策略
|
||
|
|
|
||
|
|
#### 总结
|
||
|
|
|
||
|
|
多重EMA交叉策略通过渐进式信号生成和直观的可视化机制,为交易者提供了一种捕捉市场趋势的系统化方法。尽管存在一定局限性,但通过持续优化和风险管理,该策略仍具有显著的实践价值。
|
||
|
|
|
||
|
|
||
|
||
|
|
|
||
|
|
#### Overview
|
||
|
|
|
||
|
|
This is a quantitative trading strategy based on multiple exponential moving average (EMA) crossovers, designed to identify market trends by capturing crossover points of EMAs at different time periods and generate trading signals. The strategy aims to capture market momentum through progressive confirmation and provide an intuitive visualization mechanism for trend judgment.
|
||
|
|
|
||
|
|
#### Strategy Principles
|
||
|
|
|
||
|
|
The core logic is based on crossover signals from four different EMA periods:
|
||
|
|
1. First Entry Signal: 1-day EMA crosses above 5-day EMA, indicating initial upward momentum
|
||
|
|
2. Second Entry Signal: 3-day EMA crosses above 10-day EMA, confirming stronger upward trend
|
||
|
|
3. Third Entry Signal: 5-day EMA crosses above 20-day EMA, showing further trend development
|
||
|
|
4. Fourth Entry Signal: 10-day EMA crosses above 40-day EMA, demonstrating long-term bullish momentum
|
||
|
|
|
||
|
|
The strategy intuitively displays market sentiment through color coding: blue tones represent bullish, red tones represent bearish. Color intensity reflects the relative position of short-term EMAs to long-term EMAs.
|
||
|
|
|
||
|
|
#### Strategy Advantages
|
||
|
|
|
||
|
|
1. Progressive Confirmation: Multiple EMA crossovers provide layered trend confirmation
|
||
|
|
2. Visual Feedback: Bar colors quickly present market sentiment changes
|
||
|
|
3. High Flexibility: Suitable for trend-driven markets like Bitcoin
|
||
|
|
4. Dynamic Position Management: Gradual position increase reduces single-trade risk
|
||
|
|
5. Trend Tracking Capability: Can capture market momentum across different time scales
|
||
|
|
|
||
|
|
#### Strategy Risks
|
||
|
|
|
||
|
|
1. Lagging Characteristic: EMAs as lagging indicators may react slowly to sudden price changes
|
||
|
|
2. False Breakout Risk: Potential for generating incorrect signals in oscillating markets
|
||
|
|
3. Multiple Position Risk: Pyramid-style position building may increase overall risk exposure
|
||
|
|
|
||
|
|
#### Strategy Optimization Directions
|
||
|
|
|
||
|
|
1. Introduce additional filtering conditions, such as volume confirmation or volatility indicators
|
||
|
|
2. Incorporate stop-loss mechanisms like Kelly Criterion for single-trade risk control
|
||
|
|
3. Adjust EMA parameters for different market environments
|
||
|
|
4. Enhance trend strength assessment module
|
||
|
|
5. Introduce machine learning algorithms for dynamic entry strategy adjustment
|
||
|
|
|
||
|
|
#### Summary
|
||
|
|
|
||
|
|
The Multi-EMA Crossover Strategy provides traders with a systematic method of capturing market trends through progressive signal generation and intuitive visualization. Despite certain limitations, the strategy remains valuable through continuous optimization and risk management.[/trans]
|
||
|
|
|
||
|
|
|
||
|
|
|
||
|
|
> Source (PineScript)
|
||
|
|
|
||
|
|
``` pinescript
|
||
|
|
/*backtest
|
||
|
|
start: 2025-02-08 00:00:00
|
||
|
|
end: 2025-04-02 00:00:00
|
||
|
|
period: 1h
|
||
|
|
basePeriod: 1h
|
||
|
|
exchanges: [{"eid":"Futures_Binance","currency":"BNB_USDT"}]
|
||
|
|
*/
|
||
|
|
|
||
|
|
// This Pine Script® code is subject to the terms of the Mozilla Public License 2.0 at https://mozilla.org/MPL/2.0/
|
||
|
|
// © joll3d
|
||
|
|
|
||
|
|
//@version=5
|
||
|
|
strategy("Multi-EMA Crossover Strategy", overlay=true, initial_capital=10000, default_qty_type=strategy.percent_of_equity, pyramiding=4, default_qty_value=25)
|
||
|
|
|
||
|
|
// Calculate EMAs
|
||
|
|
ema1 = ta.ema(close, 1)
|
||
|
|
ema5 = ta.ema(close, 5)
|
||
|
|
ema3 = ta.ema(close, 3)
|
||
|
|
ema10 = ta.ema(close, 10)
|
||
|
|
ema20 = ta.ema(close, 20)
|
||
|
|
ema40 = ta.ema(close, 40)
|
||
|
|
|
||
|
|
// Define crossover conditions
|
||
|
|
longCondition1 = ta.crossover(ema1, ema5)
|
||
|
|
longCondition2 = ta.crossover(ema3, ema10)
|
||
|
|
longCondition3 = ta.crossover(ema5, ema20)
|
||
|
|
longCondition4 = ta.crossover(ema10, ema40)
|
||
|
|
|
||
|
|
shortCondition1 = ema1 < ema5
|
||
|
|
shortCondition2 = ema3 < ema10
|
||
|
|
shortCondition3 = ema5 < ema20
|
||
|
|
shortCondition4 = ema10 < ema40
|
||
|
|
|
||
|
|
// Execute long entries
|
||
|
|
if (longCondition1)
|
||
|
|
strategy.entry("Long 1-5", strategy.long)
|
||
|
|
if (longCondition2)
|
||
|
|
strategy.entry("Long 3-10", strategy.long)
|
||
|
|
if (longCondition3)
|
||
|
|
strategy.entry("Long 5-20", strategy.long)
|
||
|
|
if (longCondition4)
|
||
|
|
strategy.entry("Long 10-40", strategy.long)
|
||
|
|
|
||
|
|
if (shortCondition1)
|
||
|
|
strategy.close("Long 1-5")
|
||
|
|
if (shortCondition2)
|
||
|
|
strategy.close("Long 3-10")
|
||
|
|
if (shortCondition3)
|
||
|
|
strategy.close("Long 5-20")
|
||
|
|
if (shortCondition4)
|
||
|
|
strategy.close("Long 10-40")
|
||
|
|
|
||
|
|
// Calculate trend strength
|
||
|
|
bullishStrength = 0
|
||
|
|
bullishStrength := (ema1 > ema5 ? 1 : 0) +
|
||
|
|
(ema3 > ema10 ? 1 : 0) +
|
||
|
|
(ema5 > ema20 ? 1 : 0) +
|
||
|
|
(ema10 > ema40 ? 1 : 0)
|
||
|
|
|
||
|
|
//set bar colors
|
||
|
|
bullishColor = color.blue
|
||
|
|
semiBullishColor = color.rgb(175, 213, 243)
|
||
|
|
semiBearishColor = color.rgb(245, 178, 178)
|
||
|
|
bearishColor = color.red
|
||
|
|
|
||
|
|
barColor = bearishColor
|
||
|
|
if bullishStrength == 2
|
||
|
|
barColor := semiBearishColor
|
||
|
|
if bullishStrength == 3
|
||
|
|
barColor := semiBullishColor
|
||
|
|
if bullishStrength == 4
|
||
|
|
barColor := bullishColor
|
||
|
|
|
||
|
|
barcolor(barColor)
|
||
|
|
|
||
|
|
```
|
||
|
|
|
||
|
|
> Detail
|
||
|
|
|
||
|
|
https://www.fmz.com/strategy/489304
|
||
|
|
|
||
|
|
> Last Modified
|
||
|
|
|
||
|
|
2025-04-03 11:46:37
|