245 lines
12 KiB
Markdown
245 lines
12 KiB
Markdown

|
|
||
|
|
> Name
|
||
|
|
|
||
|
|
多重指数移动平均交叉策略-Multi-EMA-Crossover-Stop-Strategy
|
||
|
|
|
||
|
|
> Author
|
||
|
|
|
||
|
|
ChaoZhang
|
||
|
|
|
||
|
|
> Strategy Description
|
||
|
|
|
||
|
|
|
||
|
|
[trans]
|
||
|
|
#### 概述
|
||
|
|
|
||
|
|
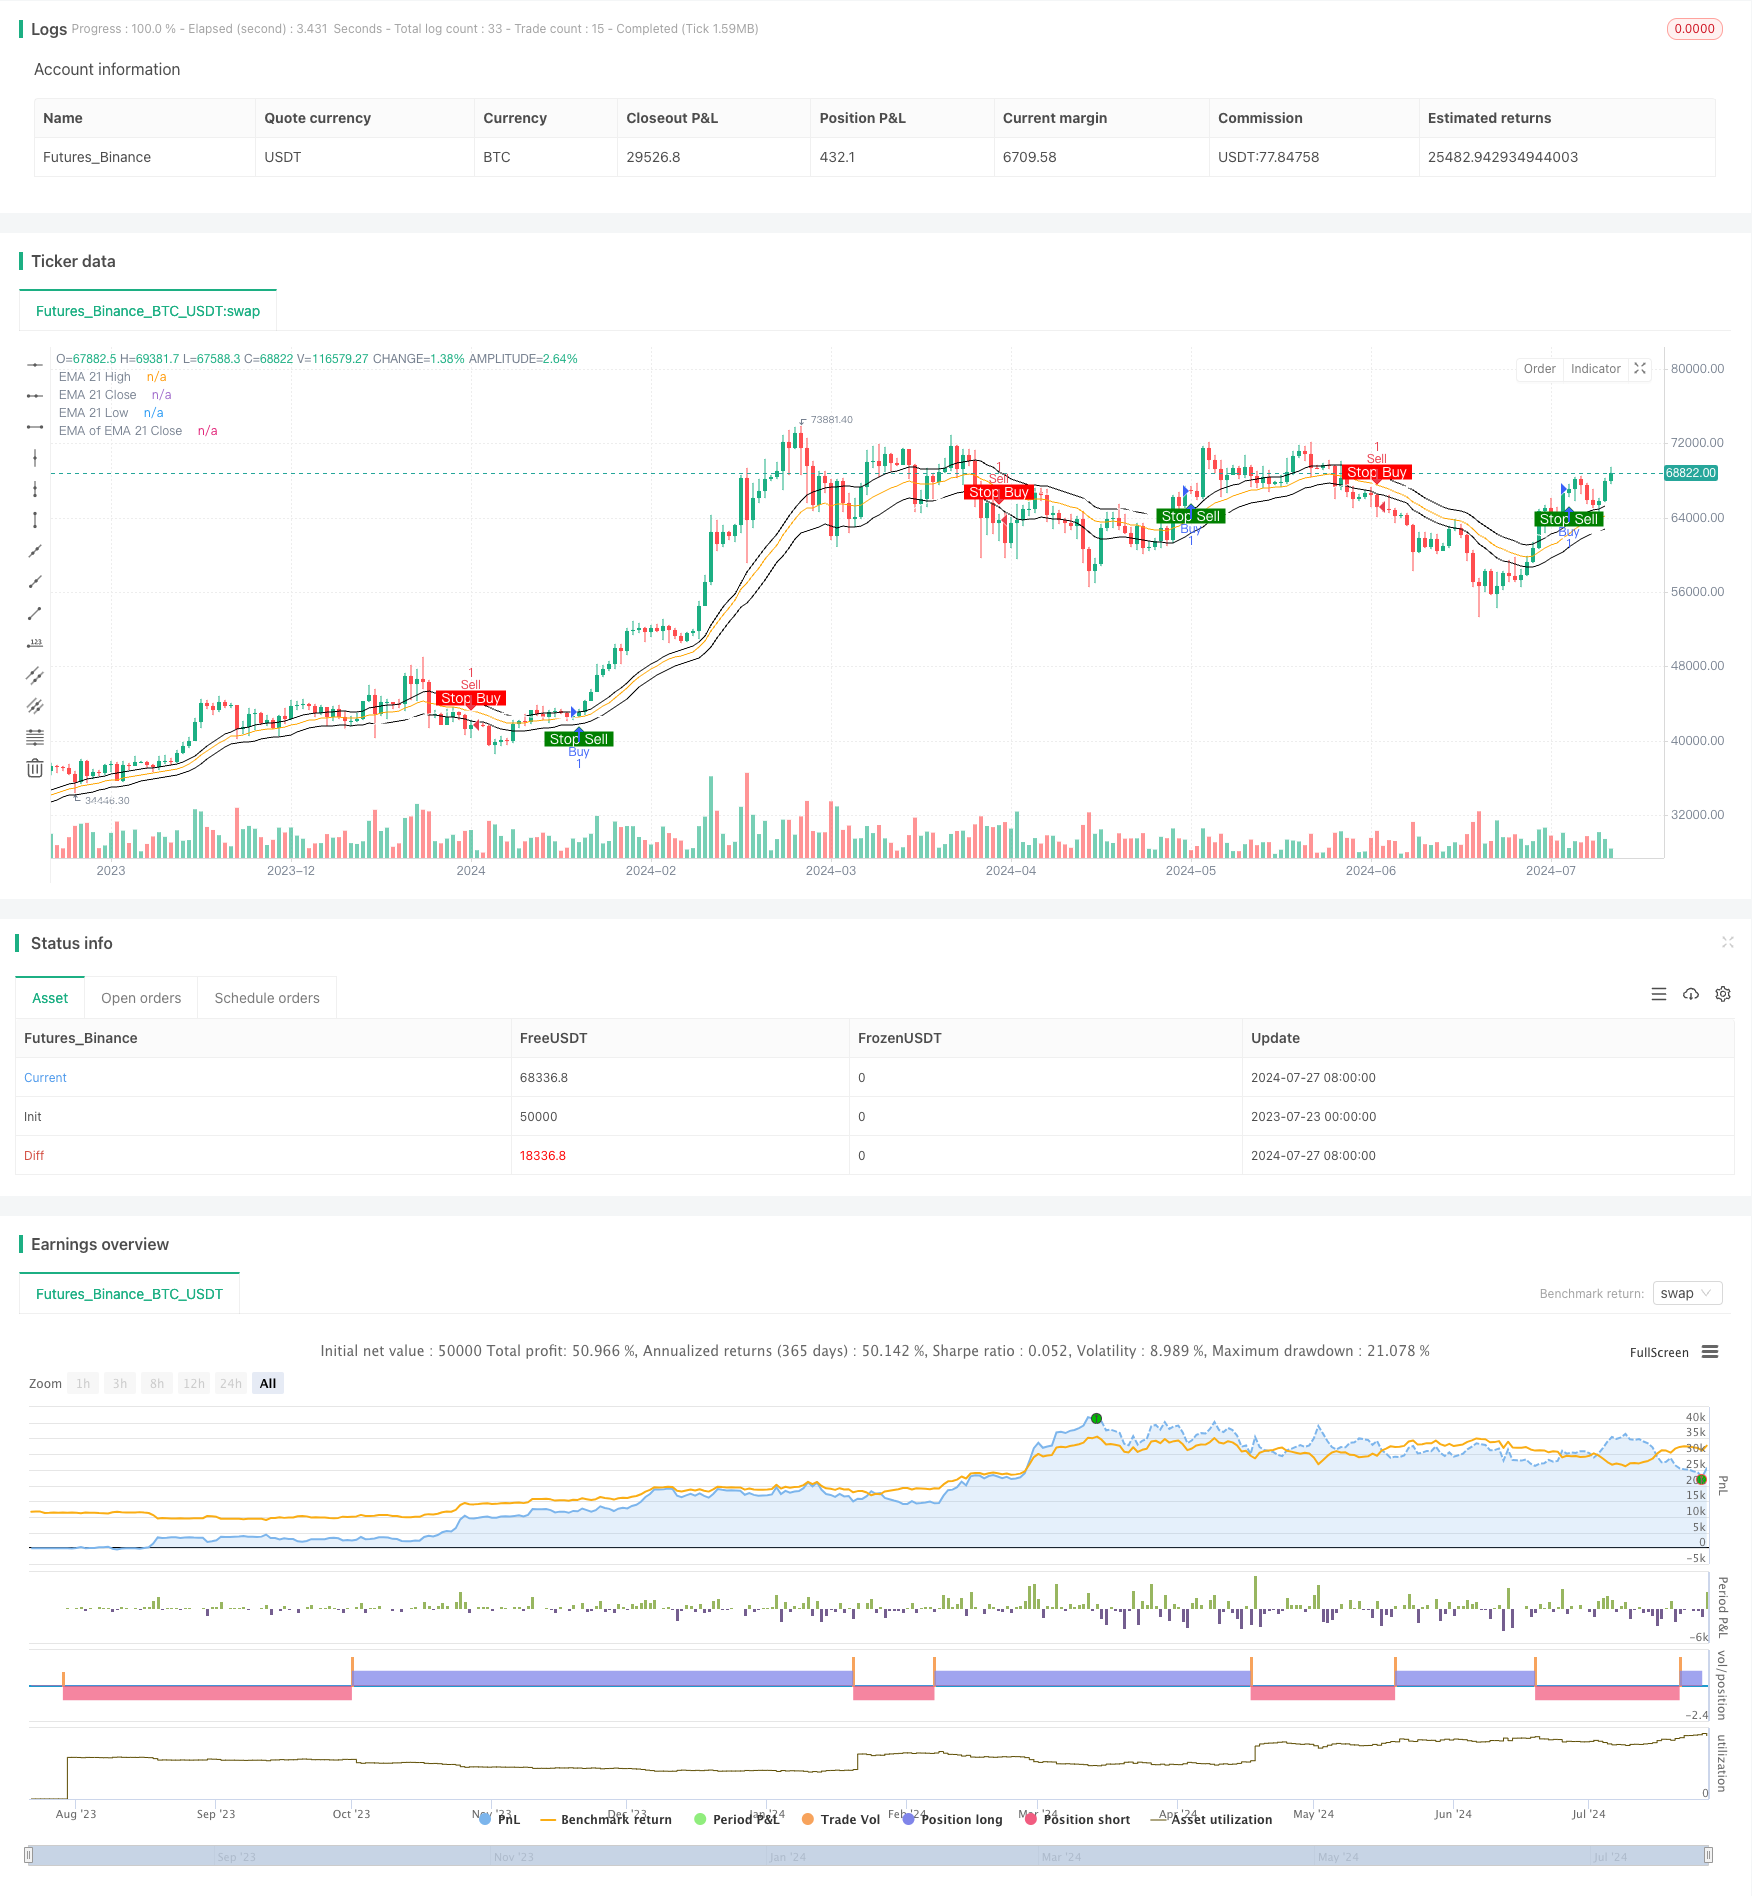
多重指数移动平均交叉策略是一种基于多个指数移动平均线(EMA)交叉信号的量化交易策略。该策略利用21周期EMA应用于不同价格数据(最高价、收盘价和最低价),以及对21周期收盘价EMA的二次平滑,通过这些均线之间的交叉来产生买入和卖出信号。策略的核心思想是捕捉市场趋势的变化,并在趋势反转时发出停止买入或停止卖出的信号,从而帮助交易者及时调整持仓。
|
||
|
|
|
||
|
|
#### 策略原理
|
||
|
|
|
||
|
|
1. 计算四条EMA线:
|
||
|
|
- 21周期最高价EMA
|
||
|
|
- 21周期收盘价EMA
|
||
|
|
- 21周期最低价EMA
|
||
|
|
- 21周期收盘价EMA的21周期EMA(二次平滑)
|
||
|
|
|
||
|
|
2. 信号生成:
|
||
|
|
- 买入信号:当21周期收盘价EMA上穿二次平滑的EMA时
|
||
|
|
- 卖出信号:当21周期收盘价EMA下穿二次平滑的EMA时
|
||
|
|
|
||
|
|
3. 交易执行:
|
||
|
|
- 出现买入信号时,策略进入多头头寸
|
||
|
|
- 出现卖出信号时,策略进入空头头寸
|
||
|
|
|
||
|
|
4. 可视化:
|
||
|
|
- 在图表上绘制所有EMA线
|
||
|
|
- 买入信号显示为上升箭头,标记"Stop Sell"
|
||
|
|
- 卖出信号显示为下降箭头,标记"Stop Buy"
|
||
|
|
|
||
|
|
#### 策略优势
|
||
|
|
|
||
|
|
1. 多重确认:通过使用多条EMA线,策略能够从不同角度确认市场趋势,减少虚假信号。
|
||
|
|
|
||
|
|
2. 趋势跟踪:EMA的特性使得策略能够有效捕捉中长期趋势,适合跟随趋势型交易。
|
||
|
|
|
||
|
|
3. 灵活性:策略允许用户自定义各项参数,包括EMA周期、颜色等,可以根据不同市场和个人偏好进行调整。
|
||
|
|
|
||
|
|
4. 视觉直观:通过在图表上直观显示多条EMA线和交易信号,交易者可以更容易理解市场动态。
|
||
|
|
|
||
|
|
5. 风险管理:使用"Stop Buy"和"Stop Sell"概念,提醒交易者在趋势可能反转时停止相应方向的交易,有助于控制风险。
|
||
|
|
|
||
|
|
6. 自动化:策略可以轻松实现自动化交易,减少人为情绪干扰。
|
||
|
|
|
||
|
|
#### 策略风险
|
||
|
|
|
||
|
|
1. 滞后性:作为滞后指标,EMA可能在快速变化的市场中反应不够及时,导致入场或出场延迟。
|
||
|
|
|
||
|
|
2. 震荡市不适用:在横盘震荡市场中,策略可能产生频繁的虚假信号,增加交易成本。
|
||
|
|
|
||
|
|
3. 参数敏感性:不同的EMA参数设置可能导致完全不同的结果,需要仔细优化和回测。
|
||
|
|
|
||
|
|
4. 缺乏止损机制:策略本身没有明确的止损机制,可能在趋势突然逆转时承受较大损失。
|
||
|
|
|
||
|
|
5. 过度依赖技术指标:忽视了基本面和其他市场因素的影响,可能错过重要的交易机会或陷入陷阱。
|
||
|
|
|
||
|
|
#### 策略优化方向
|
||
|
|
|
||
|
|
1. 引入额外过滤器:考虑结合其他技术指标(如RSI、MACD)或价格行为模式,以减少虚假信号。
|
||
|
|
|
||
|
|
2. 动态参数调整:实现EMA周期的动态调整,以适应不同的市场波动状况。
|
||
|
|
|
||
|
|
3. 加入止损和止盈机制:设置基于ATR或固定百分比的止损和止盈点,以更好地控制风险和锁定利润。
|
||
|
|
|
||
|
|
4. 优化入场时机:考虑在信号出现后等待回调或确认,以获得更好的入场价格。
|
||
|
|
|
||
|
|
5. 增加交易量分析:结合成交量指标,以提高信号的可靠性。
|
||
|
|
|
||
|
|
6. 实现自适应性:根据市场状态(趋势/震荡)自动调整策略参数或切换交易逻辑。
|
||
|
|
|
||
|
|
7. 整合多时间周期分析:考虑更高时间周期的趋势确认,以减少逆势交易。
|
||
|
|
|
||
|
|
#### 总结
|
||
|
|
|
||
|
|
多重指数移动平均交叉策略是一种强大而灵活的趋势跟踪系统,通过多条EMA线的交叉来捕捉市场动向。它的主要优势在于能够提供清晰的视觉信号和自动化交易能力,同时具有高度的可定制性。然而,该策略也面临着滞后性和在震荡市场中表现欠佳等挑战。
|
||
|
|
|
||
|
|
为了进一步提高策略的有效性,交易者可以考虑引入额外的过滤机制,优化参数设置,并结合其他技术和基本面分析方法。同时,加入适当的风险管理措施,如止损和止盈机制,对于策略的长期成功至关重要。
|
||
|
|
|
||
|
|
总的来说,这种策略为交易者提供了一个solid的基础框架,可以根据个人交易风格和市场特性进行定制和优化。通过持续的回测和实盘验证,交易者可以逐步完善策略,提高其在不同市场环境下的适应性和盈利能力。
|
||
|
|
|
||
|
|
||
|
||
|
|
|
||
|
|
#### Overview
|
||
|
|
|
||
|
|
The Multi-EMA Crossover Stop Strategy is a quantitative trading approach that utilizes multiple Exponential Moving Averages (EMAs) to generate buy and sell signals. This strategy applies 21-period EMAs to different price data (high, close, and low) and a second-smoothed EMA of the 21-period close EMA. The core idea is to capture market trend changes and issue stop buy or stop sell signals when trends reverse, helping traders adjust their positions timely.
|
||
|
|
|
||
|
|
#### Strategy Principles
|
||
|
|
|
||
|
|
1. Calculate four EMA lines:
|
||
|
|
- 21-period EMA of high prices
|
||
|
|
- 21-period EMA of close prices
|
||
|
|
- 21-period EMA of low prices
|
||
|
|
- 21-period EMA of the 21-period close EMA (double-smoothed)
|
||
|
|
|
||
|
|
2. Signal Generation:
|
||
|
|
- Buy signal: When the 21-period close EMA crosses above the double-smoothed EMA
|
||
|
|
- Sell signal: When the 21-period close EMA crosses below the double-smoothed EMA
|
||
|
|
|
||
|
|
3. Trade Execution:
|
||
|
|
- Enter long position on buy signals
|
||
|
|
- Enter short position on sell signals
|
||
|
|
|
||
|
|
4. Visualization:
|
||
|
|
- Plot all EMA lines on the chart
|
||
|
|
- Display buy signals as upward arrows labeled "Stop Sell"
|
||
|
|
- Display sell signals as downward arrows labeled "Stop Buy"
|
||
|
|
|
||
|
|
#### Strategy Advantages
|
||
|
|
|
||
|
|
1. Multiple Confirmations: By using multiple EMA lines, the strategy confirms market trends from different angles, reducing false signals.
|
||
|
|
|
||
|
|
2. Trend Following: The characteristics of EMAs allow the strategy to effectively capture medium to long-term trends, suitable for trend-following trading.
|
||
|
|
|
||
|
|
3. Flexibility: The strategy allows users to customize various parameters, including EMA periods and colors, adaptable to different markets and personal preferences.
|
||
|
|
|
||
|
|
4. Visual Intuitiveness: By visually displaying multiple EMA lines and trading signals on the chart, traders can more easily understand market dynamics.
|
||
|
|
|
||
|
|
5. Risk Management: The use of "Stop Buy" and "Stop Sell" concepts reminds traders to stop trading in the respective direction when trends may reverse, helping to control risk.
|
||
|
|
|
||
|
|
6. Automation: The strategy can be easily automated, reducing emotional interference in trading decisions.
|
||
|
|
|
||
|
|
#### Strategy Risks
|
||
|
|
|
||
|
|
1. Lag: As lagging indicators, EMAs may not react quickly enough in fast-changing markets, leading to delayed entries or exits.
|
||
|
|
|
||
|
|
2. Ineffective in Ranging Markets: In sideways, choppy markets, the strategy may generate frequent false signals, increasing trading costs.
|
||
|
|
|
||
|
|
3. Parameter Sensitivity: Different EMA parameter settings can lead to entirely different results, requiring careful optimization and backtesting.
|
||
|
|
|
||
|
|
4. Lack of Stop-Loss Mechanism: The strategy itself doesn't have a clear stop-loss mechanism, potentially leading to significant losses in sudden trend reversals.
|
||
|
|
|
||
|
|
5. Over-reliance on Technical Indicators: Ignoring fundamental and other market factors may result in missed important trading opportunities or falling into traps.
|
||
|
|
|
||
|
|
#### Strategy Optimization Directions
|
||
|
|
|
||
|
|
1. Introduce Additional Filters: Consider combining other technical indicators (e.g., RSI, MACD) or price action patterns to reduce false signals.
|
||
|
|
|
||
|
|
2. Dynamic Parameter Adjustment: Implement dynamic adjustment of EMA periods to adapt to different market volatility conditions.
|
||
|
|
|
||
|
|
3. Add Stop-Loss and Take-Profit Mechanisms: Set stop-loss and take-profit points based on ATR or fixed percentages to better control risk and lock in profits.
|
||
|
|
|
||
|
|
4. Optimize Entry Timing: Consider waiting for pullbacks or confirmations after signals appear to get better entry prices.
|
||
|
|
|
||
|
|
5. Incorporate Volume Analysis: Combine volume indicators to improve signal reliability.
|
||
|
|
|
||
|
|
6. Implement Adaptivity: Automatically adjust strategy parameters or switch trading logic based on market states (trending/ranging).
|
||
|
|
|
||
|
|
7. Integrate Multi-Timeframe Analysis: Consider trend confirmation on higher timeframes to reduce counter-trend trades.
|
||
|
|
|
||
|
|
#### Conclusion
|
||
|
|
|
||
|
|
The Multi-EMA Crossover Stop Strategy is a powerful and flexible trend-following system that captures market directions through the crossovers of multiple EMA lines. Its main advantages lie in providing clear visual signals and automated trading capabilities while offering high customizability. However, the strategy also faces challenges such as lag and poor performance in ranging markets.
|
||
|
|
|
||
|
|
To further improve the strategy's effectiveness, traders can consider introducing additional filtering mechanisms, optimizing parameter settings, and combining other technical and fundamental analysis methods. Additionally, incorporating appropriate risk management measures, such as stop-loss and take-profit mechanisms, is crucial for the strategy's long-term success.
|
||
|
|
|
||
|
|
Overall, this strategy provides traders with a solid foundation framework that can be customized and optimized according to individual trading styles and market characteristics. Through continuous backtesting and live trading validation, traders can gradually refine the strategy, improving its adaptability and profitability across different market environments.
|
||
|
|
|
||
|
|
[/trans]
|
||
|
|
|
||
|
|
|
||
|
|
|
||
|
|
> Source (PineScript)
|
||
|
|
|
||
|
|
``` pinescript
|
||
|
|
/*backtest
|
||
|
|
start: 2023-07-23 00:00:00
|
||
|
|
end: 2024-07-28 00:00:00
|
||
|
|
period: 1d
|
||
|
|
basePeriod: 1h
|
||
|
|
exchanges: [{"eid":"Futures_Binance","currency":"BTC_USDT"}]
|
||
|
|
*/
|
||
|
|
|
||
|
|
//@version=5
|
||
|
|
strategy("Stop Buy/Sell", overlay=true)
|
||
|
|
|
||
|
|
// Input settings for the EMAs
|
||
|
|
show_ema21_high = input(true, title="Show EMA 21 High")
|
||
|
|
ema21_high_color = input.color(color.black, title="Color for EMA 21 High")
|
||
|
|
ema21_high_length = input.int(21, title="Length for EMA 21 High")
|
||
|
|
|
||
|
|
show_ema21_close = input(true, title="Show EMA 21 Close")
|
||
|
|
ema21_close_color = input.color(color.orange, title="Color for EMA 21 Close")
|
||
|
|
ema21_close_length = input.int(21, title="Length for EMA 21 Close")
|
||
|
|
|
||
|
|
show_ema21_low = input(true, title="Show EMA 21 Low")
|
||
|
|
ema21_low_color = input.color(color.black, title="Color for EMA 21 Low")
|
||
|
|
ema21_low_length = input.int(21, title="Length for EMA 21 Low")
|
||
|
|
|
||
|
|
show_ema_ema21_close = input(true, title="Show EMA of EMA 21 Close")
|
||
|
|
ema_ema21_close_color = input.color(color.white, title="Color for EMA of EMA 21 Close")
|
||
|
|
ema_ema21_close_length = input.int(21, title="Length for EMA of EMA 21 Close")
|
||
|
|
|
||
|
|
// Input settings for buy/sell signals
|
||
|
|
show_buy_signal = input(true, title="Show Buy Signal")
|
||
|
|
buy_signal_color = input.color(color.green, title="Color for Buy Signal")
|
||
|
|
buy_signal_font_color = input.color(color.white, title="Font Color for Buy Signal")
|
||
|
|
show_sell_signal = input(true, title="Show Sell Signal")
|
||
|
|
sell_signal_color = input.color(color.red, title="Color for Sell Signal")
|
||
|
|
sell_signal_font_color = input.color(color.white, title="Font Color for Sell Signal")
|
||
|
|
|
||
|
|
// Calculating the EMAs
|
||
|
|
ema21_high = ta.ema(high, ema21_high_length)
|
||
|
|
ema21_close = ta.ema(close, ema21_close_length)
|
||
|
|
ema21_low = ta.ema(low, ema21_low_length)
|
||
|
|
ema_ema21_close = ta.ema(ema21_close, ema_ema21_close_length)
|
||
|
|
|
||
|
|
// Plotting the EMAs with conditional visibility
|
||
|
|
plot(show_ema21_high ? ema21_high : na, color=ema21_high_color, linewidth=1, title="EMA 21 High")
|
||
|
|
plot(show_ema21_close ? ema21_close : na, color=ema21_close_color, linewidth=1, title="EMA 21 Close")
|
||
|
|
plot(show_ema21_low ? ema21_low : na, color=ema21_low_color, linewidth=1, title="EMA 21 Low")
|
||
|
|
plot(show_ema_ema21_close ? ema_ema21_close : na, color=ema_ema21_close_color, linewidth=1, title="EMA of EMA 21 Close")
|
||
|
|
|
||
|
|
// Generating buy and sell signals based on the crossover of EMA 21 Close and EMA of EMA 21 Close
|
||
|
|
buySignal = ta.crossover(ema21_close, ema_ema21_close)
|
||
|
|
sellSignal = ta.crossunder(ema21_close, ema_ema21_close)
|
||
|
|
|
||
|
|
// Plot buy and sell signals on the chart if enabled
|
||
|
|
plotshape(series=buySignal and show_buy_signal ? buySignal : na, location=location.belowbar, color=buy_signal_color, textcolor=buy_signal_font_color, style=shape.labelup, text="Stop Sell", size=size.small)
|
||
|
|
plotshape(series=sellSignal and show_sell_signal ? sellSignal : na, location=location.abovebar, color=sell_signal_color, textcolor=sell_signal_font_color, style=shape.labeldown, text="Stop Buy", size=size.small)
|
||
|
|
|
||
|
|
// Trading strategy logic
|
||
|
|
if (buySignal)
|
||
|
|
strategy.entry("Buy", strategy.long)
|
||
|
|
|
||
|
|
if (sellSignal)
|
||
|
|
strategy.entry("Sell", strategy.short)
|
||
|
|
|
||
|
|
```
|
||
|
|
|
||
|
|
> Detail
|
||
|
|
|
||
|
|
https://www.fmz.com/strategy/458062
|
||
|
|
|
||
|
|
> Last Modified
|
||
|
|
|
||
|
|
2024-07-29 16:40:22
|