203 lines
7.4 KiB
Markdown
203 lines
7.4 KiB
Markdown

|
|
||
|
|
> Name
|
||
|
|
|
||
|
|
多重成交量动量组合交易策略-Multi-Volume-Momentum-Combined-Trading-Strategy
|
||
|
|
|
||
|
|
> Author
|
||
|
|
|
||
|
|
ChaoZhang
|
||
|
|
|
||
|
|
> Strategy Description
|
||
|
|
|
||
|
|
|
||
|
|
|
||
|
|
[trans]
|
||
|
|
#### 概述
|
||
|
|
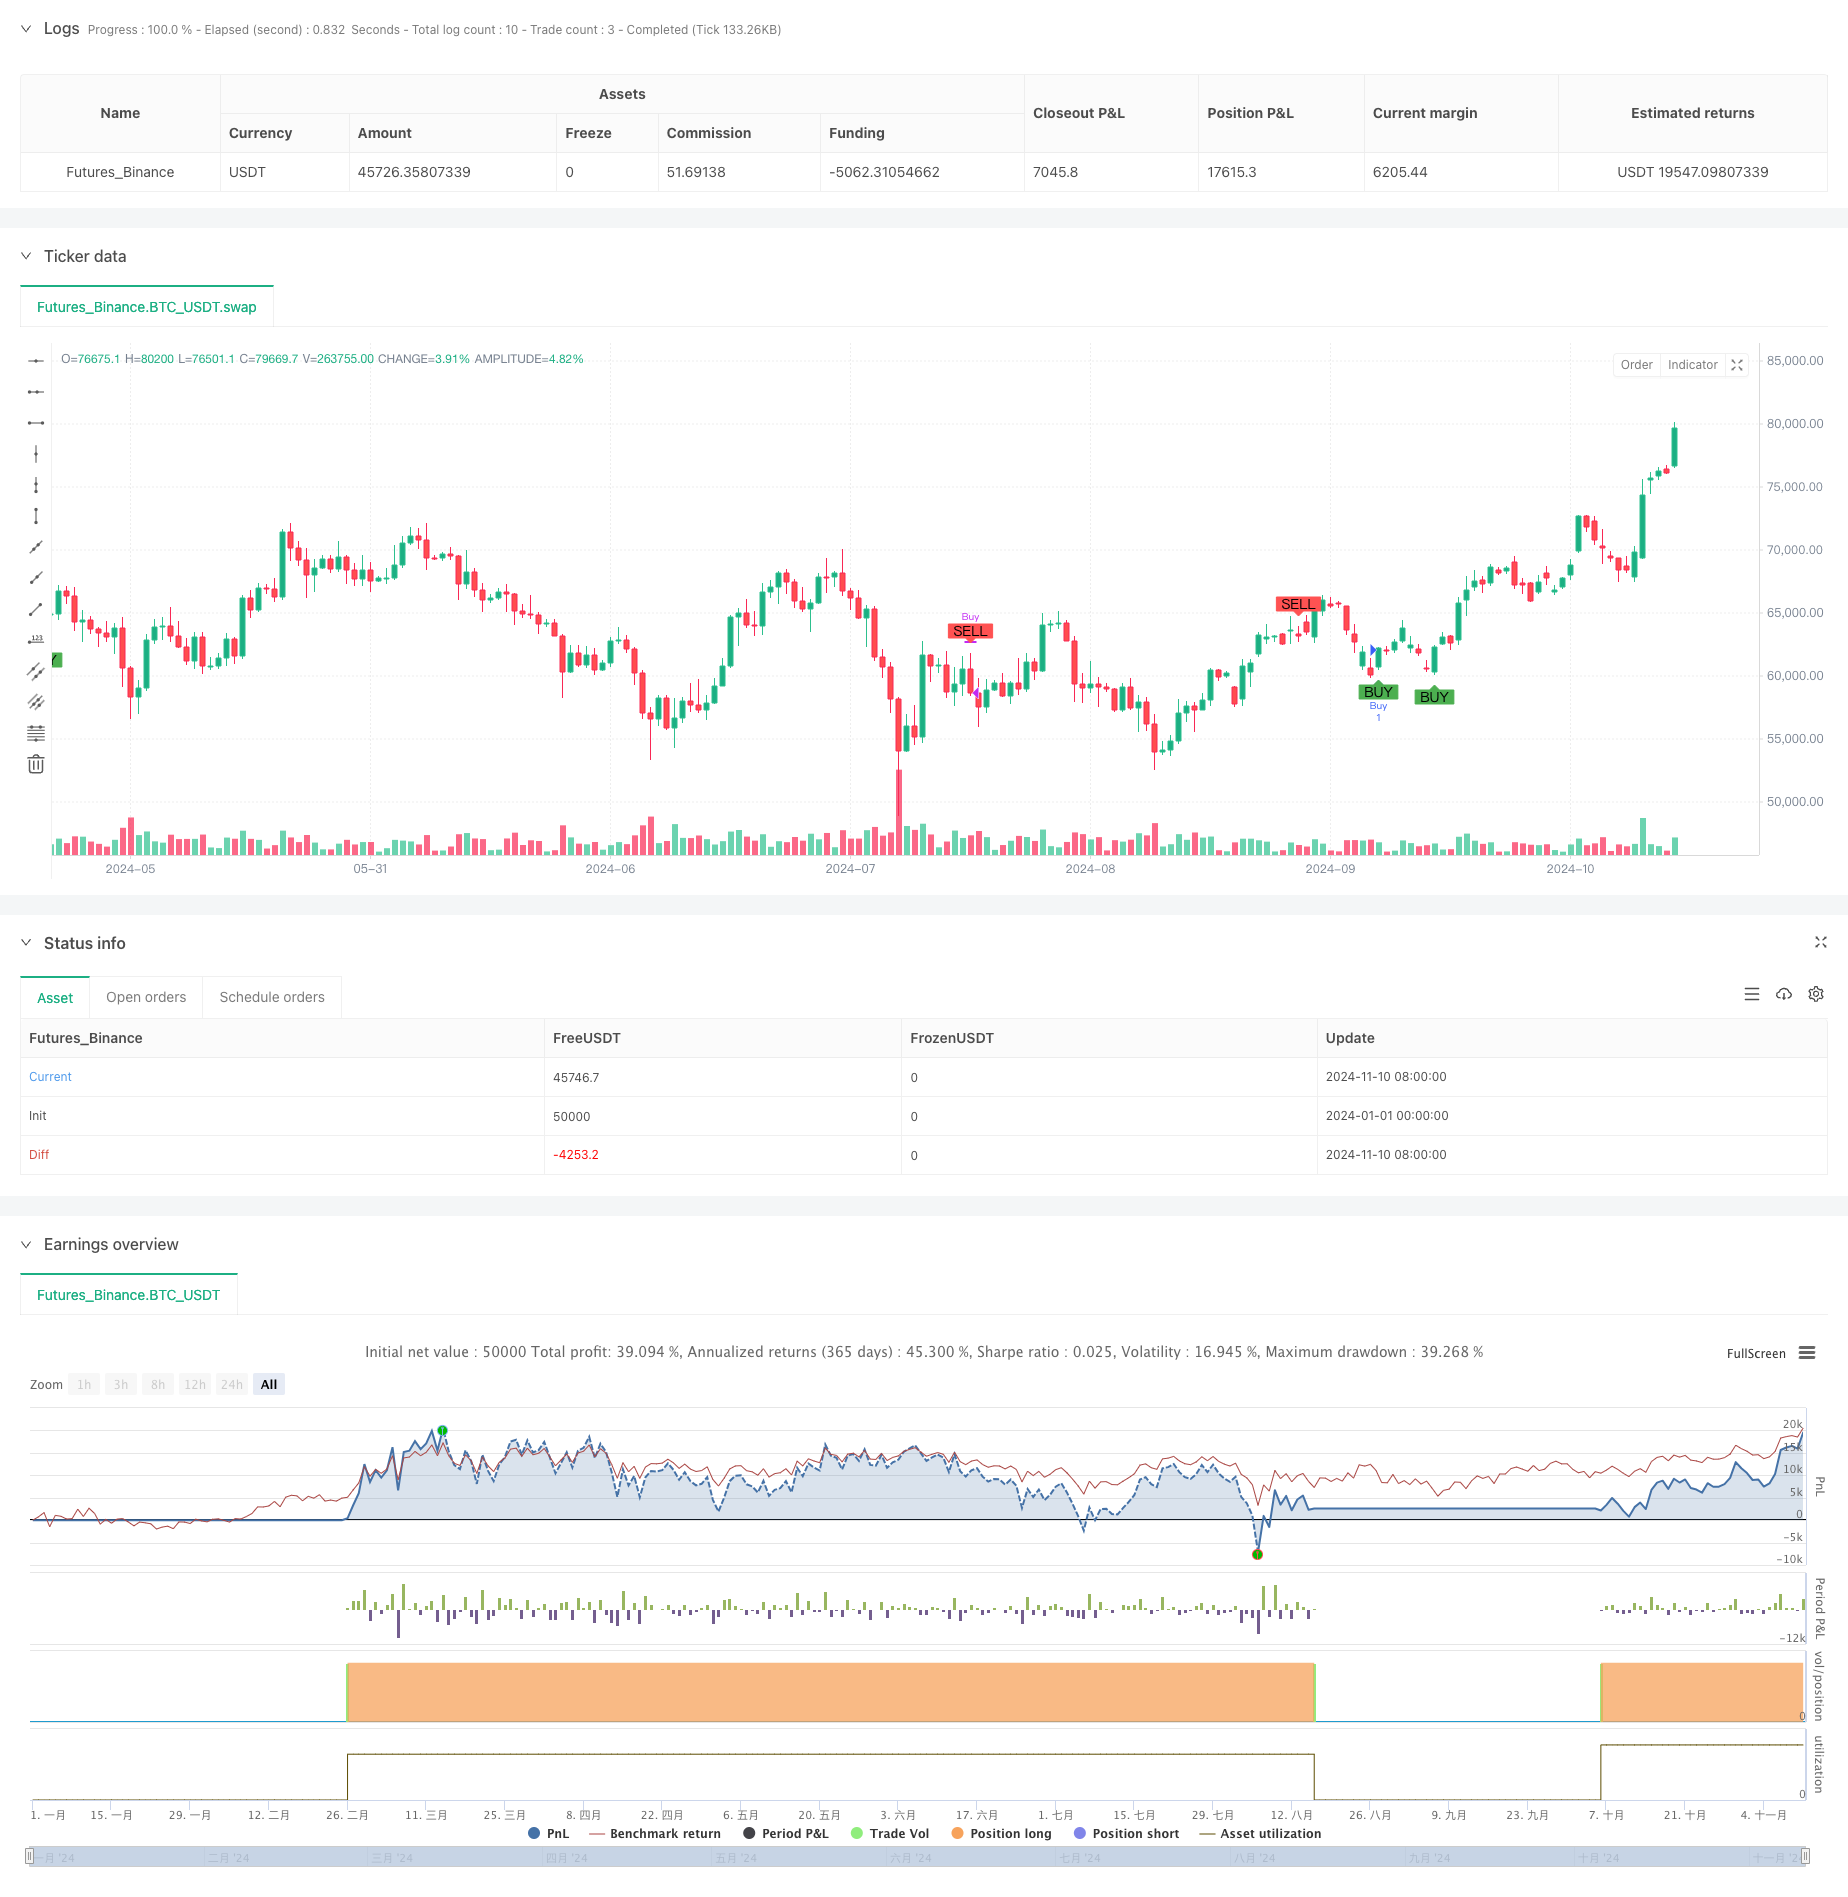
这是一个基于7个不同成交量指标的综合交易策略。该策略通过整合OBV、A/D线、CMF、MFI、VWAP、成交量振荡器和成交量RSI等多个成交量指标,构建了一个全面的交易系统。策略的核心是通过多个指标的信号确认来提高交易的准确性,当超过4个指标同时给出买入或卖出信号时才执行交易。
|
||
|
|
|
||
|
|
#### 策略原理
|
||
|
|
策略采用了多重指标验证的方法,包括:
|
||
|
|
1. OBV(能量潮指标)用于跟踪累计成交量变化
|
||
|
|
2. A/D线(聚散指标)反映价格和成交量的关系
|
||
|
|
3. CMF(蔡金货币流量)衡量资金流向
|
||
|
|
4. MFI(资金流量指标)测量买卖压力
|
||
|
|
5. VWAP(成交量加权平均价)作为动态支撑阻力
|
||
|
|
6. 成交量振荡器显示成交量趋势
|
||
|
|
7. VRSI(成交量相对强弱)反映成交量强度
|
||
|
|
|
||
|
|
当超过4个指标同时给出一致信号时,策略认为市场出现较强的趋势机会,从而进行交易。
|
||
|
|
|
||
|
|
#### 策略优势
|
||
|
|
1. 多重指标交叉验证,降低假信号风险
|
||
|
|
2. 采用成交量与价格相结合的分析方法
|
||
|
|
3. 包含了动量和趋势跟踪的双重特性
|
||
|
|
4. 设置了明确的入场和出场条件
|
||
|
|
5. 具有较强的适应性和可扩展性
|
||
|
|
|
||
|
|
#### 策略风险
|
||
|
|
1. 多个指标可能导致信号滞后
|
||
|
|
2. 在震荡市场中可能产生过多交易
|
||
|
|
3. 参数优化可能导致过度拟合
|
||
|
|
4. 需要较大的计算资源
|
||
|
|
5. 在低流动性市场中可能表现不佳
|
||
|
|
|
||
|
|
#### 策略优化方向
|
||
|
|
1. 引入自适应参数机制
|
||
|
|
2. 增加市场波动率过滤器
|
||
|
|
3. 优化指标权重分配
|
||
|
|
4. 添加止损和获利目标
|
||
|
|
5. 考虑引入时间过滤器
|
||
|
|
|
||
|
|
#### 总结
|
||
|
|
这是一个基于多重成交量指标的综合交易策略,通过多维度分析市场来提高交易的准确性。策略具有较强的理论基础和实践价值,但需要在实际应用中根据市场情况进行适当的参数优化和风险管理。
|
||
|
|
|
||
|
|
||
|
||
|
|
|
||
|
|
#### Overview
|
||
|
|
This is a comprehensive trading strategy based on 7 different volume indicators. The strategy integrates multiple volume indicators including OBV, A/D Line, CMF, MFI, VWAP, Volume Oscillator, and Volume RSI to build a comprehensive trading system. The core concept is to improve trading accuracy through multiple indicator confirmations, executing trades only when more than 4 indicators simultaneously give buy or sell signals.
|
||
|
|
|
||
|
|
#### Strategy Principles
|
||
|
|
The strategy employs multiple indicator verification methods, including:
|
||
|
|
1. OBV (On-Balance Volume) for tracking cumulative volume changes
|
||
|
|
2. A/D Line (Accumulation/Distribution) for price-volume relationships
|
||
|
|
3. CMF (Chaikin Money Flow) for measuring money flow
|
||
|
|
4. MFI (Money Flow Index) for buying/selling pressure
|
||
|
|
5. VWAP (Volume Weighted Average Price) as dynamic support/resistance
|
||
|
|
6. Volume Oscillator for volume trend
|
||
|
|
7. VRSI (Volume Relative Strength Index) for volume strength
|
||
|
|
|
||
|
|
The strategy executes trades when more than 4 indicators simultaneously give consistent signals, indicating strong trend opportunities.
|
||
|
|
|
||
|
|
#### Strategy Advantages
|
||
|
|
1. Multiple indicator cross-validation reduces false signals
|
||
|
|
2. Combines volume and price analysis methods
|
||
|
|
3. Incorporates both momentum and trend-following characteristics
|
||
|
|
4. Clear entry and exit conditions
|
||
|
|
5. Strong adaptability and scalability
|
||
|
|
|
||
|
|
#### Strategy Risks
|
||
|
|
1. Multiple indicators may lead to signal lag
|
||
|
|
2. May generate excessive trades in ranging markets
|
||
|
|
3. Parameter optimization risks overfitting
|
||
|
|
4. Requires significant computational resources
|
||
|
|
5. May underperform in low liquidity markets
|
||
|
|
|
||
|
|
#### Optimization Directions
|
||
|
|
1. Introduce adaptive parameter mechanisms
|
||
|
|
2. Add market volatility filters
|
||
|
|
3. Optimize indicator weight distribution
|
||
|
|
4. Add stop-loss and profit targets
|
||
|
|
5. Consider implementing time filters
|
||
|
|
|
||
|
|
#### Summary
|
||
|
|
This is a comprehensive trading strategy based on multiple volume indicators that improves trading accuracy through multi-dimensional market analysis. While the strategy has strong theoretical foundations and practical value, it requires appropriate parameter optimization and risk management in practical applications.
|
||
|
|
[/trans]
|
||
|
|
|
||
|
|
|
||
|
|
|
||
|
|
> Source (PineScript)
|
||
|
|
|
||
|
|
``` pinescript
|
||
|
|
/*backtest
|
||
|
|
start: 2024-01-01 00:00:00
|
||
|
|
end: 2024-11-11 00:00:00
|
||
|
|
period: 1d
|
||
|
|
basePeriod: 1d
|
||
|
|
exchanges: [{"eid":"Futures_Binance","currency":"BTC_USDT"}]
|
||
|
|
*/
|
||
|
|
|
||
|
|
//@version=5
|
||
|
|
strategy("Combined Volume Indicators Strategy", overlay=true)
|
||
|
|
|
||
|
|
// تنظیمات
|
||
|
|
lengthRSI = 14
|
||
|
|
lengthMFI = 14
|
||
|
|
lengthCMF = 20
|
||
|
|
fastLength = 5
|
||
|
|
slowLength = 10
|
||
|
|
|
||
|
|
// محاسبه OBV
|
||
|
|
obv = ta.cum(close > close[1] ? volume : close < close[1] ? -volume : 0)
|
||
|
|
|
||
|
|
// محاسبه A/D بهصورت دستی
|
||
|
|
var float ad = na
|
||
|
|
ad := na(ad[1]) ? 0 : ad[1] + ((close - low) - (high - close)) / (high - low) * volume
|
||
|
|
|
||
|
|
// محاسبه CMF (Chaikin Money Flow)
|
||
|
|
moneyFlowMultiplier = ((close - low) - (high - close)) / (high - low)
|
||
|
|
moneyFlowVolume = moneyFlowMultiplier * volume
|
||
|
|
cmf = ta.sma(moneyFlowVolume, lengthCMF) / ta.sma(volume, lengthCMF)
|
||
|
|
|
||
|
|
// محاسبه MFI بهصورت دستی
|
||
|
|
typicalPrice = (high + low + close) / 3
|
||
|
|
moneyFlow = typicalPrice * volume
|
||
|
|
|
||
|
|
// محاسبه جریان پول مثبت و منفی
|
||
|
|
positiveFlow = 0.0
|
||
|
|
negativeFlow = 0.0
|
||
|
|
|
||
|
|
for i = 0 to lengthMFI - 1
|
||
|
|
positiveFlow := positiveFlow + (close[i] > close[i + 1] ? moneyFlow[i] : 0)
|
||
|
|
negativeFlow := negativeFlow + (close[i] < close[i + 1] ? moneyFlow[i] : 0)
|
||
|
|
|
||
|
|
mfi = 100 - (100 / (1 + (positiveFlow / negativeFlow)))
|
||
|
|
|
||
|
|
// محاسبه VWAP
|
||
|
|
vwap = ta.vwap(close)
|
||
|
|
|
||
|
|
// محاسبه Volume Oscillator
|
||
|
|
fastVolMA = ta.sma(volume, fastLength)
|
||
|
|
slowVolMA = ta.sma(volume, slowLength)
|
||
|
|
volumeOscillator = fastVolMA - slowVolMA
|
||
|
|
|
||
|
|
// محاسبه VRSI (Volume RSI)
|
||
|
|
vrsi = ta.rsi(volume, lengthRSI)
|
||
|
|
|
||
|
|
// شمارش اندیکاتورهای سیگنال خرید
|
||
|
|
buySignals = 0
|
||
|
|
buySignals := buySignals + (obv > obv[1] ? 1 : 0)
|
||
|
|
buySignals := buySignals + (ad > ad[1] ? 1 : 0)
|
||
|
|
buySignals := buySignals + (cmf > 0 ? 1 : 0)
|
||
|
|
buySignals := buySignals + (mfi < 40 ? 1 : 0)
|
||
|
|
buySignals := buySignals + (close < vwap ? 1 : 0)
|
||
|
|
buySignals := buySignals + (volumeOscillator > 0 ? 1 : 0)
|
||
|
|
buySignals := buySignals + (vrsi < 40 ? 1 : 0)
|
||
|
|
|
||
|
|
// شمارش اندیکاتورهای سیگنال فروش
|
||
|
|
sellSignals = 0
|
||
|
|
sellSignals := sellSignals + (obv < obv[1] ? 1 : 0)
|
||
|
|
sellSignals := sellSignals + (ad < ad[1] ? 1 : 0)
|
||
|
|
sellSignals := sellSignals + (cmf < 0 ? 1 : 0)
|
||
|
|
sellSignals := sellSignals + (mfi > 60 ? 1 : 0)
|
||
|
|
sellSignals := sellSignals + (close > vwap ? 1 : 0)
|
||
|
|
sellSignals := sellSignals + (volumeOscillator < 0 ? 1 : 0)
|
||
|
|
sellSignals := sellSignals + (vrsi > 60 ? 1 : 0)
|
||
|
|
|
||
|
|
// شرایط سیگنال خرید: اگر بیش از 4 اندیکاتور سیگنال خرید دهند
|
||
|
|
buyCondition = (buySignals > 4)
|
||
|
|
|
||
|
|
// شرایط سیگنال فروش: اگر بیش از 4 اندیکاتور سیگنال فروش دهند
|
||
|
|
sellCondition = (sellSignals > 4)
|
||
|
|
|
||
|
|
// ورود به معامله خرید
|
||
|
|
if (buyCondition)
|
||
|
|
strategy.entry("Buy", strategy.long)
|
||
|
|
|
||
|
|
// خروج از معامله فروش
|
||
|
|
if (sellCondition)
|
||
|
|
strategy.close("Buy")
|
||
|
|
|
||
|
|
// رسم سیگنالهای خرید و فروش بر روی چارت
|
||
|
|
plotshape(buyCondition, title="Buy Signal", location=location.belowbar, color=color.green, style=shape.labelup, text="BUY")
|
||
|
|
plotshape(sellCondition, title="Sell Signal", location=location.abovebar, color=color.red, style=shape.labeldown, text="SELL")
|
||
|
|
|
||
|
|
```
|
||
|
|
|
||
|
|
> Detail
|
||
|
|
|
||
|
|
https://www.fmz.com/strategy/471663
|
||
|
|
|
||
|
|
> Last Modified
|
||
|
|
|
||
|
|
2024-11-12 10:52:54
|