188 lines
8.4 KiB
Markdown
188 lines
8.4 KiB
Markdown

|
|
|||
|
|
> Name
|
|||
|
|
|
|||
|
|
多重均线交易系统结合动量与成交量确认的量化趋势策略-Multi-Moving-Average-Trading-System-with-Momentum-and-Volume-Confirmation-Quantitative-Trend-Strategy
|
|||
|
|
|
|||
|
|
> Author
|
|||
|
|
|
|||
|
|
ChaoZhang
|
|||
|
|
|
|||
|
|
> Strategy Description
|
|||
|
|
|
|||
|
|
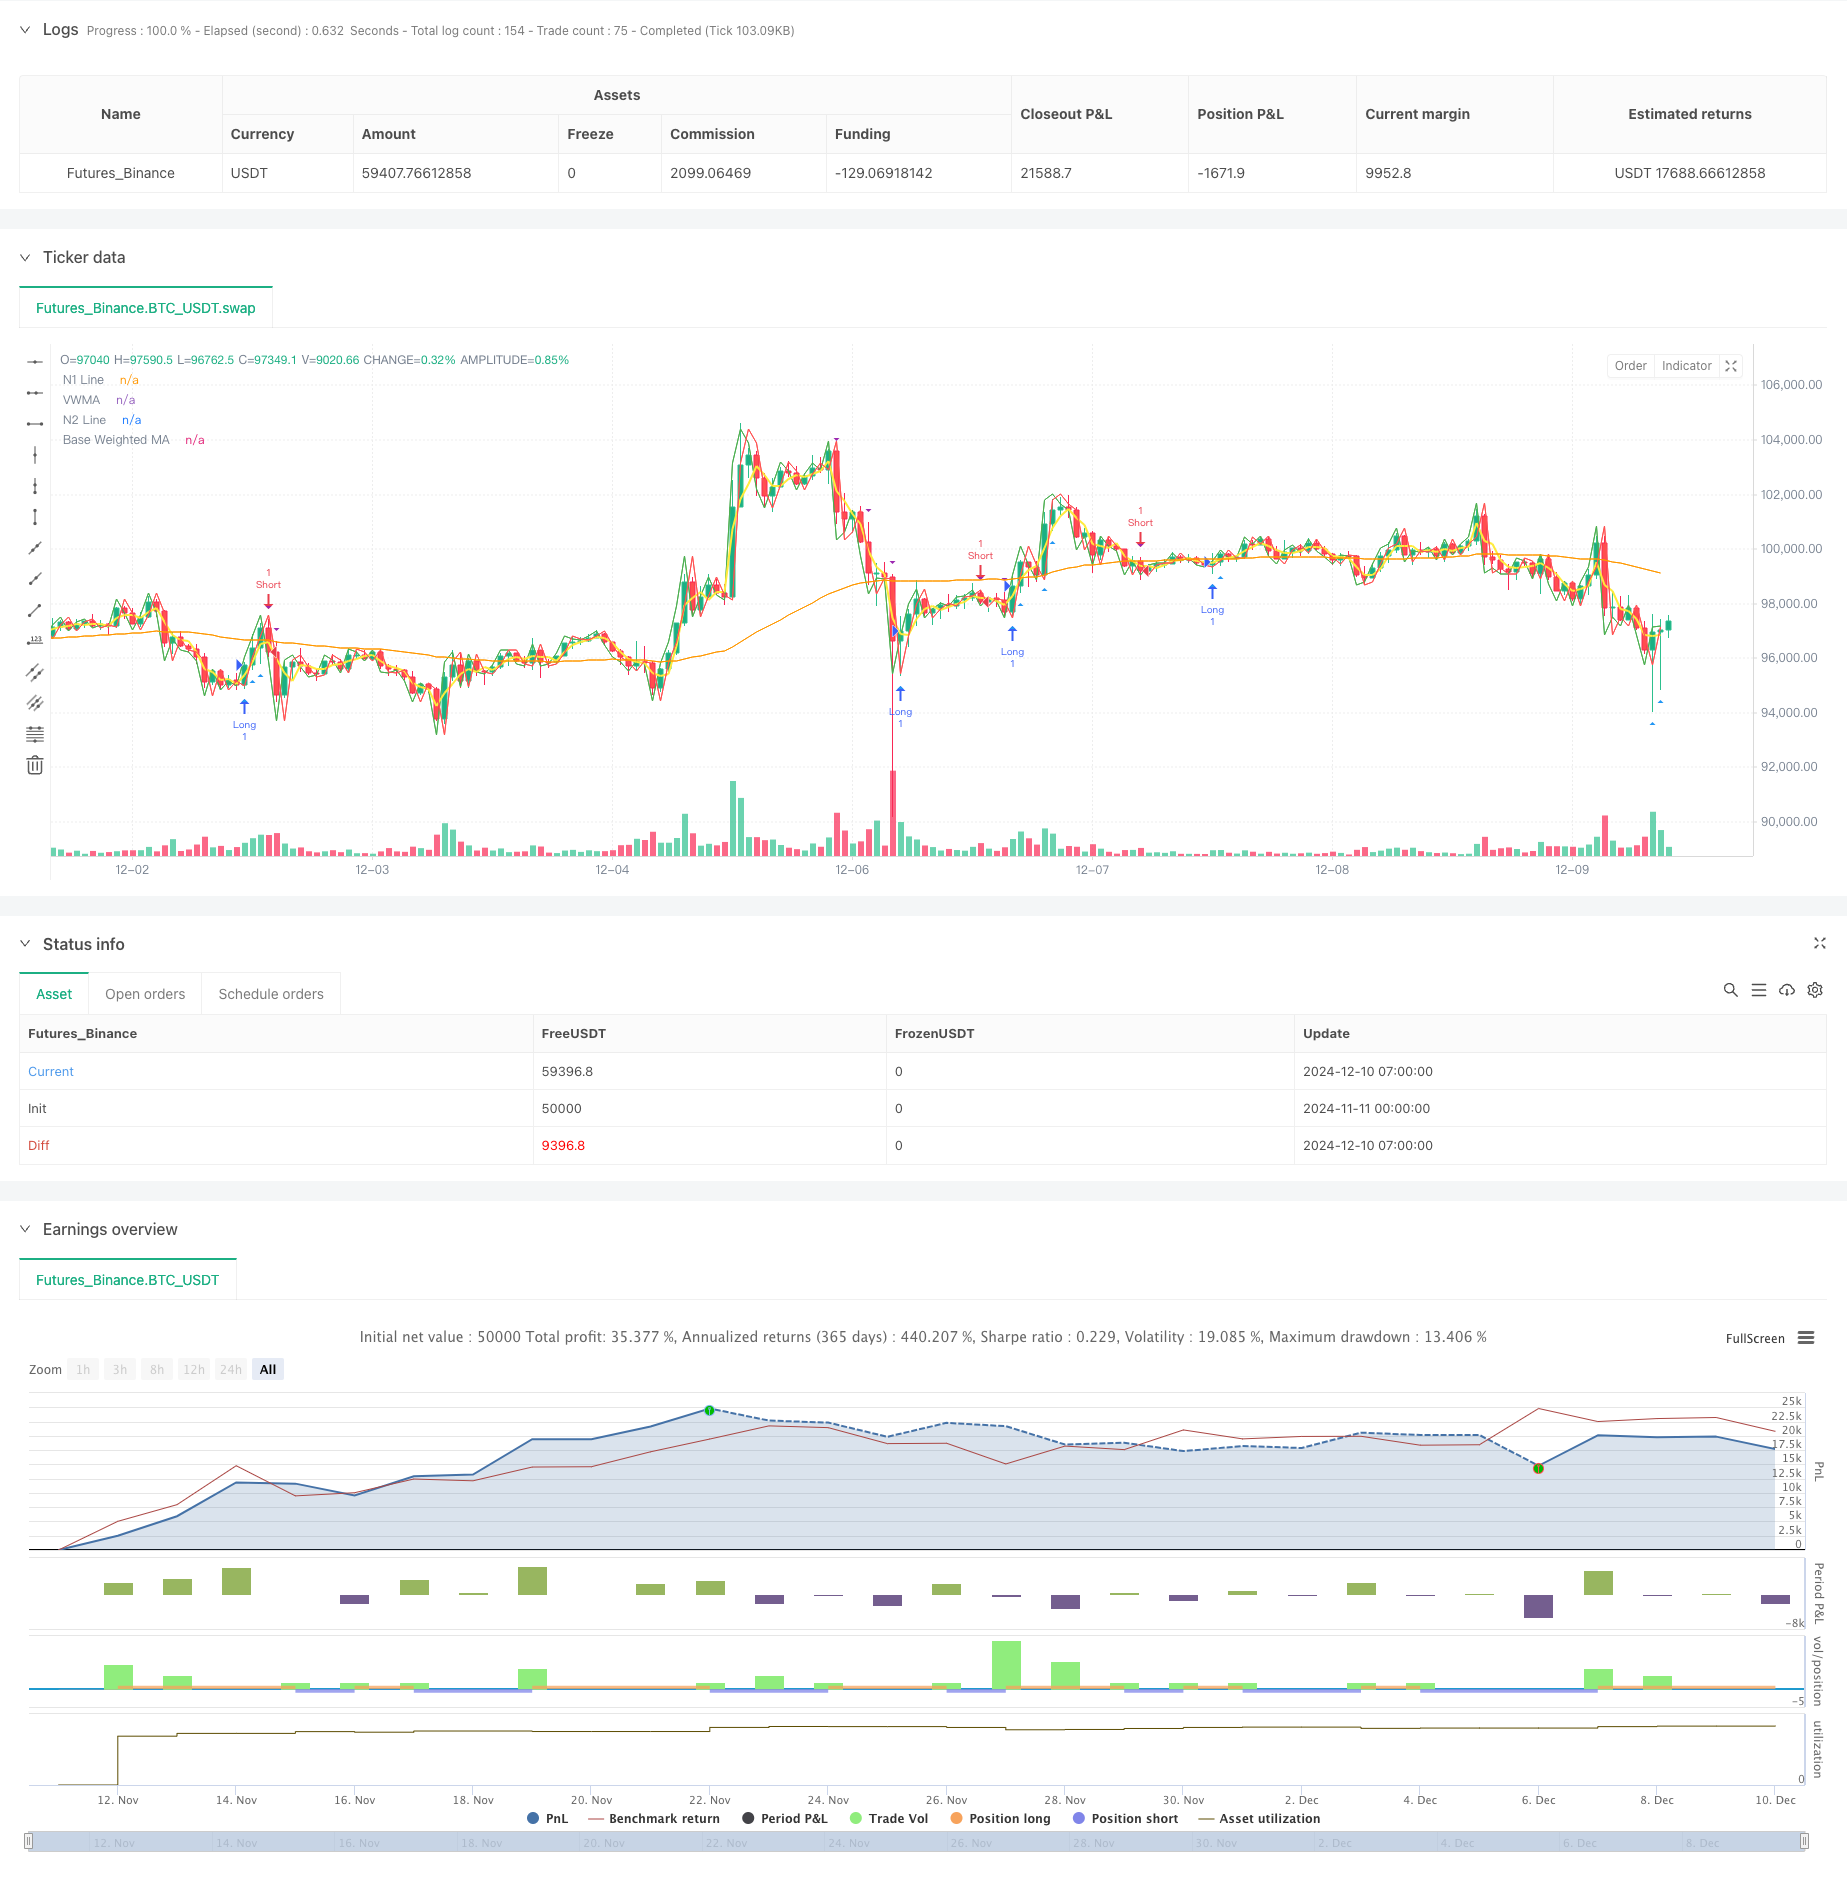
|
|||
|
|
|
|||
|
|
[trans]
|
|||
|
|
#### 概述
|
|||
|
|
该策略是一个结合了多重均线、相对强弱指标(RSI)、平均趋向指标(ADX)和成交量分析的综合量化交易系统。策略通过多重技术指标的协同配合,在趋势确认的基础上进行交易,通过成交量和动量指标的过滤来提高交易的可靠性。
|
|||
|
|
|
|||
|
|
#### 策略原理
|
|||
|
|
策略的核心逻辑基于以下几个关键组件:
|
|||
|
|
1. 使用双重赫尔均线(Double HullMA)、成交量加权移动平均线(VWMA)和基础加权移动平均线(WMA)构建多重均线系统
|
|||
|
|
2. 通过ADX指标判断趋势强度,只在趋势明显时进行交易
|
|||
|
|
3. 利用RSI指标过滤极端市场状态,避免在过度买入或卖出区域交易
|
|||
|
|
4. 结合成交量分析,要求交易信号出现时成交量高于一定阈值
|
|||
|
|
5. 通过n1和n2线的交叉来确定具体的交易方向
|
|||
|
|
|
|||
|
|
多重均线系统提供了价格趋势的基准判断,ADX确保只在趋势足够强时交易,RSI帮助避免追涨杀跌,而成交量分析则确保交易发生在市场活跃度较高的时期。
|
|||
|
|
|
|||
|
|
#### 策略优势
|
|||
|
|
1. 多重确认机制降低了假突破的风险
|
|||
|
|
2. 结合技术指标和成交量分析提高了交易的可靠性
|
|||
|
|
3. 通过RSI过滤极端市场状态,避免在不利时机入场
|
|||
|
|
4. ADX的使用确保只在趋势明显时交易,提高胜率
|
|||
|
|
5. 成交量要求帮助确认市场共识
|
|||
|
|
6. 策略逻辑清晰,参数可调整性强
|
|||
|
|
|
|||
|
|
#### 策略风险
|
|||
|
|
1. 多重过滤条件可能导致错过部分交易机会
|
|||
|
|
2. 在震荡市场中可能表现不佳
|
|||
|
|
3. 参数优化可能导致过度拟合
|
|||
|
|
4. 均线系统在快速反转行情中可能反应滞后
|
|||
|
|
5. 成交量过滤可能在低流动性市场中限制交易机会
|
|||
|
|
|
|||
|
|
建议通过以下方式管理风险:
|
|||
|
|
- 根据不同市场特点调整参数
|
|||
|
|
- 设置适当的止损止盈
|
|||
|
|
- 控制每次交易的资金比例
|
|||
|
|
- 定期回测验证策略有效性
|
|||
|
|
|
|||
|
|
#### 策略优化方向
|
|||
|
|
1. 引入自适应参数机制,根据市场状态动态调整
|
|||
|
|
2. 增加市场波动率过滤器,在高波动期间调整仓位
|
|||
|
|
3. 完善出场机制,可考虑加入追踪止损
|
|||
|
|
4. 优化成交量过滤器,考虑相对成交量而非绝对值
|
|||
|
|
5. 加入时间过滤,避开重要消息发布期
|
|||
|
|
6. 考虑加入价格波动率指标,提高对市场风险的识别能力
|
|||
|
|
|
|||
|
|
#### 总结
|
|||
|
|
该策略通过多重技术指标的协同配合,构建了一个相对完善的趋势跟踪系统。策略的主要特点是通过多重确认来提高交易的可靠性,同时通过各种过滤器来控制风险。虽然可能会错过一些交易机会,但总体上有助于提高交易的稳定性。通过建议的优化方向,策略还有进一步提升的空间。 ||
|
|||
|
|
|
|||
|
|
#### Overview
|
|||
|
|
This strategy is a comprehensive quantitative trading system that combines multiple moving averages, Relative Strength Index (RSI), Average Directional Index (ADX), and volume analysis. The strategy executes trades based on trend confirmation through multiple technical indicators, using volume and momentum filters to enhance trading reliability.
|
|||
|
|
|
|||
|
|
#### Strategy Principles
|
|||
|
|
The core logic is based on several key components:
|
|||
|
|
1. Multiple moving average system using Double HullMA, Volume-Weighted Moving Average (VWMA), and Basic Weighted Moving Average (WMA)
|
|||
|
|
2. Trend strength assessment using ADX indicator, trading only in strong trends
|
|||
|
|
3. RSI filtering to avoid extreme market conditions
|
|||
|
|
4. Volume analysis requiring above-threshold volume for trade signals
|
|||
|
|
5. Trade direction determination through n1 and n2 line crossovers
|
|||
|
|
|
|||
|
|
The multiple moving average system provides basic trend judgment, ADX ensures trading only in strong trends, RSI helps avoid chasing extremes, and volume analysis ensures trading during periods of high market activity.
|
|||
|
|
|
|||
|
|
#### Strategy Advantages
|
|||
|
|
1. Multiple confirmation mechanisms reduce false breakout risks
|
|||
|
|
2. Integration of technical indicators and volume analysis improves trading reliability
|
|||
|
|
3. RSI filtering avoids entering during unfavorable market conditions
|
|||
|
|
4. ADX usage ensures trading only in clear trends, improving win rate
|
|||
|
|
5. Volume requirements help confirm market consensus
|
|||
|
|
6. Clear strategy logic with adjustable parameters
|
|||
|
|
|
|||
|
|
#### Strategy Risks
|
|||
|
|
1. Multiple filters may cause missed trading opportunities
|
|||
|
|
2. May underperform in ranging markets
|
|||
|
|
3. Parameter optimization risks overfitting
|
|||
|
|
4. Moving average system may lag in quick reversals
|
|||
|
|
5. Volume filtering may limit opportunities in low liquidity markets
|
|||
|
|
|
|||
|
|
Risk management recommendations:
|
|||
|
|
- Adjust parameters based on market characteristics
|
|||
|
|
- Set appropriate stop-loss and take-profit levels
|
|||
|
|
- Control position sizing
|
|||
|
|
- Regular strategy backtesting
|
|||
|
|
|
|||
|
|
#### Strategy Optimization
|
|||
|
|
1. Introduce adaptive parameters based on market conditions
|
|||
|
|
2. Add volatility filters to adjust positions in high volatility periods
|
|||
|
|
3. Improve exit mechanisms with trailing stops
|
|||
|
|
4. Optimize volume filters using relative rather than absolute values
|
|||
|
|
5. Add time filters to avoid major news releases
|
|||
|
|
6. Consider adding price volatility indicators for better risk assessment
|
|||
|
|
|
|||
|
|
#### Summary
|
|||
|
|
The strategy builds a relatively complete trend following system through multiple technical indicators working in concert. Its main feature is using multiple confirmations to improve trading reliability while controlling risk through various filters. While it may miss some opportunities, it generally helps improve trading stability. The suggested optimization directions provide room for further strategy enhancement.[/trans]
|
|||
|
|
|
|||
|
|
|
|||
|
|
|
|||
|
|
> Source (PineScript)
|
|||
|
|
|
|||
|
|
``` pinescript
|
|||
|
|
/*backtest
|
|||
|
|
start: 2024-11-11 00:00:00
|
|||
|
|
end: 2024-12-10 08:00:00
|
|||
|
|
period: 1h
|
|||
|
|
basePeriod: 1h
|
|||
|
|
exchanges: [{"eid":"Futures_Binance","currency":"BTC_USDT"}]
|
|||
|
|
*/
|
|||
|
|
|
|||
|
|
//@version=5
|
|||
|
|
strategy("Optimized Multi-MA Strategy with Volume, ADX and RSI", overlay=true)
|
|||
|
|
|
|||
|
|
// Kullanıcı Parametreleri
|
|||
|
|
keh = input.int(3, title="Double HullMA", minval=1)
|
|||
|
|
teh = input.int(3, title="Volume-Weighted MA", minval=1)
|
|||
|
|
yeh = input.int(75, title="Base Weighted MA", minval=1)
|
|||
|
|
rsiPeriod = input.int(14, title="RSI Period", minval=1)
|
|||
|
|
adxPeriod = input.int(14, title="ADX Period", minval=1)
|
|||
|
|
volumeLookback = input.int(10, title="Volume Lookback Period", minval=1) // Son X mumun hacmi
|
|||
|
|
adxThreshold = input.int(20, title="ADX Trend Strength Threshold", minval=1) // ADX için trend gücü eşiği
|
|||
|
|
|
|||
|
|
// Hareketli Ortalamalar
|
|||
|
|
rvwma = ta.vwma(close, teh)
|
|||
|
|
yma = ta.wma(close, yeh)
|
|||
|
|
n2ma = 2 * ta.wma(close, math.round(keh / 2))
|
|||
|
|
nma = ta.wma(close, keh)
|
|||
|
|
diff = n2ma - nma
|
|||
|
|
sqrtKeh = math.round(math.sqrt(keh))
|
|||
|
|
n1 = ta.wma(diff, sqrtKeh)
|
|||
|
|
n2 = ta.wma(diff[1], sqrtKeh)
|
|||
|
|
|
|||
|
|
// ADX Hesaplaması
|
|||
|
|
trueRange = ta.rma(ta.tr, adxPeriod)
|
|||
|
|
plusDM = ta.rma(math.max(high - high[1], 0), adxPeriod)
|
|||
|
|
minusDM = ta.rma(math.max(low[1] - low, 0), adxPeriod)
|
|||
|
|
plusDI = (plusDM / trueRange) * 100
|
|||
|
|
minusDI = (minusDM / trueRange) * 100
|
|||
|
|
dx = math.abs(plusDI - minusDI) / (plusDI + minusDI) * 100
|
|||
|
|
adx = ta.rma(dx, adxPeriod)
|
|||
|
|
trendIsStrong = adx > adxThreshold
|
|||
|
|
|
|||
|
|
// RSI Filtreleme
|
|||
|
|
rsiValue = ta.rsi(close, rsiPeriod)
|
|||
|
|
rsiFilter = rsiValue > 30 and rsiValue < 70 // Aşırı alım ve aşırı satım bölgelerinin dışında olmak
|
|||
|
|
|
|||
|
|
// Hacim Filtresi
|
|||
|
|
volumeThreshold = ta.sma(volume, volumeLookback) // Ortalama hacim seviyesi
|
|||
|
|
highVolume = volume > volumeThreshold
|
|||
|
|
|
|||
|
|
// Sinyal Şartları (Sadece güçlü trendler ve rsi'nın aşırı bölgelerde olmaması)
|
|||
|
|
longCondition = n1 > n2 and close > rvwma and trendIsStrong and rsiFilter and highVolume
|
|||
|
|
shortCondition = n1 < n2 and close < rvwma and trendIsStrong and rsiFilter and highVolume
|
|||
|
|
|
|||
|
|
// Hacim Filtresi ile İşaretler
|
|||
|
|
plotshape(series=longCondition and highVolume ? close : na, style=shape.triangleup, location=location.belowbar, color=color.blue, size=size.small, title="High Volume Long Signal")
|
|||
|
|
plotshape(series=shortCondition and highVolume ? close : na, style=shape.triangledown, location=location.abovebar, color=color.purple, size=size.small, title="High Volume Short Signal")
|
|||
|
|
|
|||
|
|
// Strateji Giriş ve Çıkış Şartları
|
|||
|
|
if (longCondition)
|
|||
|
|
strategy.entry("Long", strategy.long)
|
|||
|
|
|
|||
|
|
if (shortCondition)
|
|||
|
|
strategy.entry("Short", strategy.short)
|
|||
|
|
|
|||
|
|
// Görsel Göstergeler
|
|||
|
|
plot(n1, color=color.green, title="N1 Line")
|
|||
|
|
plot(n2, color=color.red, title="N2 Line")
|
|||
|
|
plot(rvwma, color=color.yellow, linewidth=2, title="VWMA")
|
|||
|
|
plot(yma, color=color.orange, title="Base Weighted MA")
|
|||
|
|
|
|||
|
|
```
|
|||
|
|
|
|||
|
|
> Detail
|
|||
|
|
|
|||
|
|
https://www.fmz.com/strategy/474836
|
|||
|
|
|
|||
|
|
> Last Modified
|
|||
|
|
|
|||
|
|
2024-12-12 14:27:59
|