148 lines
11 KiB
Markdown
148 lines
11 KiB
Markdown

|
|
||
|
|
> Name
|
||
|
|
|
||
|
|
多时间框架比特币币安币和以太坊交易回撤策略-Multi-Timeframe-Bitcoin-Binance-Coin-and-Ethereum-Pullback-Trading-Strategy
|
||
|
|
|
||
|
|
> Author
|
||
|
|
|
||
|
|
ChaoZhang
|
||
|
|
|
||
|
|
> Strategy Description
|
||
|
|
|
||
|
|
|
||
|
|
|
||
|
|
[trans]
|
||
|
|
#### 概述
|
||
|
|
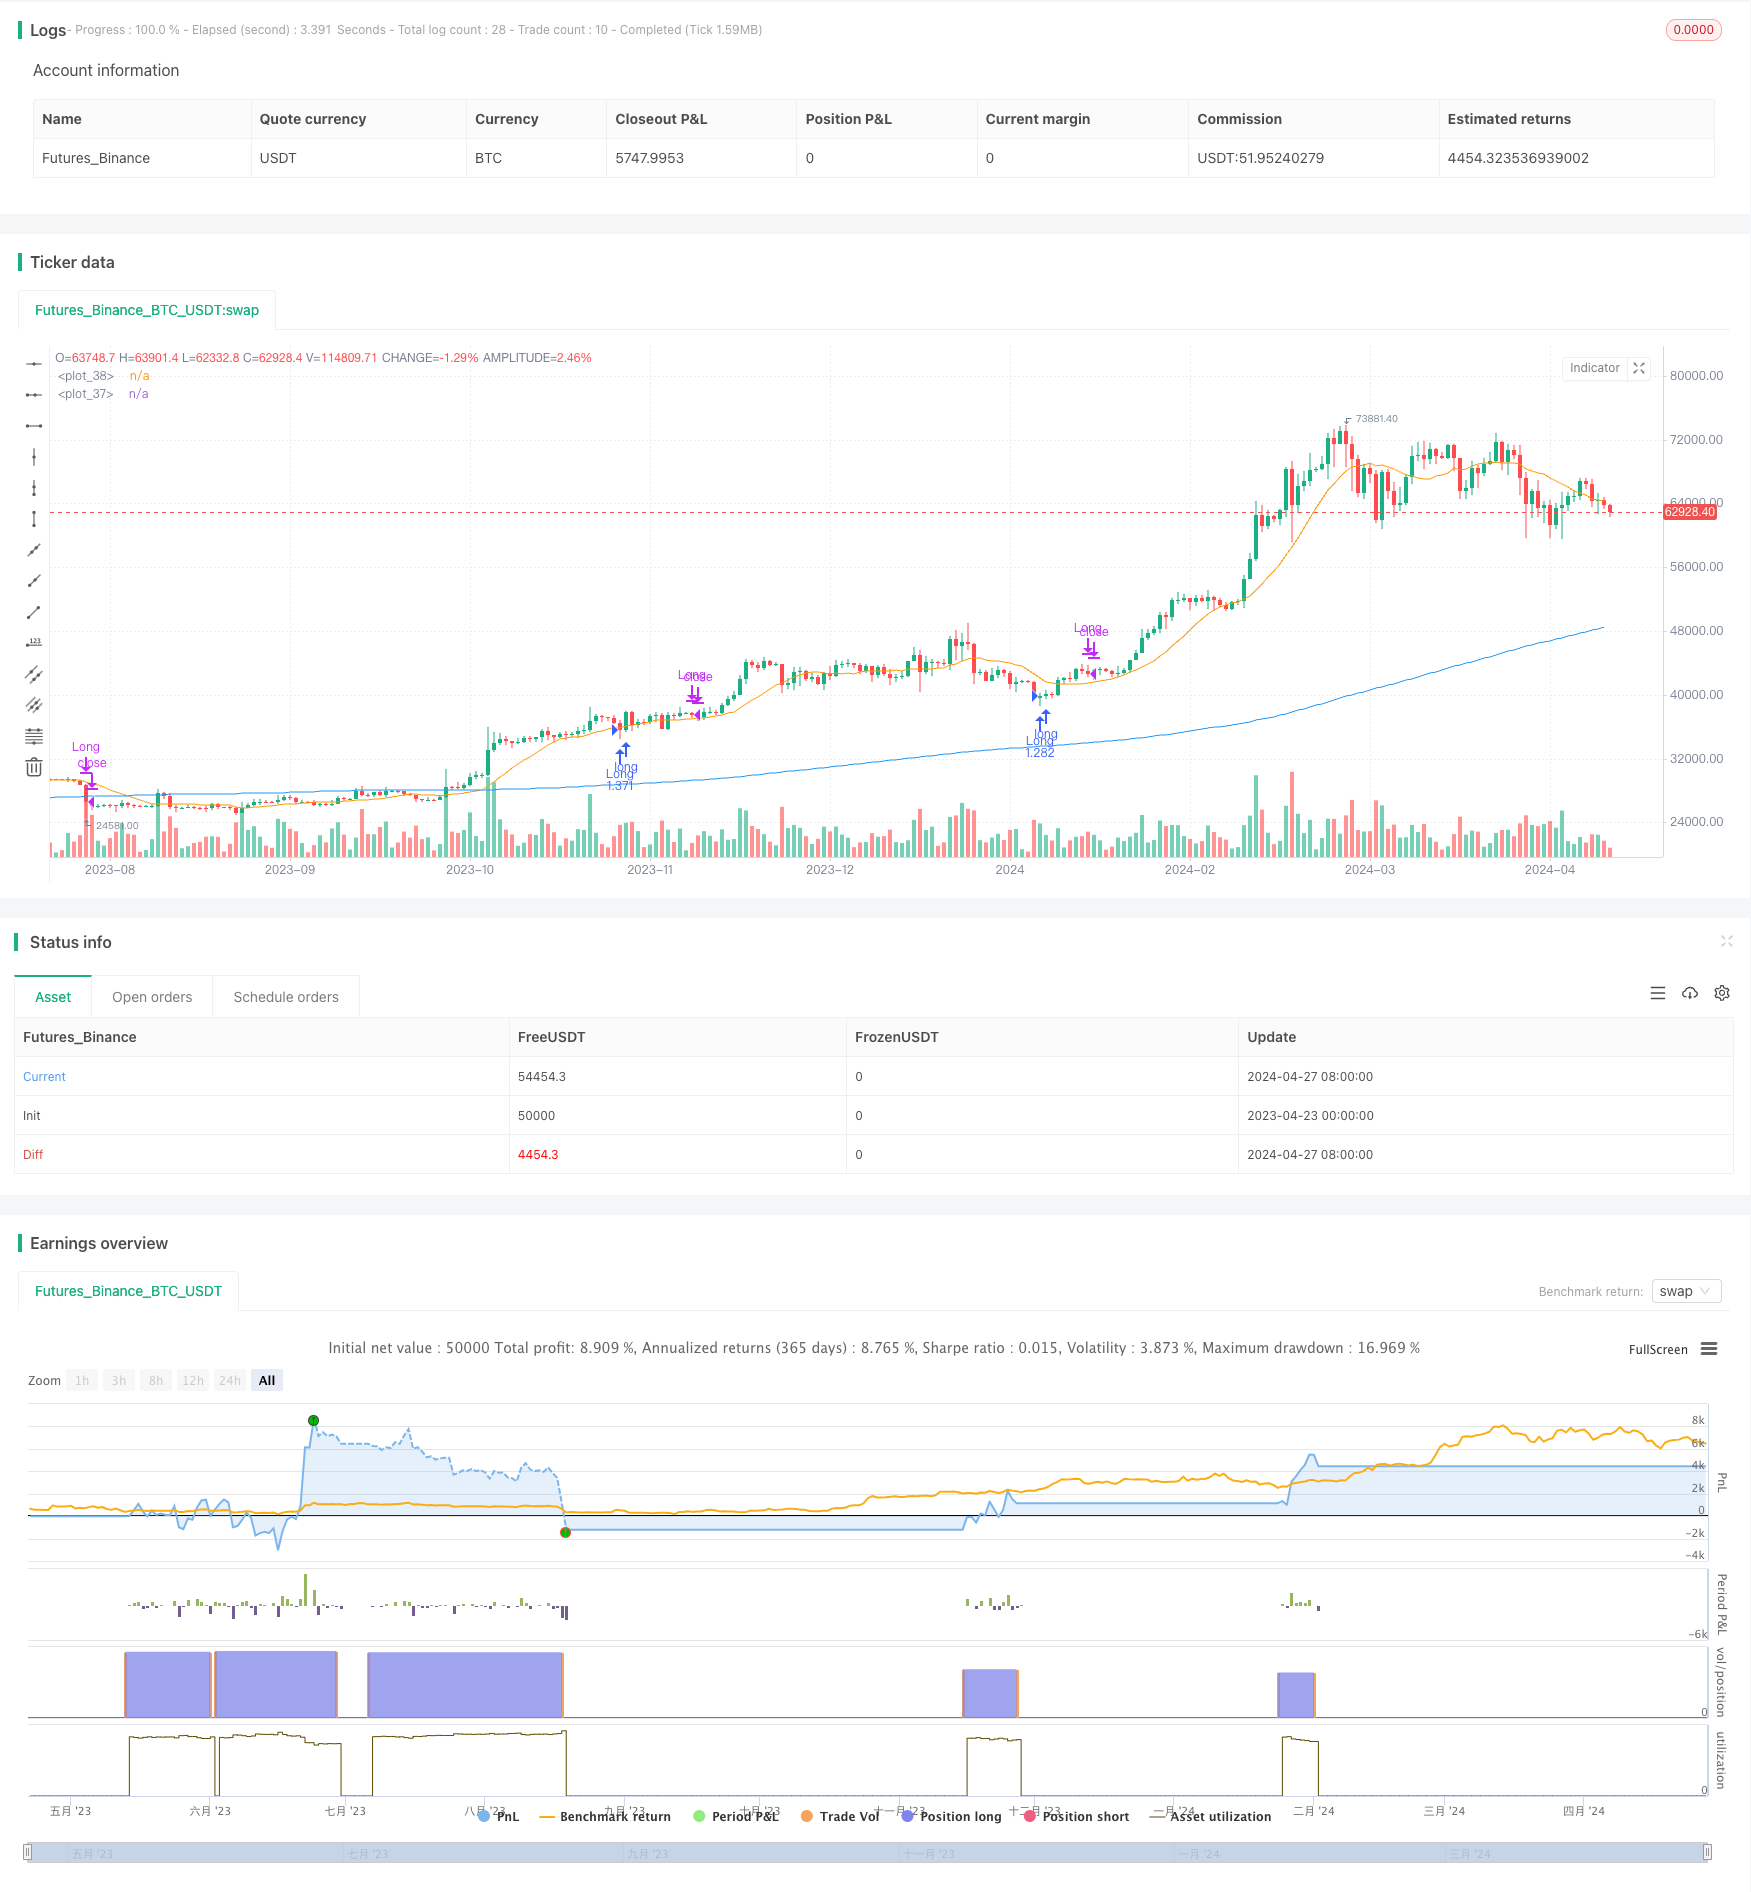
该策略专注于1小时、2小时、3小时和4小时时间框架下的比特币(BTC)、币安币(BNB)和以太坊(ETH)。它旨在利用短期价格回撤,在更广泛的趋势中获利。通过识别趋势中的回撤,并使用烛台模式和超卖条件等确认信号,交易者可以在定义的风险和利润目标下进入头寸。有效的风险管理,包括止损单和头寸规模,是至关重要的。该策略提供了一种结构化的方法来交易回撤,同时管理下行风险。
|
||
|
|
|
||
|
|
#### 策略原理
|
||
|
|
该策略使用两个简单移动平均线(SMA)来捕捉市场趋势和潜在的回撤机会。较长周期的SMA(ma1)作为趋势确认指标,而较短周期的SMA(ma2)用于识别价格偏离主要趋势的情况。当价格高于ma1时,表明上升趋势,策略寻找价格低于ma2的回撤作为潜在的买入机会。同时,该策略采用"Too Deep"和"Too Thin"参数来过滤回撤,以避免进入过深或过浅的回撤。一旦确认买入信号,该策略会以市价执行买入订单。平仓条件包括价格突破ma2上方或触发预设的止损水平。该策略利用趋势跟踪和回撤交易的原理,力求在趋势中抓住短期回调的机会。
|
||
|
|
|
||
|
|
#### 策略优势
|
||
|
|
1. 多时间框架分析:该策略在1小时、2小时、3小时和4小时时间框架下运行,提供了更全面的市场视角和潜在的交易机会。
|
||
|
|
2. 趋势跟踪:通过使用较长周期的SMA作为趋势确认指标,该策略能够适应不同的市场趋势,并在趋势中寻找入场机会。
|
||
|
|
3. 回撤交易:该策略专注于在上升趋势中寻找价格回撤,以更好的价格进场,同时降低了逆势交易的风险。
|
||
|
|
4. 风险管理:该策略纳入了止损机制和头寸规模控制,以限制潜在的下行风险并保护交易资金。
|
||
|
|
5. 参数优化:策略参数如移动平均线长度、止损百分比等可以根据市场状况和个人偏好进行优化,提供灵活性。
|
||
|
|
|
||
|
|
#### 策略风险
|
||
|
|
1. 参数敏感性:该策略的表现在一定程度上取决于所选参数,如移动平均线长度和回撤过滤器。参数的选择需要仔细的回测和优化。
|
||
|
|
2. 市场噪音:短期价格波动可能导致虚假信号,从而进行不必要的交易并增加成本。
|
||
|
|
3. 趋势反转:当市场趋势突然反转时,该策略可能面临潜在的损失,尤其是在止损位置被触发之前。
|
||
|
|
4. 滑点和交易成本:频繁的交易可能导致较高的滑点和交易成本,影响策略的整体表现。
|
||
|
|
|
||
|
|
#### 策略优化方向
|
||
|
|
1. 动态止损:根据市场波动性或价格行为调整止损水平,以更好地应对不同的市场状况。
|
||
|
|
2. 多因素确认:结合其他技术指标如相对强弱指数(RSI)或随机振荡器(Stochastic Oscillator)来确认趋势和回撤,提高信号可靠性。
|
||
|
|
3. 风险调整头寸规模:根据当前市场波动性或个人风险偏好动态调整每笔交易的头寸规模。
|
||
|
|
4. 交易时段优化:分析不同时段的价格行为和波动性,选择最佳的交易时段以提高策略表现。
|
||
|
|
5. 加入市场情绪分析:结合市场情绪指标如恐惧贪婪指数,以更好地把握市场氛围和潜在的转折点。
|
||
|
|
|
||
|
|
#### 总结
|
||
|
|
该多时间框架比特币、币安币和以太坊交易回撤策略提供了一种结构化的方法,在趋势中捕捉短期回调机会。通过结合趋势跟踪和回撤交易的原理,并应用适当的风险管理措施,该策略旨在优化潜在的交易机会。然而,策略的表现取决于参数选择和市场状况,需要持续的监控和优化。通过纳入动态止损、多因素确认和市场情绪分析等改进措施,可以进一步提升策略的稳健性和适应性。在实施该策略之前,全面的回测、参数优化和风险评估是至关重要的。
|
||
|
|
|
||
|
|
||
|
||
|
|
|
||
|
|
#### Overview
|
||
|
|
This strategy focuses on Bitcoin (BTC), Binance Coin (BNB), and Ethereum (ETH) across 1-hour, 2-hour, 3-hour, and 4-hour time frames. It aims to capitalize on short-term price pullbacks within the broader trend. By identifying retracements against the prevailing trend and using confirmation signals like candlestick patterns and oversold conditions, traders can enter positions with defined risk and profit targets. Effective risk management, including stop-loss orders and position sizing, is crucial. This strategy provides a structured approach to trading pullbacks while managing downside risk.
|
||
|
|
|
||
|
|
#### Strategy Principles
|
||
|
|
The strategy employs two Simple Moving Averages (SMAs) to capture market trends and potential pullback opportunities. The longer-period SMA (ma1) serves as a trend confirmation indicator, while the shorter-period SMA (ma2) is used to identify price deviations from the primary trend. When the price is above ma1, it indicates an uptrend, and the strategy looks for pullbacks below ma2 as potential entry points. Additionally, the strategy incorporates "Too Deep" and "Too Thin" parameters to filter out pullbacks, avoiding overly deep or shallow retracements. Once a buy signal is confirmed, the strategy executes a market buy order. Exit conditions include price breakouts above ma2 or hitting a predefined stop-loss level. The strategy leverages the principles of trend-following and pullback trading to capture short-term retracement opportunities within the prevailing trend.
|
||
|
|
|
||
|
|
#### Strategy Advantages
|
||
|
|
1. Multi-timeframe analysis: The strategy operates on 1-hour, 2-hour, 3-hour, and 4-hour time frames, providing a more comprehensive market perspective and potential trading opportunities.
|
||
|
|
2. Trend-following: By using the longer-period SMA as a trend confirmation indicator, the strategy adapts to different market trends and seeks entry opportunities within the trend.
|
||
|
|
3. Pullback trading: The strategy focuses on identifying price retracements within an uptrend, allowing for better entry prices while reducing the risk of trading against the trend.
|
||
|
|
4. Risk management: The strategy incorporates stop-loss mechanisms and position sizing controls to limit potential downside risk and protect trading capital.
|
||
|
|
5. Parameter optimization: Strategy parameters such as moving average lengths and stop-loss percentages can be optimized based on market conditions and personal preferences, providing flexibility.
|
||
|
|
|
||
|
|
#### Strategy Risks
|
||
|
|
1. Parameter sensitivity: The performance of the strategy is somewhat dependent on the chosen parameters, such as moving average lengths and pullback filters. Careful backtesting and optimization of these parameters are required.
|
||
|
|
2. Market noise: Short-term price fluctuations can lead to false signals, resulting in unnecessary trades and increased costs.
|
||
|
|
3. Trend reversals: When market trends suddenly reverse, the strategy may face potential losses, especially before the stop-loss levels are triggered.
|
||
|
|
4. Slippage and trading costs: Frequent trading can result in higher slippage and transaction costs, impacting the overall performance of the strategy.
|
||
|
|
|
||
|
|
#### Strategy Optimization Directions
|
||
|
|
1. Dynamic stop-loss: Adjust stop-loss levels based on market volatility or price behavior to better adapt to different market conditions.
|
||
|
|
2. Multi-factor confirmation: Incorporate additional technical indicators such as the Relative Strength Index (RSI) or Stochastic Oscillator to confirm trends and pullbacks, enhancing signal reliability.
|
||
|
|
3. Risk-adjusted position sizing: Dynamically adjust the position size for each trade based on current market volatility or personal risk tolerance.
|
||
|
|
4. Trading session optimization: Analyze price behavior and volatility during different trading sessions to identify the most favorable trading periods for improved strategy performance.
|
||
|
|
5. Incorporation of market sentiment analysis: Integrate market sentiment indicators like the Fear and Greed Index to better gauge market mood and potential turning points.
|
||
|
|
|
||
|
|
#### Summary
|
||
|
|
This multi-timeframe Bitcoin, Binance Coin, and Ethereum pullback trading strategy offers a structured approach to capture short-term retracement opportunities within the prevailing trend. By combining the principles of trend-following and pullback trading and applying appropriate risk management measures, the strategy aims to optimize potential trading opportunities. However, the performance of the strategy is subject to parameter selection and market conditions, requiring ongoing monitoring and optimization. By incorporating enhancements such as dynamic stop-loss, multi-factor confirmation, and market sentiment analysis, the robustness and adaptability of the strategy can be further improved. Thorough backtesting, parameter optimization, and risk assessment are essential before implementing this strategy.
|
||
|
|
[/trans]
|
||
|
|
|
||
|
|
> Strategy Arguments
|
||
|
|
|
||
|
|
|
||
|
|
|
||
|
|
|Argument|Default|Description|
|
||
|
|
|----|----|----|
|
||
|
|
|v_input_int_1|200|(?Moving avrege pprameter)MA lenth 1|
|
||
|
|
|v_input_int_2|13|MA lenth 2|
|
||
|
|
|v_input_float_1|0.07|(?moving avrege pprameter)stop loss%|
|
||
|
|
|v_input_float_2|0.27|(?Too Deep and Too Thin)Too deep(%)|
|
||
|
|
|v_input_float_3|0.03|Too thin(%)|
|
||
|
|
|
||
|
|
|
||
|
|
> Source (PineScript)
|
||
|
|
|
||
|
|
``` pinescript
|
||
|
|
/*backtest
|
||
|
|
start: 2023-04-23 00:00:00
|
||
|
|
end: 2024-04-28 00:00:00
|
||
|
|
period: 1d
|
||
|
|
basePeriod: 1h
|
||
|
|
exchanges: [{"eid":"Futures_Binance","currency":"BTC_USDT"}]
|
||
|
|
*/
|
||
|
|
|
||
|
|
// This Pine Script™ code is subject to the terms of the Mozilla Public License 2.0 at https://mozilla.org/MPL/2.0/
|
||
|
|
// © GOLU_PARDHAAN
|
||
|
|
|
||
|
|
//@version=5
|
||
|
|
strategy("Pullback stretegy", overlay=true,initial_capital = 1000,default_qty_type = strategy.percent_of_equity,default_qty_value = 100)
|
||
|
|
|
||
|
|
//input
|
||
|
|
ma_lenth1=input.int(200,'MA lenth 1',step=10,group = 'Moving avrege pprameter',inline = 'MA')
|
||
|
|
ma_lenth2=input.int(13,'MA lenth 2',step=1,group = 'Moving avrege pprameter',inline = 'MA')
|
||
|
|
sl=input.float(title = "stop loss%",defval=0.07,step=0.1,group = 'moving avrege pprameter')
|
||
|
|
too_deep=input.float(title = 'Too deep(%)',defval = 0.27,step=0.01,group='Too Deep and Too Thin',inline='Too')
|
||
|
|
too_thin=input.float(title = 'Too thin(%)',defval = 0.03,step=0.01,group='Too Deep and Too Thin',inline='Too')
|
||
|
|
//claulation
|
||
|
|
ma1=ta.sma(close,ma_lenth1)
|
||
|
|
ma2=ta.sma(close,ma_lenth2)
|
||
|
|
|
||
|
|
too_deep2= (ma2/ma1-1)<too_deep
|
||
|
|
too_thin2= (ma2/ma1-1)>too_thin
|
||
|
|
//entry and colose Conditionq
|
||
|
|
var float buy_price=0
|
||
|
|
buy_condition=(close>ma1)and(close<ma2)and strategy.position_size==0 and too_deep2 and too_thin2
|
||
|
|
close_condition1=(close>ma2)and strategy.position_size>0 and (close<low[1])
|
||
|
|
stop_distance=strategy.position_size>0? ((buy_price-close)/close): na
|
||
|
|
close_condition2=strategy.position_size>0 and stop_distance>sl
|
||
|
|
stop_price= strategy.position_size>0?buy_price-(buy_price*sl): na
|
||
|
|
|
||
|
|
|
||
|
|
//entry and close order
|
||
|
|
|
||
|
|
if buy_condition
|
||
|
|
strategy.entry('Long',strategy.long)
|
||
|
|
if buy_condition[1]
|
||
|
|
buy_price:=open
|
||
|
|
if close_condition1 or close_condition2
|
||
|
|
strategy.close('Long' ,comment = "exite"+(close_condition2 ? "SL=ture":""))
|
||
|
|
buy_price :=na
|
||
|
|
plot(ma1,color = color.blue)
|
||
|
|
plot(ma2,color = color.orange)
|
||
|
|
|
||
|
|
```
|
||
|
|
|
||
|
|
> Detail
|
||
|
|
|
||
|
|
https://www.fmz.com/strategy/449852
|
||
|
|
|
||
|
|
> Last Modified
|
||
|
|
|
||
|
|
2024-04-29 17:36:12
|