155 lines
9.0 KiB
Markdown
155 lines
9.0 KiB
Markdown

|
|
||
|
|
> Name
|
||
|
|
|
||
|
|
多指标趋势跟踪交易策略结合抛物线SAR和SuperTrend云层-Multi-Indicator-Trend-Following-Trading-Strategy-with-Parabolic-SAR-and-SuperTrend-Cloud
|
||
|
|
|
||
|
|
> Author
|
||
|
|
|
||
|
|
ianzeng123
|
||
|
|
|
||
|
|
> Strategy Description
|
||
|
|
|
||
|
|
|
||
|
|
|
||
|
|
|
||
|
|
|
||
|
|
|
||
|
|
|
||
|
|
[trans]
|
||
|
|
#### 概述
|
||
|
|
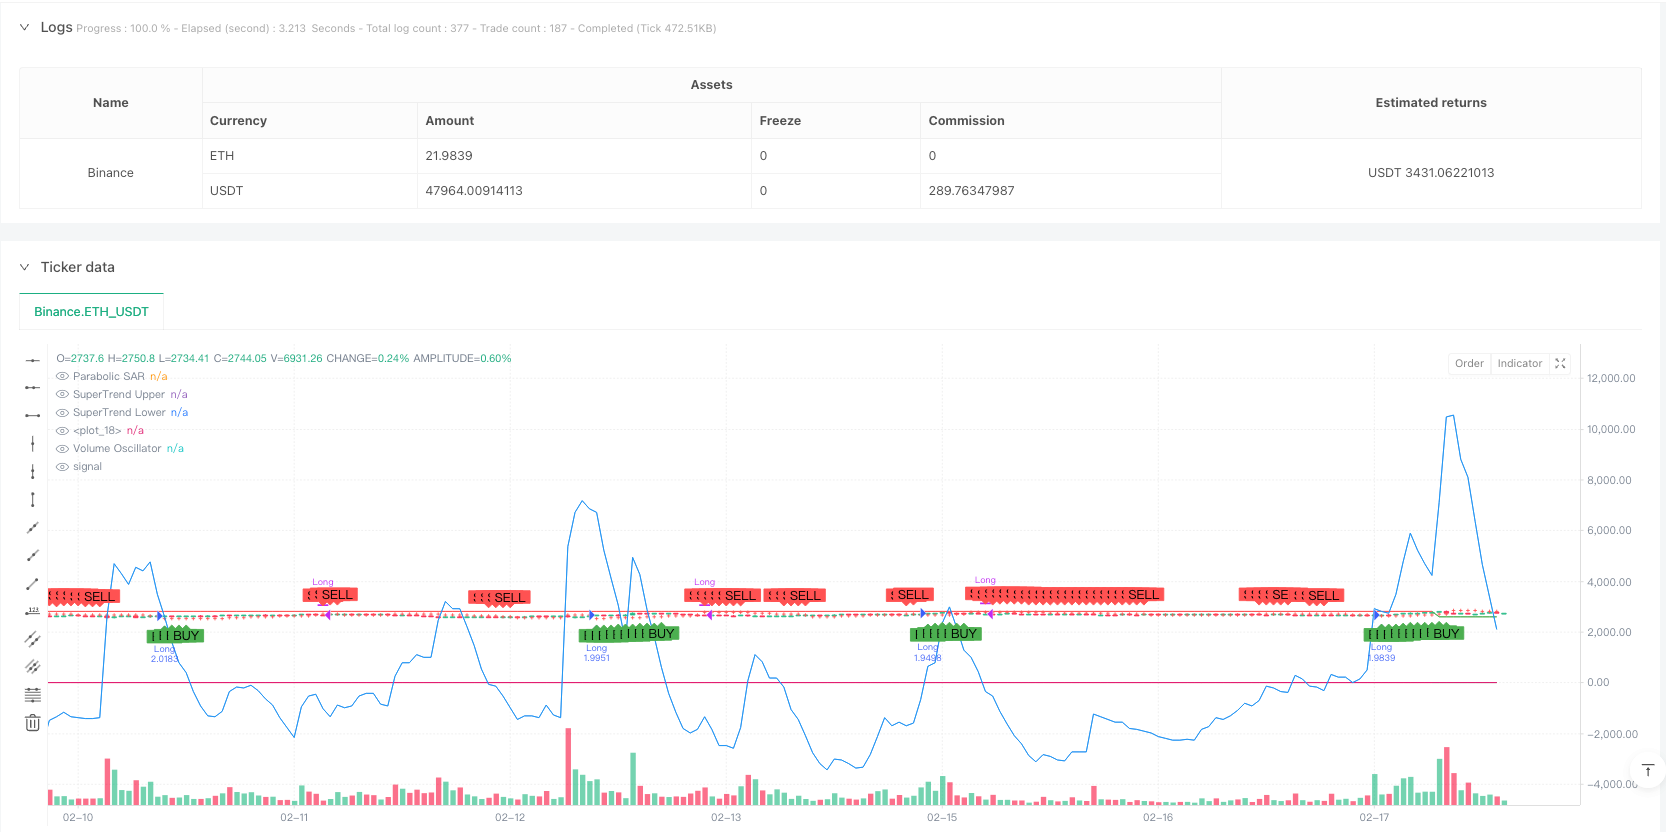
本策略是一个结合了抛物线SAR指标、SuperTrend指标和成交量震荡器(Volume Oscillator)的综合交易系统。该策略主要通过多维度的技术指标来确认市场趋势,通过指标间的相互验证来提高交易信号的可靠性。策略设计的核心思想是在趋势、动量和成交量三个维度上进行信号确认,只有当三个维度都出现一致信号时才进行交易。
|
||
|
|
|
||
|
|
#### 策略原理
|
||
|
|
策略运用了三个核心指标:
|
||
|
|
1. 抛物线SAR(起始值0.02,加速因子0.02,最大值0.2):用于识别价格趋势的反转点,当价格位于SAR点之上时看涨,反之看跌。
|
||
|
|
2. SuperTrend(周期10,乘数3):结合ATR波动率指标,生成动态的趋势通道。当价格突破上轨时产生做多信号,突破下轨时产生做空信号。
|
||
|
|
3. 成交量震荡器(短期14,长期28):通过对比成交量的短期和长期移动平均线来衡量交易活跃度,正值表示成交量增加,负值表示成交量减少。
|
||
|
|
|
||
|
|
交易信号生成逻辑:
|
||
|
|
- 做多条件:价格在SAR之上 + SuperTrend看涨(价格在下轨之上) + 成交量震荡器为正
|
||
|
|
- 平仓条件:价格在SAR之下 + SuperTrend看跌(价格在上轨之下) + 成交量震荡器为负
|
||
|
|
|
||
|
|
#### 策略优势
|
||
|
|
1. 多维度确认:通过价格趋势、动态通道和成交量三个维度的共振来确认交易信号,大大降低了假突破的风险。
|
||
|
|
2. 动态适应:SuperTrend指标基于ATR动态调整通道宽度,能更好地适应不同的市场波动环境。
|
||
|
|
3. 风险控制:使用百分比仓位管理(设定为账户净值的10%),有效控制每笔交易的风险敞口。
|
||
|
|
4. 可视化效果:策略提供了清晰的视觉反馈,包括SAR点、趋势云层和交易信号标记。
|
||
|
|
|
||
|
|
#### 策略风险
|
||
|
|
1. 震荡市风险:在横盘震荡市场中可能频繁出现假信号,导致连续止损。
|
||
|
|
2. 滞后性风险:由于使用了多个移动平均线类指标,信号存在一定滞后性,可能错过最佳入场点。
|
||
|
|
3. 参数敏感性:策略效果对参数设置较为敏感,不同市场环境可能需要不同的参数组合。
|
||
|
|
4. 成本影响:频繁交易可能带来较高的交易成本,影响整体收益。
|
||
|
|
|
||
|
|
#### 策略优化方向
|
||
|
|
1. 市场环境过滤:建议添加市场环境识别模块,在震荡市场下自动降低仓位或暂停交易。
|
||
|
|
2. 动态参数优化:可以根据市场波动率自动调整SuperTrend的参数,提高策略适应性。
|
||
|
|
3. 止损优化:建议增加追踪止损功能,在趋势反转时及时锁定利润。
|
||
|
|
4. 分时段优化:针对不同交易时段的特点,可以调整信号触发的阈值要求。
|
||
|
|
5. 成本控制:可以增加持仓时间限制,避免过于频繁的交易。
|
||
|
|
|
||
|
|
#### 总结
|
||
|
|
该策略通过结合趋势跟踪和成交量分析,构建了一个相对完整的交易系统。策略的主要特点是使用多重指标确认来提高交易的可靠性,同时通过可视化设计为交易者提供直观的决策参考。虽然存在一定的滞后性和参数敏感性问题,但通过合理的优化和风险控制措施,该策略具有良好的实用价值。建议交易者在实盘使用时,先通过回测找到适合自己的参数组合,并结合市场经验进行灵活调整。
|
||
|
|
|
||
|
|
||
|
||
|
|
|
||
|
|
#### Overview
|
||
|
|
This strategy is a comprehensive trading system that combines the Parabolic SAR indicator, SuperTrend indicator, and Volume Oscillator. The strategy confirms market trends through multiple technical indicators, enhancing trading signal reliability through cross-validation. The core design philosophy is to confirm signals across three dimensions: trend, momentum, and volume, only executing trades when all three dimensions show consistent signals.
|
||
|
|
|
||
|
|
#### Strategy Principles
|
||
|
|
The strategy employs three core indicators:
|
||
|
|
1. Parabolic SAR (Start 0.02, Acceleration 0.02, Maximum 0.2): Identifies trend reversal points. Bullish when price is above SAR points, bearish when below.
|
||
|
|
2. SuperTrend (Period 10, Multiplier 3): Generates dynamic trend channels using ATR volatility. Produces buy signals on upper band breakouts and sell signals on lower band breakouts.
|
||
|
|
3. Volume Oscillator (Short 14, Long 28): Measures trading activity by comparing short-term and long-term volume moving averages. Positive values indicate increasing volume, negative values indicate decreasing volume.
|
||
|
|
|
||
|
|
Signal Generation Logic:
|
||
|
|
- Buy Condition: Price above SAR + Bullish SuperTrend (price above lower band) + Positive Volume Oscillator
|
||
|
|
- Exit Condition: Price below SAR + Bearish SuperTrend (price below upper band) + Negative Volume Oscillator
|
||
|
|
|
||
|
|
#### Strategy Advantages
|
||
|
|
1. Multi-dimensional Confirmation: Validates trading signals through price trend, dynamic channels, and volume, significantly reducing false breakout risks.
|
||
|
|
2. Dynamic Adaptation: SuperTrend adjusts channel width based on ATR, better adapting to varying market volatility conditions.
|
||
|
|
3. Risk Control: Implements percentage-based position sizing (set at 10% of equity), effectively controlling risk exposure per trade.
|
||
|
|
4. Visualization: Provides clear visual feedback including SAR points, trend clouds, and trade signal markers.
|
||
|
|
|
||
|
|
#### Strategy Risks
|
||
|
|
1. Ranging Market Risk: May generate frequent false signals in sideways markets, leading to consecutive stops.
|
||
|
|
2. Lag Risk: Due to multiple moving average-based indicators, signals have inherent lag, potentially missing optimal entry points.
|
||
|
|
3. Parameter Sensitivity: Strategy performance is sensitive to parameter settings, different market conditions may require different parameter combinations.
|
||
|
|
4. Cost Impact: Frequent trading may incur high transaction costs, affecting overall returns.
|
||
|
|
|
||
|
|
#### Strategy Optimization Directions
|
||
|
|
1. Market Environment Filter: Recommend adding market environment recognition module to reduce position size or pause trading in ranging markets.
|
||
|
|
2. Dynamic Parameter Optimization: Automatically adjust SuperTrend parameters based on market volatility to improve adaptability.
|
||
|
|
3. Stop Loss Optimization: Add trailing stop functionality to secure profits during trend reversals.
|
||
|
|
4. Time-based Optimization: Adjust signal trigger thresholds based on characteristics of different trading sessions.
|
||
|
|
5. Cost Control: Implement holding time restrictions to avoid excessive trading frequency.
|
||
|
|
|
||
|
|
#### Summary
|
||
|
|
This strategy builds a relatively complete trading system by combining trend following and volume analysis. Its main feature is using multiple indicator confirmation to enhance trading reliability while providing traders with intuitive decision references through visualization. Although it has certain lag and parameter sensitivity issues, the strategy has good practical value through proper optimization and risk control measures. Traders are advised to find suitable parameter combinations through backtesting before live trading and make flexible adjustments based on market experience.
|
||
|
|
[/trans]
|
||
|
|
|
||
|
|
|
||
|
|
|
||
|
|
> Source (PineScript)
|
||
|
|
|
||
|
|
``` pinescript
|
||
|
|
//@version=5
|
||
|
|
strategy("Parabolic SAR + SuperTrend + Volume Oscillator Strategy", overlay=true, default_qty_type=strategy.percent_of_equity, default_qty_value=10)
|
||
|
|
|
||
|
|
// --- Parabolic SAR Parameters ---
|
||
|
|
sar_start = 0.02
|
||
|
|
sar_increment = 0.02
|
||
|
|
sar_max = 0.2
|
||
|
|
sar = ta.sar(sar_start, sar_increment, sar_max)
|
||
|
|
plot(sar, color=color.red, style=plot.style_cross, title="Parabolic SAR")
|
||
|
|
|
||
|
|
// --- SuperTrend Parameters ---
|
||
|
|
st_length = 10
|
||
|
|
st_multiplier = 3
|
||
|
|
[st_upper, st_lower] = ta.supertrend(st_length, st_multiplier)
|
||
|
|
st_color = close > st_upper ? color.green : color.red
|
||
|
|
plot(st_upper, color=color.new(st_color, 0), title="SuperTrend Upper")
|
||
|
|
plot(st_lower, color=color.new(st_color, 0), title="SuperTrend Lower")
|
||
|
|
fill(plot(st_upper), plot(st_lower), color=color.new(st_color, 90), title="SuperTrend Cloud")
|
||
|
|
|
||
|
|
// --- Volume Oscillator Parameters ---
|
||
|
|
vo_short_length = 14
|
||
|
|
vo_long_length = 28
|
||
|
|
vo = ta.ema(volume, vo_short_length) - ta.ema(volume, vo_long_length)
|
||
|
|
plot(vo, color=color.blue, title="Volume Oscillator")
|
||
|
|
|
||
|
|
// --- Buy and Sell Conditions ---
|
||
|
|
// Buy Condition:
|
||
|
|
// - Price is above Parabolic SAR
|
||
|
|
// - SuperTrend is bullish (price above SuperTrend lower line)
|
||
|
|
// - Volume Oscillator is positive (indicating increasing volume)
|
||
|
|
buyCondition = close > sar and close > st_lower and vo > 0
|
||
|
|
|
||
|
|
// Sell Condition:
|
||
|
|
// - Price is below Parabolic SAR
|
||
|
|
// - SuperTrend is bearish (price below SuperTrend upper line)
|
||
|
|
// - Volume Oscillator is negative (indicating decreasing volume)
|
||
|
|
sellCondition = close < sar and close < st_upper and vo < 0
|
||
|
|
|
||
|
|
// Plot Buy/Sell Signals
|
||
|
|
plotshape(series=buyCondition, title="Buy Signal", location=location.belowbar, color=color.green, style=shape.labelup, text="BUY")
|
||
|
|
plotshape(series=sellCondition, title="Sell Signal", location=location.abovebar, color=color.red, style=shape.labeldown, text="SELL")
|
||
|
|
|
||
|
|
// --- Execute Trades ---
|
||
|
|
if (buyCondition)
|
||
|
|
strategy.entry("Long", strategy.long)
|
||
|
|
|
||
|
|
if (sellCondition)
|
||
|
|
strategy.close("Long")
|
||
|
|
|
||
|
|
```
|
||
|
|
|
||
|
|
> Detail
|
||
|
|
|
||
|
|
https://www.fmz.com/strategy/482874
|
||
|
|
|
||
|
|
> Last Modified
|
||
|
|
|
||
|
|
2025-02-21 15:02:58
|