174 lines
8.3 KiB
Markdown
174 lines
8.3 KiB
Markdown

|
|
||
|
|
> Name
|
||
|
|
|
||
|
|
多指标融合自适应趋势交易策略-Multi-Indicator-Adaptive-Trend-Trading-Strategy
|
||
|
|
|
||
|
|
> Author
|
||
|
|
|
||
|
|
ianzeng123
|
||
|
|
|
||
|
|
> Strategy Description
|
||
|
|
|
||
|
|
|
||
|
|
|
||
|
|
|
||
|
|
|
||
|
|
|
||
|
|
|
||
|
|
[trans]
|
||
|
|
#### 概述
|
||
|
|
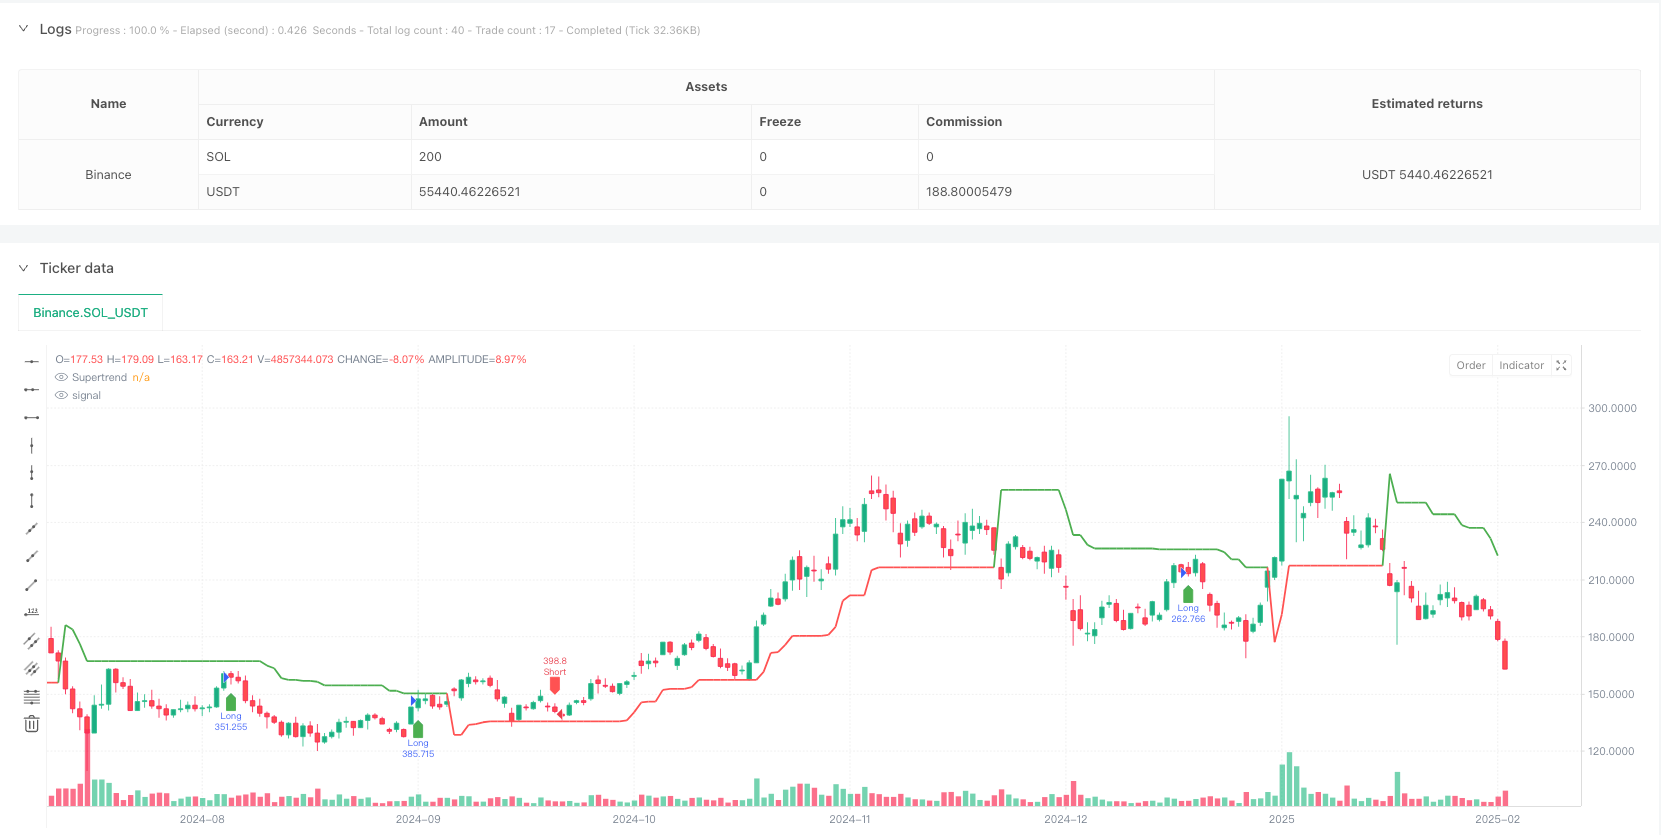
该策略是一个融合了多个技术指标的自适应趋势跟踪交易系统。它结合了均线系统(EMA)、动量指标(RSI)、趋势指标(MACD)和SuperTrend进行信号确认,并配备了完善的风险管理机制,包括止损、止盈和移动止损等功能。策略设计充分考虑了市场波动性,通过多重信号过滤和风险控制来提高交易的稳定性和可靠性。
|
||
|
|
|
||
|
|
#### 策略原理
|
||
|
|
策略采用多层信号确认机制:
|
||
|
|
1. 通过9周期和21周期EMA的交叉确定初步趋势方向
|
||
|
|
2. 使用RSI(14)进行超买超卖过滤,买入信号要求RSI>40且<70,卖出信号要求RSI<60且>30
|
||
|
|
3. MACD指标验证趋势动能,要求信号线与MACD线方向一致
|
||
|
|
4. SuperTrend指标提供额外的趋势确认
|
||
|
|
5. 风险控制采用5%止损、10%止盈、2%追踪止损和1%保本点位
|
||
|
|
当所有条件同时满足时才会触发交易信号,有效降低了假突破带来的风险。
|
||
|
|
|
||
|
|
#### 策略优势
|
||
|
|
1. 多重信号确认机制显著降低假信号干扰
|
||
|
|
2. 完善的风险控制体系,包含固定止损、移动止损和保本止损
|
||
|
|
3. 策略具有良好的自适应性,可以适应不同的市场环境
|
||
|
|
4. 入场和出场逻辑清晰,易于理解和维护
|
||
|
|
5. 交易逻辑具有良好的理论基础,每个指标都有其特定的功能
|
||
|
|
|
||
|
|
#### 策略风险
|
||
|
|
1. 多重信号确认可能导致错过一些重要的交易机会
|
||
|
|
2. 在剧烈波动市场中,固定的止损位可能不够灵活
|
||
|
|
3. 参数优化可能导致过度拟合历史数据
|
||
|
|
4. 多个指标可能在横盘市场产生混淆信号
|
||
|
|
解决方案包括:动态调整止损参数、引入波动率指标、定期重新优化参数等。
|
||
|
|
|
||
|
|
#### 策略优化方向
|
||
|
|
1. 引入自适应参数机制,根据市场波动率动态调整各项参数
|
||
|
|
2. 增加成交量指标作为辅助确认工具
|
||
|
|
3. 优化止损机制,引入基于ATR的动态止损
|
||
|
|
4. 加入市场环境识别模块,在不同市场条件下使用不同的参数组合
|
||
|
|
5. 开发基于机器学习的参数优化系统
|
||
|
|
|
||
|
|
#### 总结
|
||
|
|
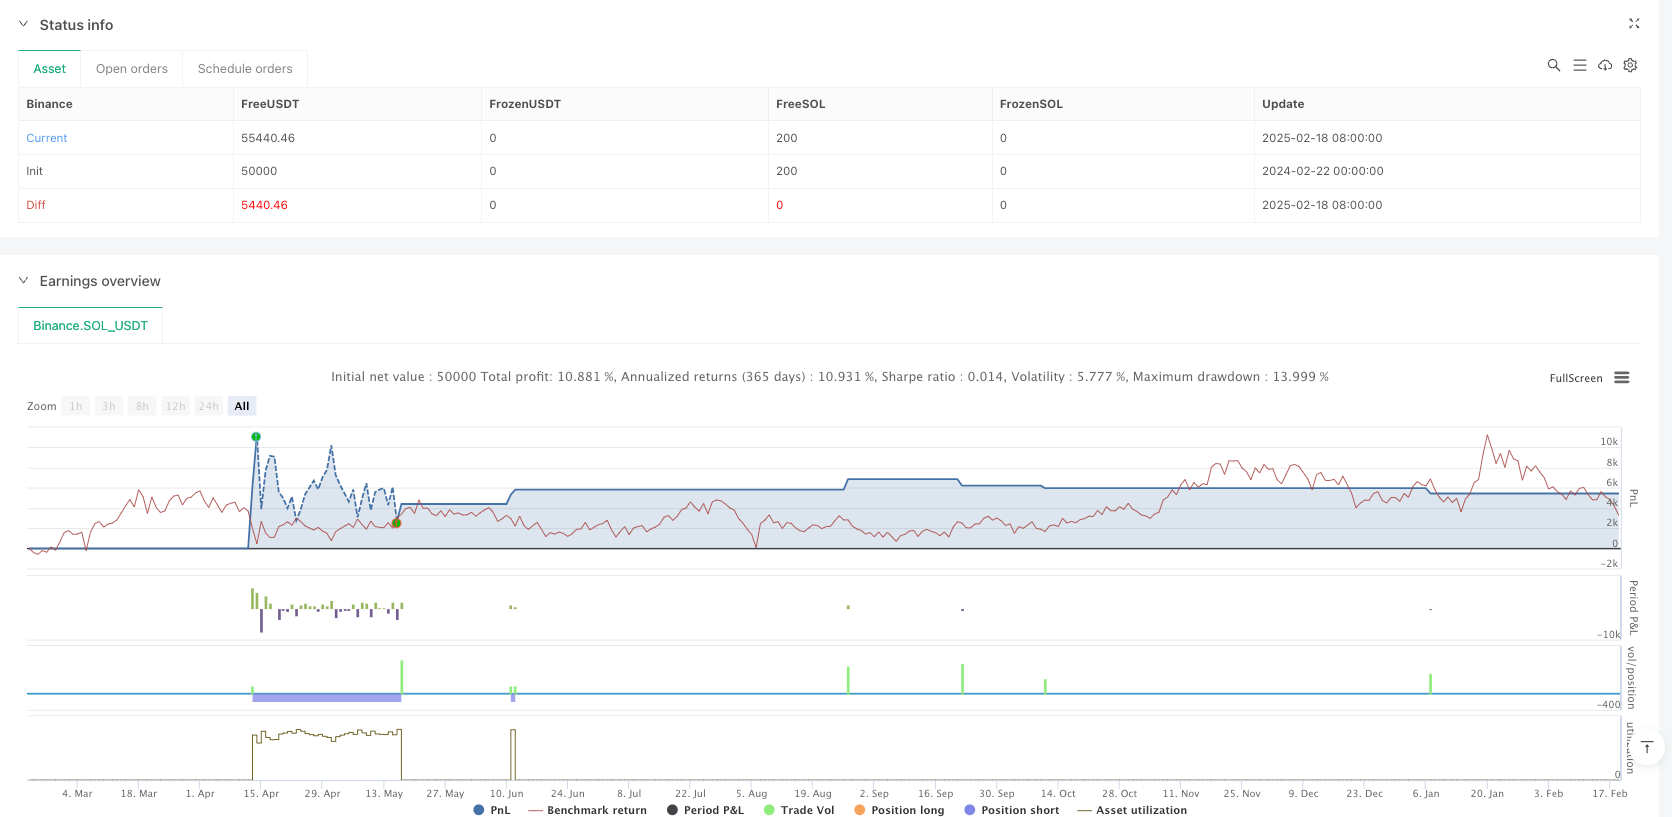
该策略通过多维度技术指标的协同配合,构建了一个稳健的交易系统。完善的风险控制机制和清晰的交易逻辑使其具有良好的实用性。虽然存在一定的优化空间,但策略的基本框架具有扎实的理论基础,通过持续优化和改进,有望进一步提升其交易效果。 ||
|
||
|
|
|
||
|
|
#### Overview
|
||
|
|
This strategy is an adaptive trend following trading system that integrates multiple technical indicators. It combines the Moving Average system (EMA), momentum indicator (RSI), trend indicator (MACD), and SuperTrend for signal confirmation, equipped with comprehensive risk management mechanisms including stop-loss, take-profit, and trailing stop functionalities. The strategy design fully considers market volatility, enhancing trading stability and reliability through multiple signal filters and risk controls.
|
||
|
|
|
||
|
|
#### Strategy Principles
|
||
|
|
The strategy employs a multi-layer signal confirmation mechanism:
|
||
|
|
1. Initial trend direction determined by 9-period and 21-period EMA crossovers
|
||
|
|
2. RSI(14) for overbought/oversold filtering, requiring RSI>40 and <70 for buy signals, RSI<60 and >30 for sell signals
|
||
|
|
3. MACD indicator verifies trend momentum, requiring signal line and MACD line alignment
|
||
|
|
4. SuperTrend indicator provides additional trend confirmation
|
||
|
|
5. Risk control employs 5% stop-loss, 10% take-profit, 2% trailing stop, and 1% breakeven level
|
||
|
|
Trades are only triggered when all conditions are simultaneously met, effectively reducing false breakout risks.
|
||
|
|
|
||
|
|
#### Strategy Advantages
|
||
|
|
1. Multiple signal confirmation mechanism significantly reduces false signal interference
|
||
|
|
2. Comprehensive risk control system including fixed stops, trailing stops, and breakeven stops
|
||
|
|
3. Strategy demonstrates good adaptability to different market environments
|
||
|
|
4. Clear entry and exit logic, easy to understand and maintain
|
||
|
|
5. Trading logic has solid theoretical foundation, each indicator serves a specific purpose
|
||
|
|
|
||
|
|
#### Strategy Risks
|
||
|
|
1. Multiple signal confirmation may cause missing important trading opportunities
|
||
|
|
2. Fixed stop-loss levels may lack flexibility in highly volatile markets
|
||
|
|
3. Parameter optimization might lead to overfitting historical data
|
||
|
|
4. Multiple indicators may generate conflicting signals in ranging markets
|
||
|
|
Solutions include: dynamic stop-loss adjustment, volatility indicator integration, regular parameter re-optimization.
|
||
|
|
|
||
|
|
#### Strategy Optimization Directions
|
||
|
|
1. Introduce adaptive parameter mechanisms to dynamically adjust parameters based on market volatility
|
||
|
|
2. Add volume indicators as supplementary confirmation tools
|
||
|
|
3. Optimize stop-loss mechanism by implementing ATR-based dynamic stops
|
||
|
|
4. Include market environment recognition module to use different parameter sets under different market conditions
|
||
|
|
5. Develop machine learning-based parameter optimization system
|
||
|
|
|
||
|
|
#### Summary
|
||
|
|
The strategy constructs a robust trading system through multi-dimensional technical indicator collaboration. Its comprehensive risk control mechanism and clear trading logic provide good practicality. While there is room for optimization, the strategy's basic framework has a solid theoretical foundation, and through continuous optimization and improvement, it has the potential to further enhance its trading performance.[/trans]
|
||
|
|
|
||
|
|
|
||
|
|
|
||
|
|
> Source (PineScript)
|
||
|
|
|
||
|
|
``` pinescript
|
||
|
|
/*backtest
|
||
|
|
start: 2024-02-22 00:00:00
|
||
|
|
end: 2025-02-19 08:00:00
|
||
|
|
period: 1d
|
||
|
|
basePeriod: 1d
|
||
|
|
exchanges: [{"eid":"Binance","currency":"SOL_USDT"}]
|
||
|
|
*/
|
||
|
|
|
||
|
|
//@version=5
|
||
|
|
strategy("Optimized BTC Trading Strategy v2", overlay=true, default_qty_type=strategy.percent_of_equity, default_qty_value=100, commission_type=strategy.commission.percent, commission_value=0.1)
|
||
|
|
|
||
|
|
// Input parameters
|
||
|
|
emaShort = ta.ema(close, 9)
|
||
|
|
emaLong = ta.ema(close, 21)
|
||
|
|
|
||
|
|
// RSI settings
|
||
|
|
rsi = ta.rsi(close, 14)
|
||
|
|
rsiBuyLevel = 40
|
||
|
|
rsiSellLevel = 60
|
||
|
|
|
||
|
|
// MACD settings
|
||
|
|
[macdLine, signalLine, _] = ta.macd(close, 12, 26, 9)
|
||
|
|
|
||
|
|
// Supertrend settings
|
||
|
|
factor = input.float(3, title="Supertrend Factor")
|
||
|
|
atrLength = input.int(10, title="ATR Length")
|
||
|
|
[superTrend, superTrendDirection] = ta.supertrend(factor, atrLength)
|
||
|
|
|
||
|
|
// Risk Management (Stop Loss & Take Profit)
|
||
|
|
stopLossPercent = 0.05 // 5%
|
||
|
|
takeProfitPercent = 0.10 // 10%
|
||
|
|
trailingStopPercent = 0.02 // 2% trailing stop for additional security
|
||
|
|
breakevenBuffer = 0.01 // 1% breakeven buffer
|
||
|
|
|
||
|
|
// Fetching average price once to avoid repeated calculations
|
||
|
|
var float avgPrice = na
|
||
|
|
if strategy.position_size != 0
|
||
|
|
avgPrice := strategy.position_avg_price
|
||
|
|
|
||
|
|
// Stop Loss & Take Profit Levels
|
||
|
|
longSL = avgPrice * (1 - stopLossPercent)
|
||
|
|
longTP = avgPrice * (1 + takeProfitPercent)
|
||
|
|
shortSL = avgPrice * (1 + stopLossPercent)
|
||
|
|
shortTP = avgPrice * (1 - takeProfitPercent)
|
||
|
|
breakevenLevel = avgPrice * (1 + breakevenBuffer)
|
||
|
|
|
||
|
|
// Entry Conditions
|
||
|
|
buyCondition = ta.crossover(emaShort, emaLong) and rsi > rsiBuyLevel and rsi < 70 and (macdLine > signalLine) and superTrendDirection == 1
|
||
|
|
sellCondition = ta.crossunder(emaShort, emaLong) and rsi < rsiSellLevel and rsi > 30 and (macdLine < signalLine) and superTrendDirection == -1
|
||
|
|
|
||
|
|
// Ensure no conflicting trades
|
||
|
|
if buyCondition and strategy.position_size <= 0
|
||
|
|
strategy.entry("Long", strategy.long)
|
||
|
|
strategy.exit("Long Exit", from_entry="Long", limit=longTP, stop=longSL, trail_points=trailingStopPercent * avgPrice)
|
||
|
|
strategy.exit("Breakeven", from_entry="Long", stop=breakevenLevel)
|
||
|
|
|
||
|
|
if sellCondition and strategy.position_size >= 0
|
||
|
|
strategy.close("Long")
|
||
|
|
strategy.entry("Short", strategy.short)
|
||
|
|
strategy.exit("Short Exit", from_entry="Short", limit=shortTP, stop=shortSL, trail_points=trailingStopPercent * avgPrice)
|
||
|
|
strategy.exit("Breakeven", from_entry="Short", stop=breakevenLevel)
|
||
|
|
|
||
|
|
// Plot Buy & Sell signals with trend-based color indicators
|
||
|
|
plotshape(series=buyCondition, location=location.belowbar, color=color.green, style=shape.labelup, title="BUY", size=size.small)
|
||
|
|
plotshape(series=sellCondition, location=location.abovebar, color=color.red, style=shape.labeldown, title="SELL", size=size.small)
|
||
|
|
|
||
|
|
// Trend Indicator (for better visualization)
|
||
|
|
plot(superTrend, color=superTrendDirection == 1 ? color.green : color.red, linewidth=2, title="Supertrend")
|
||
|
|
|
||
|
|
```
|
||
|
|
|
||
|
|
> Detail
|
||
|
|
|
||
|
|
https://www.fmz.com/strategy/483067
|
||
|
|
|
||
|
|
> Last Modified
|
||
|
|
|
||
|
|
2025-02-21 11:34:21
|