279 lines
13 KiB
Markdown
279 lines
13 KiB
Markdown

|
|
||
|
|
> Name
|
||
|
|
|
||
|
|
多指标综合交易策略动量超买超卖与波动率的完美结合-Multi-Indicator-Comprehensive-Trading-Strategy-Perfect-Combination-of-Momentum-Overbought-Oversold-and-Volatility
|
||
|
|
|
||
|
|
> Author
|
||
|
|
|
||
|
|
ChaoZhang
|
||
|
|
|
||
|
|
> Strategy Description
|
||
|
|
|
||
|
|
|
||
|
|
|
||
|
|
[trans]
|
||
|
|
#### 概述
|
||
|
|
|
||
|
|
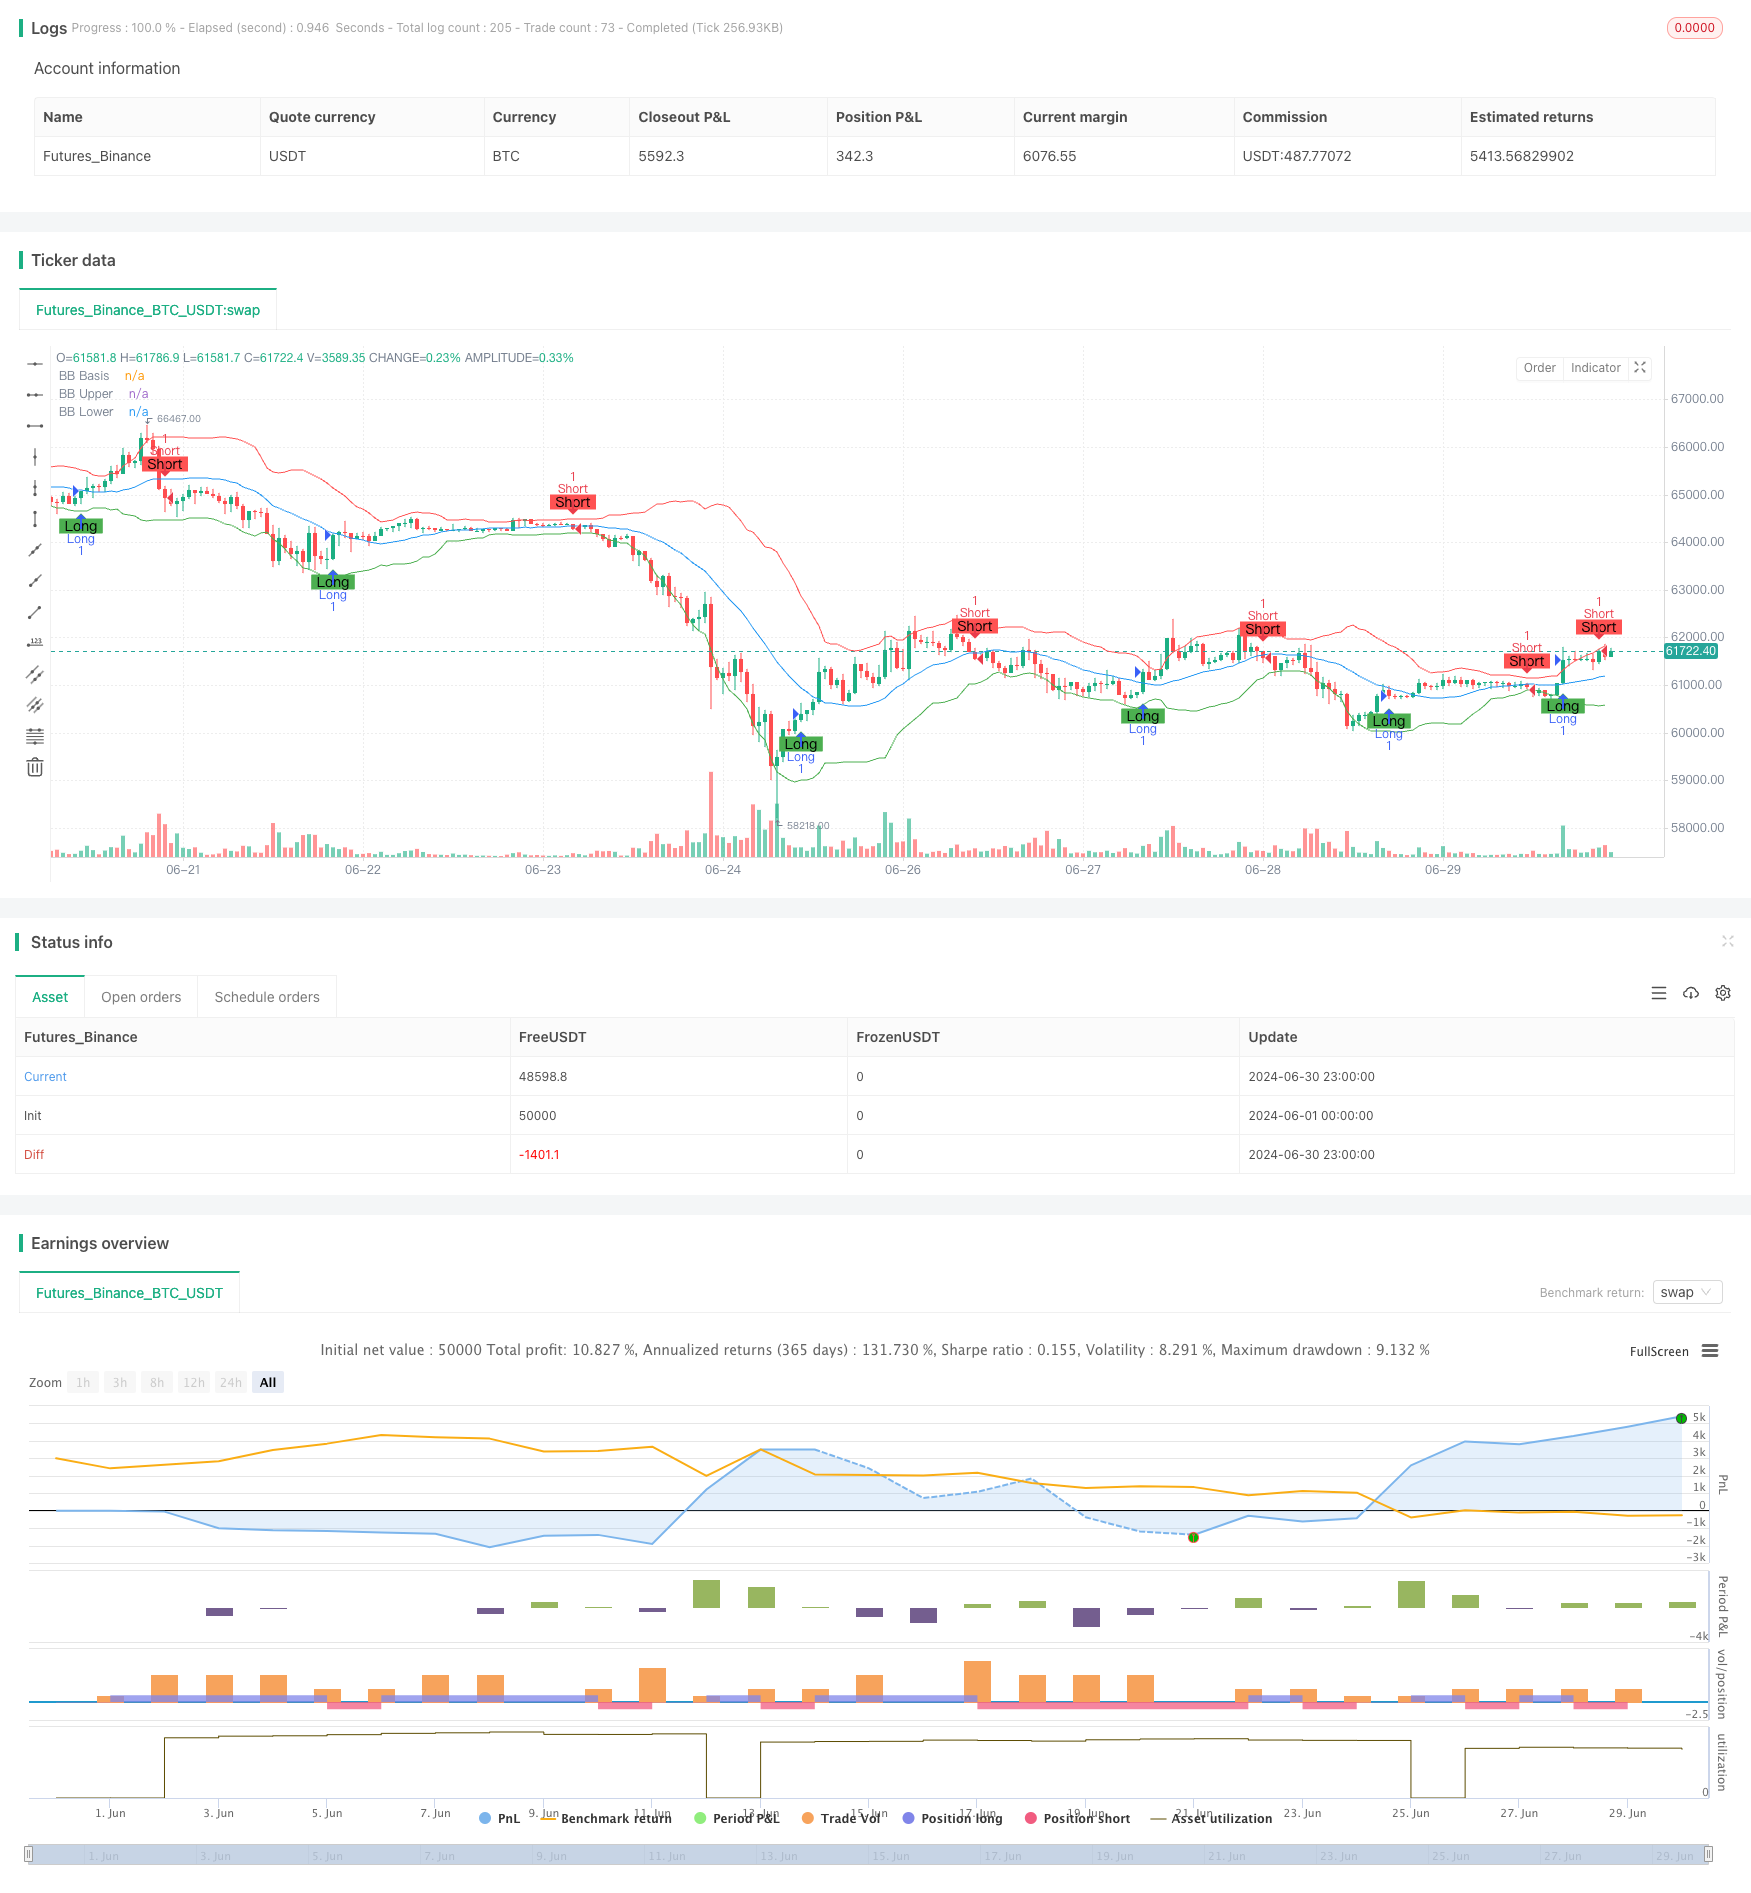
这个多指标综合交易策略是一个结合了动量、超买超卖和波动率分析的复杂交易系统。该策略融合了移动平均收敛散度(MACD)、相对强弱指标(RSI)和布林带(Bollinger Bands)三个技术指标,旨在捕捉市场趋势、识别超买超卖条件,并利用价格波动性来优化交易决策。这种多维度的分析方法旨在提供更全面和稳健的交易信号,适用于各种市场环境。
|
||
|
|
|
||
|
|
#### 策略原理
|
||
|
|
|
||
|
|
1. MACD分析:
|
||
|
|
- 使用12周期和26周期的指数移动平均线(EMA)计算MACD线。
|
||
|
|
- 计算9周期的MACD信号线。
|
||
|
|
- MACD柱状图用于判断动量变化。
|
||
|
|
|
||
|
|
2. RSI分析:
|
||
|
|
- 使用14周期的RSI计算。
|
||
|
|
- 设定70为超买水平,30为超卖水平。
|
||
|
|
|
||
|
|
3. 布林带分析:
|
||
|
|
- 使用20周期的简单移动平均线(SMA)作为中轨。
|
||
|
|
- 上下轨为中轨加减2倍标准差。
|
||
|
|
|
||
|
|
4. 入场条件:
|
||
|
|
- 多头入场:MACD线上穿信号线或RSI跌破超卖水平,且价格高于布林带下轨。
|
||
|
|
- 空头入场:MACD线下穿信号线或RSI突破超买水平,且价格低于布林带上轨。
|
||
|
|
|
||
|
|
5. 风险管理:
|
||
|
|
- 设置2%的止损。
|
||
|
|
- 设置5%的止盈。
|
||
|
|
|
||
|
|
#### 策略优势
|
||
|
|
|
||
|
|
1. 多维度分析:结合动量、超买超卖和波动率指标,提供更全面的市场洞察。
|
||
|
|
|
||
|
|
2. 灵活适应:能够在趋势和震荡市场中都有良好表现。
|
||
|
|
|
||
|
|
3. 风险控制:内置止损和止盈机制,有效管理每笔交易的风险。
|
||
|
|
|
||
|
|
4. 自动化执行:策略可以全自动运行,减少人为干预和情绪影响。
|
||
|
|
|
||
|
|
5. 可视化支持:通过图表展示各指标和交易信号,便于分析和优化。
|
||
|
|
|
||
|
|
#### 策略风险
|
||
|
|
|
||
|
|
1. 假突破风险:在横盘市场可能产生频繁的假信号。
|
||
|
|
解决方法:考虑增加信号确认机制,如要求信号持续一定时间。
|
||
|
|
|
||
|
|
2. 过度交易:多个指标可能导致过多交易,增加成本。
|
||
|
|
解决方法:增加交易间隔限制或提高入场门槛。
|
||
|
|
|
||
|
|
3. 参数敏感性:多个指标参数需要优化,可能导致过度拟合。
|
||
|
|
解决方法:进行严格的历史数据回测和前向测试。
|
||
|
|
|
||
|
|
4. 市场环境依赖:策略在不同市场环境下表现可能不一致。
|
||
|
|
解决方法:增加市场环境识别机制,根据不同环境调整策略参数。
|
||
|
|
|
||
|
|
5. 固定止损止盈的局限性:可能在某些情况下过早退出有利行情。
|
||
|
|
解决方法:考虑使用动态止损止盈,如跟踪止损。
|
||
|
|
|
||
|
|
#### 策略优化方向
|
||
|
|
|
||
|
|
1. 动态参数调整:
|
||
|
|
- 根据市场波动性自动调整MACD、RSI和布林带的参数。
|
||
|
|
- 原因:不同市场环境需要不同的参数设置以获得最佳性能。
|
||
|
|
|
||
|
|
2. 增加市场趋势过滤器:
|
||
|
|
- 引入长期趋势判断,如200日移动平均线。
|
||
|
|
- 原因:在强趋势市场中,可以减少逆势交易,提高胜率。
|
||
|
|
|
||
|
|
3. 优化入场时机:
|
||
|
|
- 增加成交量确认或价格行为分析。
|
||
|
|
- 原因:可以减少假突破,提高交易质量。
|
||
|
|
|
||
|
|
4. 改进风险管理:
|
||
|
|
- 实现动态止损和止盈,如基于ATR的移动止损。
|
||
|
|
- 原因:更好地适应市场波动,保护利润并减少不必要的损失。
|
||
|
|
|
||
|
|
5. 加入情绪指标:
|
||
|
|
- 整合VIX或其他市场情绪指标。
|
||
|
|
- 原因:市场情绪对短期价格走势有显著影响,可以提高预测准确性。
|
||
|
|
|
||
|
|
6. 实现仓位管理:
|
||
|
|
- 基于风险和信号强度动态调整仓位大小。
|
||
|
|
- 原因:优化资金利用效率,在高确信度时增加收益,低确信度时控制风险。
|
||
|
|
|
||
|
|
#### 总结
|
||
|
|
|
||
|
|
这个多指标综合交易策略通过结合MACD、RSI和布林带,创建了一个全面的交易系统,能够捕捉市场动量、识别超买超卖条件,并利用价格波动性。策略的主要优势在于其多维度分析和内置的风险管理机制,使其能够在不同市场环境中保持稳定性。然而,策略也面临假信号、过度交易和参数优化等挑战。
|
||
|
|
|
||
|
|
未来的优化方向应focus在动态参数调整、市场环境识别、入场时机优化和更先进的风险管理技术上。通过这些改进,该策略有潜力成为一个更加稳健和适应性强的交易系统。
|
||
|
|
|
||
|
|
重要的是,交易者在实际应用中应始终保持警惕,持续监控策略表现,并根据市场变化及时调整。尽管这个策略提供了一个强大的框架,但成功的交易仍然需要经验、耐心和持续的学习。
|
||
|
|
|
||
|
|
||
|
||
|
|
|
||
|
|
#### Overview
|
||
|
|
|
||
|
|
This multi-indicator comprehensive trading strategy is a complex trading system that combines momentum, overbought/oversold, and volatility analysis. The strategy integrates three technical indicators: Moving Average Convergence Divergence (MACD), Relative Strength Index (RSI), and Bollinger Bands (BB), aiming to capture market trends, identify overbought/oversold conditions, and utilize price volatility to optimize trading decisions. This multi-dimensional analysis approach is designed to provide more comprehensive and robust trading signals, suitable for various market environments.
|
||
|
|
|
||
|
|
#### Strategy Principles
|
||
|
|
|
||
|
|
1. MACD Analysis:
|
||
|
|
- Uses 12-period and 26-period Exponential Moving Averages (EMA) to calculate the MACD line.
|
||
|
|
- Calculates a 9-period MACD signal line.
|
||
|
|
- MACD histogram is used to determine momentum changes.
|
||
|
|
|
||
|
|
2. RSI Analysis:
|
||
|
|
- Uses a 14-period RSI calculation.
|
||
|
|
- Sets 70 as the overbought level and 30 as the oversold level.
|
||
|
|
|
||
|
|
3. Bollinger Bands Analysis:
|
||
|
|
- Uses a 20-period Simple Moving Average (SMA) as the middle band.
|
||
|
|
- Upper and lower bands are set at 2 standard deviations above and below the middle band.
|
||
|
|
|
||
|
|
4. Entry Conditions:
|
||
|
|
- Long Entry: MACD line crosses above the signal line or RSI drops below the oversold level, and price is above the lower Bollinger Band.
|
||
|
|
- Short Entry: MACD line crosses below the signal line or RSI breaks above the overbought level, and price is below the upper Bollinger Band.
|
||
|
|
|
||
|
|
5. Risk Management:
|
||
|
|
- Sets a 2% stop loss.
|
||
|
|
- Sets a 5% take profit.
|
||
|
|
|
||
|
|
#### Strategy Advantages
|
||
|
|
|
||
|
|
1. Multi-dimensional Analysis: Combines momentum, overbought/oversold, and volatility indicators for more comprehensive market insights.
|
||
|
|
|
||
|
|
2. Adaptability: Performs well in both trending and ranging markets.
|
||
|
|
|
||
|
|
3. Risk Control: Built-in stop loss and take profit mechanisms effectively manage risk for each trade.
|
||
|
|
|
||
|
|
4. Automated Execution: Strategy can run fully automatically, reducing human intervention and emotional influence.
|
||
|
|
|
||
|
|
5. Visual Support: Displays indicators and trading signals on charts for easy analysis and optimization.
|
||
|
|
|
||
|
|
#### Strategy Risks
|
||
|
|
|
||
|
|
1. False Breakout Risk: May generate frequent false signals in sideways markets.
|
||
|
|
Solution: Consider adding signal confirmation mechanisms, such as requiring signals to persist for a certain period.
|
||
|
|
|
||
|
|
2. Overtrading: Multiple indicators may lead to excessive trading, increasing costs.
|
||
|
|
Solution: Add trading interval restrictions or raise entry thresholds.
|
||
|
|
|
||
|
|
3. Parameter Sensitivity: Multiple indicator parameters need optimization, potentially leading to overfitting.
|
||
|
|
Solution: Conduct rigorous historical data backtesting and forward testing.
|
||
|
|
|
||
|
|
4. Market Environment Dependency: Strategy performance may be inconsistent across different market environments.
|
||
|
|
Solution: Add market environment recognition mechanisms to adjust strategy parameters accordingly.
|
||
|
|
|
||
|
|
5. Limitations of Fixed Stop Loss and Take Profit: May exit favorable trends too early in some cases.
|
||
|
|
Solution: Consider using dynamic stop loss and take profit, such as trailing stops.
|
||
|
|
|
||
|
|
#### Strategy Optimization Directions
|
||
|
|
|
||
|
|
1. Dynamic Parameter Adjustment:
|
||
|
|
- Automatically adjust MACD, RSI, and Bollinger Bands parameters based on market volatility.
|
||
|
|
- Reason: Different market environments require different parameter settings for optimal performance.
|
||
|
|
|
||
|
|
2. Add Market Trend Filter:
|
||
|
|
- Introduce long-term trend judgment, such as a 200-day moving average.
|
||
|
|
- Reason: Can reduce counter-trend trades in strong trend markets, improving win rates.
|
||
|
|
|
||
|
|
3. Optimize Entry Timing:
|
||
|
|
- Add volume confirmation or price action analysis.
|
||
|
|
- Reason: Can reduce false breakouts and improve trade quality.
|
||
|
|
|
||
|
|
4. Improve Risk Management:
|
||
|
|
- Implement dynamic stop loss and take profit, such as ATR-based trailing stops.
|
||
|
|
- Reason: Better adapts to market volatility, protects profits, and reduces unnecessary losses.
|
||
|
|
|
||
|
|
5. Incorporate Sentiment Indicators:
|
||
|
|
- Integrate VIX or other market sentiment indicators.
|
||
|
|
- Reason: Market sentiment significantly affects short-term price movements, can improve prediction accuracy.
|
||
|
|
|
||
|
|
6. Implement Position Sizing:
|
||
|
|
- Dynamically adjust position size based on risk and signal strength.
|
||
|
|
- Reason: Optimizes capital utilization efficiency, increasing returns on high-confidence trades and controlling risk on low-confidence trades.
|
||
|
|
|
||
|
|
#### Conclusion
|
||
|
|
|
||
|
|
This multi-indicator comprehensive trading strategy creates a comprehensive trading system by combining MACD, RSI, and Bollinger Bands, capable of capturing market momentum, identifying overbought/oversold conditions, and utilizing price volatility. The strategy's main advantages lie in its multi-dimensional analysis and built-in risk management mechanisms, allowing it to maintain stability across different market environments. However, the strategy also faces challenges such as false signals, overtrading, and parameter optimization.
|
||
|
|
|
||
|
|
Future optimization directions should focus on dynamic parameter adjustment, market environment recognition, entry timing optimization, and more advanced risk management techniques. Through these improvements, the strategy has the potential to become a more robust and adaptive trading system.
|
||
|
|
|
||
|
|
It is important for traders to remain vigilant in practical application, continuously monitor strategy performance, and make timely adjustments based on market changes. Although this strategy provides a powerful framework, successful trading still requires experience, patience, and continuous learning.
|
||
|
|
[/trans]
|
||
|
|
|
||
|
|
|
||
|
|
|
||
|
|
> Source (PineScript)
|
||
|
|
|
||
|
|
``` pinescript
|
||
|
|
/*backtest
|
||
|
|
start: 2024-06-01 00:00:00
|
||
|
|
end: 2024-06-30 23:59:59
|
||
|
|
period: 1h
|
||
|
|
basePeriod: 15m
|
||
|
|
exchanges: [{"eid":"Futures_Binance","currency":"BTC_USDT"}]
|
||
|
|
*/
|
||
|
|
|
||
|
|
//@version=5
|
||
|
|
strategy("Multi-Indicator Strategy", overlay=true)
|
||
|
|
|
||
|
|
// Input parameters
|
||
|
|
fastLength = input.int(12, title="MACD Fast Length")
|
||
|
|
slowLength = input.int(26, title="MACD Slow Length")
|
||
|
|
MACDLength = input.int(9, title="MACD Signal Length")
|
||
|
|
rsiLength = input.int(14, title="RSI Length")
|
||
|
|
rsiOverbought = input.int(70, title="RSI Overbought Level")
|
||
|
|
rsiOversold = input.int(30, title="RSI Oversold Level")
|
||
|
|
bbLength = input.int(20, title="Bollinger Bands Length")
|
||
|
|
bbMult = input.float(2.0, title="Bollinger Bands Multiplier")
|
||
|
|
|
||
|
|
// MACD calculations
|
||
|
|
MACD = ta.ema(close, fastLength) - ta.ema(close, slowLength)
|
||
|
|
signal = ta.ema(MACD, MACDLength)
|
||
|
|
macdHist = MACD - signal
|
||
|
|
|
||
|
|
// RSI calculation
|
||
|
|
rsi = ta.rsi(close, rsiLength)
|
||
|
|
|
||
|
|
// Bollinger Bands calculation
|
||
|
|
basis = ta.sma(close, bbLength)
|
||
|
|
dev = bbMult * ta.stdev(close, bbLength)
|
||
|
|
upper = basis + dev
|
||
|
|
lower = basis - dev
|
||
|
|
|
||
|
|
// Plotting indicators
|
||
|
|
plot(basis, title="BB Basis", color=color.blue)
|
||
|
|
plot(upper, title="BB Upper", color=color.red)
|
||
|
|
plot(lower, title="BB Lower", color=color.green)
|
||
|
|
// plot(macdHist, title="MACD Histogram", color=color.purple)
|
||
|
|
// plot(rsi, title="RSI", color=color.orange)
|
||
|
|
// hline(50, "RSI Midline", color=color.gray)
|
||
|
|
// hline(rsiOverbought, "RSI Overbought", color=color.red)
|
||
|
|
// hline(rsiOversold, "RSI Oversold", color=color.green)
|
||
|
|
|
||
|
|
// Entry conditions
|
||
|
|
longCondition = (ta.crossover(MACD, signal) or ta.crossunder(rsi, rsiOversold)) and close > lower
|
||
|
|
shortCondition = (ta.crossunder(MACD, signal) or ta.crossover(rsi, rsiOverbought)) and close < upper
|
||
|
|
|
||
|
|
// Stop loss and take profit levels
|
||
|
|
stopLossPercent = 0.02 // 2% stop loss
|
||
|
|
takeProfitPercent = 0.05 // 5% take profit
|
||
|
|
|
||
|
|
// Long position logic
|
||
|
|
if (longCondition)
|
||
|
|
strategy.entry("Long", strategy.long, comment="Long Entry")
|
||
|
|
strategy.exit("Take Profit/Stop Loss", "Long", limit=close * (1 + takeProfitPercent), stop=close * (1 - stopLossPercent))
|
||
|
|
|
||
|
|
// Short position logic
|
||
|
|
if (shortCondition)
|
||
|
|
strategy.entry("Short", strategy.short, comment="Short Entry")
|
||
|
|
strategy.exit("Take Profit/Stop Loss", "Short", limit=close * (1 - takeProfitPercent), stop=close * (1 + stopLossPercent))
|
||
|
|
|
||
|
|
// Debugging: Plot entry signals
|
||
|
|
plotshape(series=longCondition, title="Long Entry Signal", location=location.belowbar, color=color.green, style=shape.labelup, text="Long")
|
||
|
|
plotshape(series=shortCondition, title="Short Entry Signal", location=location.abovebar, color=color.red, style=shape.labeldown, text="Short")
|
||
|
|
|
||
|
|
```
|
||
|
|
|
||
|
|
> Detail
|
||
|
|
|
||
|
|
https://www.fmz.com/strategy/458054
|
||
|
|
|
||
|
|
> Last Modified
|
||
|
|
|
||
|
|
2024-07-29 15:45:39
|