251 lines
17 KiB
Markdown
251 lines
17 KiB
Markdown

|
|
|||
|
|
> Name
|
|||
|
|
|
|||
|
|
多指标交叉动量趋势追踪策略Hull与EMA结合RSI和双重随机震荡器的量化交易系统-Multi-Indicator-Crossover-Momentum-Trend-Following-Strategy-Quantitative-Trading-System-Combining-Hull-with-EMA-RSI-and-Dual-Stochastic-Oscillators
|
|||
|
|
|
|||
|
|
> Author
|
|||
|
|
|
|||
|
|
ianzeng123
|
|||
|
|
|
|||
|
|
> Strategy Description
|
|||
|
|
|
|||
|
|
|
|||
|
|
|
|||
|
|
|
|||
|
|
[trans]
|
|||
|
|
|
|||
|
|
#### 概述
|
|||
|
|
|
|||
|
|
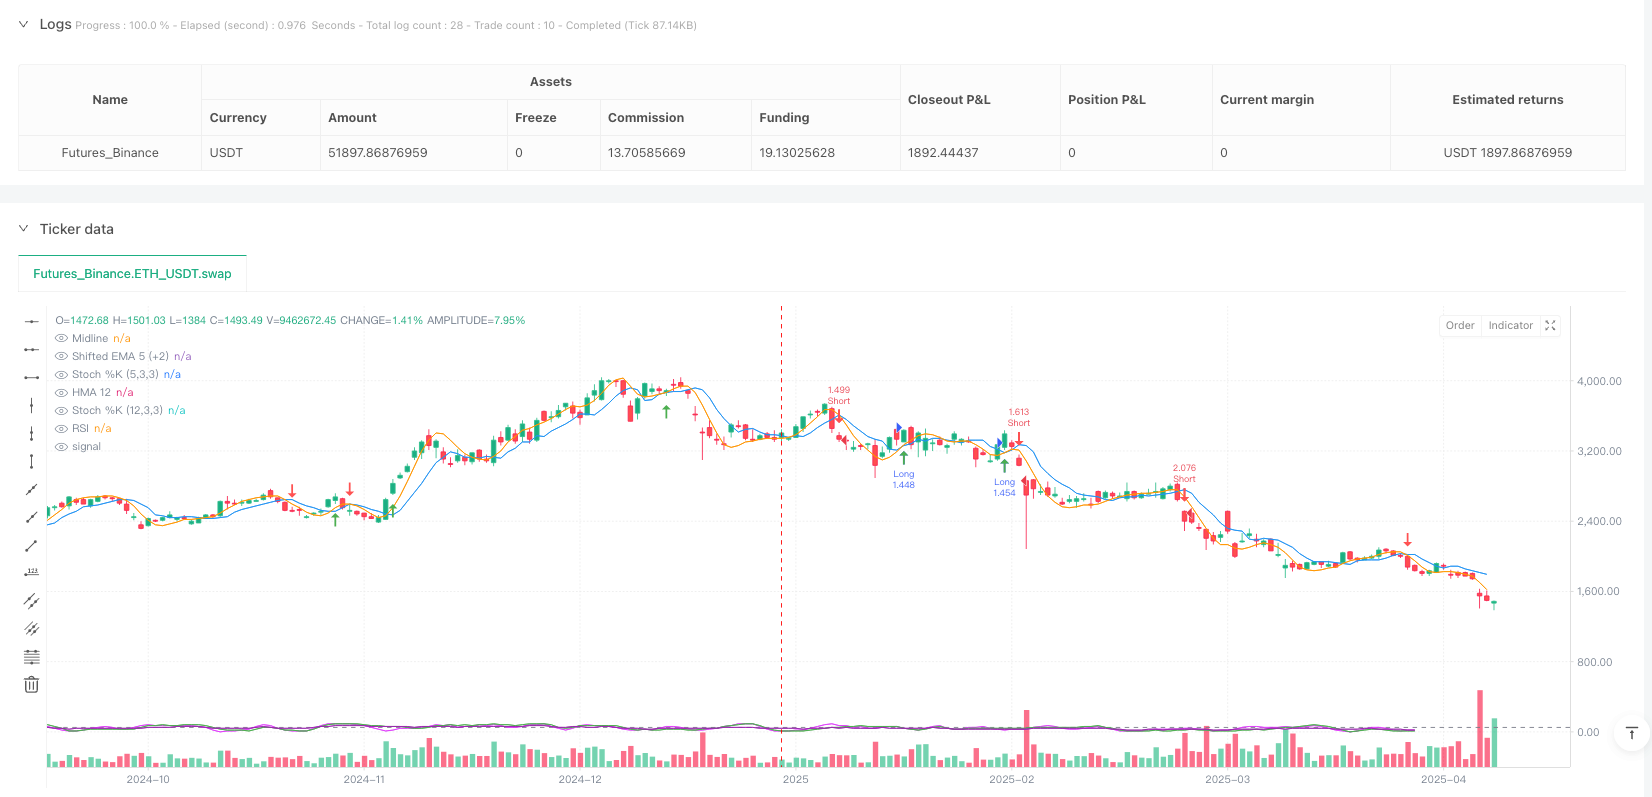
多指标交叉动量趋势追踪策略是一个结合了Hull移动平均线(HMA)和移位指数移动平均线(EMA)的高精度量化交易系统,同时融合了相对强弱指数(RSI)和双重随机震荡器作为动量过滤器。该策略旨在捕捉高概率的趋势突破点,实现精确的入场和出场,同时提供严格的风险管理机制。策略的核心逻辑基于移动平均线交叉信号,并通过多层动量指标确认,以减少虚假突破并提高交易胜率。
|
|||
|
|
|
|||
|
|
#### 策略原理
|
|||
|
|
|
|||
|
|
该策略基于以下几个关键技术组件:
|
|||
|
|
|
|||
|
|
1. **Hull移动平均线(HMA)与移位EMA的交叉**:策略使用12周期的Hull移动平均线和向前移位2根K线的5周期EMA作为主要信号生成机制。HMA被认为比传统移动平均线反应更快,而移位的EMA则具有预测性质,两者结合能更早地捕捉趋势变化。
|
|||
|
|
|
|||
|
|
2. **多层动量过滤**:策略引入了RSI(14)以及两种不同参数设置的随机震荡器(12,3,3和5,3,3)作为确认指标。这种多层过滤机制确保只有在趋势具有足够动量时才会触发交易信号。
|
|||
|
|
|
|||
|
|
3. **精确的入场条件**:
|
|||
|
|
- 多头入场:价格收盘高于HMA和移位EMA,RSI高于50,两个随机震荡器的%K值高于50,并且HMA上穿移位EMA。
|
|||
|
|
- 空头入场:价格收盘低于HMA和移位EMA,RSI低于50,两个随机震荡器的%K值低于50,并且HMA下穿移位EMA。
|
|||
|
|
|
|||
|
|
4. **严格的风险管理**:止损设置在前2根K线的最低点(多头)或最高点(空头),止盈点设置为止损距离的1.65倍,形成有利的风险回报比。
|
|||
|
|
|
|||
|
|
策略的逻辑在于,只有当价格、移动平均线和多个动量指标都确认同一方向时,才能形成高概率的交易信号,从而减少市场噪音的影响。
|
|||
|
|
|
|||
|
|
#### 策略优势
|
|||
|
|
|
|||
|
|
1. **综合多重确认**:通过结合移动平均线交叉和多个动量指标的确认,该策略显著降低了虚假信号的概率,提高了交易的精确性。
|
|||
|
|
|
|||
|
|
2. **快速响应市场变化**:Hull移动平均线的使用使策略能够比传统移动平均线更快地适应价格变动,而移位的EMA增加了预测性元素。
|
|||
|
|
|
|||
|
|
3. **自适应性强**:多指标的组合使策略能够适应不同的市场环境,包括趋势和区间震荡行情。
|
|||
|
|
|
|||
|
|
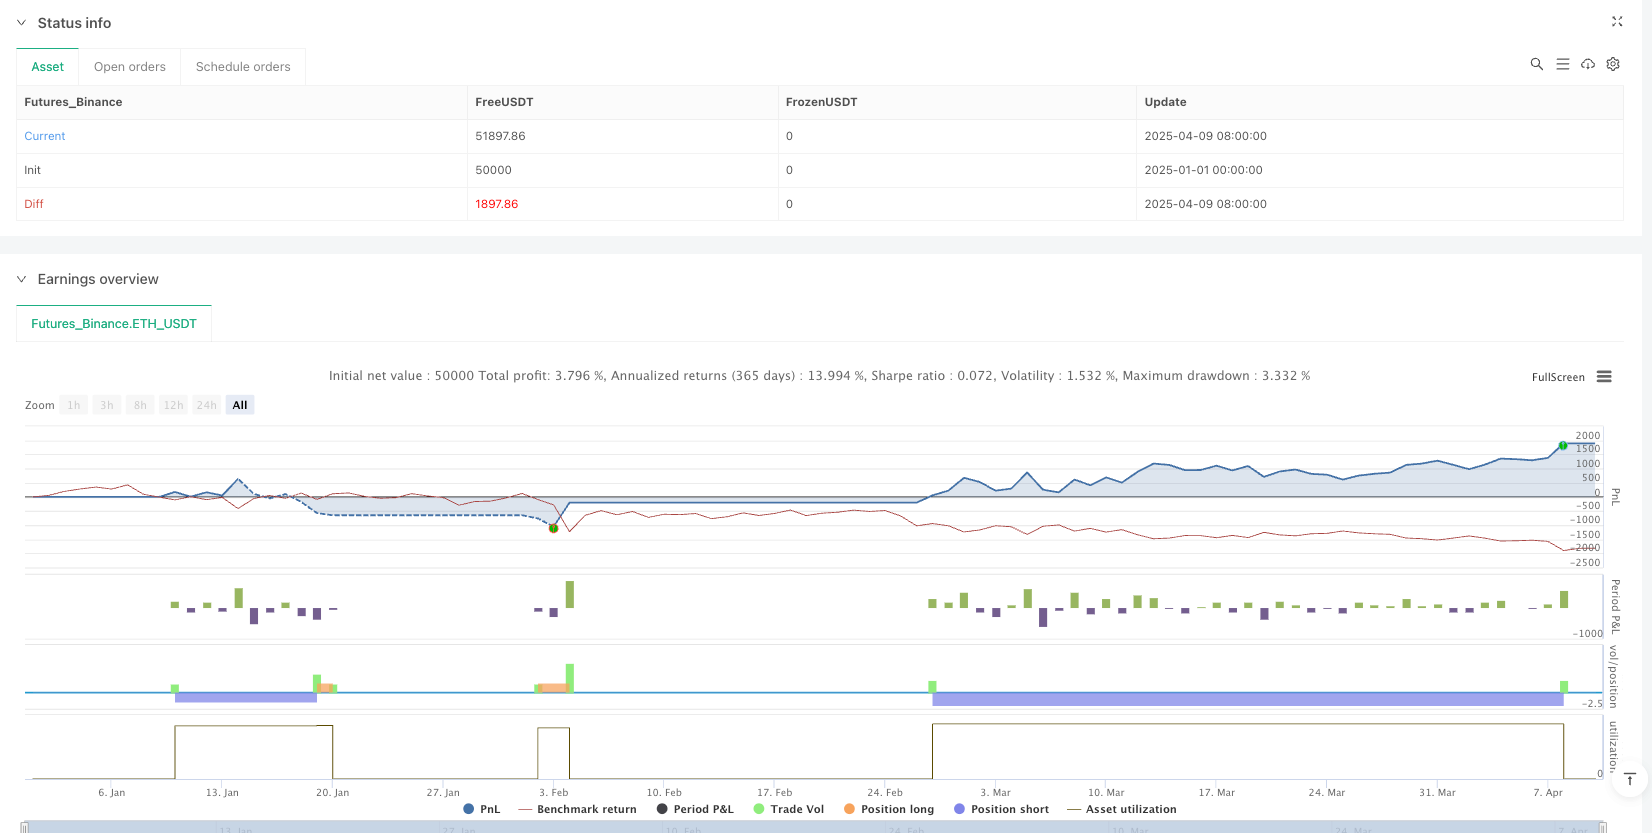
4. **明确的风险管理**:预设的止损和止盈点为每笔交易提供了清晰的风险控制,1.65倍的风险回报比有助于长期盈利。
|
|||
|
|
|
|||
|
|
5. **视觉直观**:策略提供了清晰的买卖信号箭头,并在策略面板中显示RSI和随机震荡器的值,使交易者能够直观地理解和验证交易信号。
|
|||
|
|
|
|||
|
|
6. **佣金考虑**:策略代码中包含了交易佣金的计算,使回测结果更接近实际交易情况。
|
|||
|
|
|
|||
|
|
#### 策略风险
|
|||
|
|
|
|||
|
|
1. **过度优化风险**:多个指标的组合可能导致策略在特定历史数据上过度拟合,面对未来市场可能表现不佳。建议使用更长的回测期间和不同的市场环境进行验证。
|
|||
|
|
|
|||
|
|
2. **滞后性风险**:尽管Hull移动平均线和移位EMA能够减少滞后,但所有技术指标本质上都存在一定延迟,可能导致在快速反转市场中错过重要转折点。
|
|||
|
|
|
|||
|
|
3. **参数敏感性**:策略使用多个固定参数(如HMA的12周期,EMA的5周期等),这些参数的选择可能对不同市场和时间框架下的性能产生显著影响。建议进行参数敏感性分析。
|
|||
|
|
|
|||
|
|
4. **市场条件依赖**:该策略在明确趋势市场中表现可能较好,但在横盘震荡市场可能产生更多虚假信号。交易者需要根据当前市场环境调整使用策略的决策。
|
|||
|
|
|
|||
|
|
5. **止损触发风险**:使用前2根K线的极值作为止损可能在高波动性市场中导致止损点过宽,增加了单笔交易的风险敞口。
|
|||
|
|
|
|||
|
|
解决方法包括:使用自适应参数根据市场波动性调整,增加市场环境过滤器以避免在不适合的市场条件下交易,以及考虑实现动态止损机制。
|
|||
|
|
|
|||
|
|
#### 策略优化方向
|
|||
|
|
|
|||
|
|
1. **适应性参数调整**:可以引入自适应机制,根据市场波动性自动调整HMA和EMA的周期。例如,在低波动性市场可以使用较短周期,在高波动性市场使用较长周期,以适应不同市场条件。
|
|||
|
|
|
|||
|
|
2. **市场环境过滤**:增加市场环境的判断逻辑,例如使用ATR(真实波动幅度)或波动率指标来识别市场状态,只在适合策略的市场环境中交易。
|
|||
|
|
|
|||
|
|
3. **动态风险管理**:将固定的1.65倍风险回报比改为根据市场波动性动态调整的机制,例如在低波动市场使用更高的风险回报比,在高波动市场使用更保守的设置。
|
|||
|
|
|
|||
|
|
4. **增加趋势强度过滤**:引入ADX(平均方向指数)等趋势强度指标,只在趋势足够强时交易,避免在弱趋势或震荡市场中频繁交易。
|
|||
|
|
|
|||
|
|
5. **时间过滤器**:添加时间过滤功能,避开重要经济数据发布或流动性较低的时段,减少因市场不规律波动导致的虚假信号。
|
|||
|
|
|
|||
|
|
6. **部分仓位管理**:实现分批进出场机制,而不是一次性全部进出,可以降低时机选择的风险,并优化整体风险回报表现。
|
|||
|
|
|
|||
|
|
7. **机器学习增强**:考虑使用简单的机器学习算法来优化参数选择或增加预测能力,例如使用回归模型预测最佳参数组合。
|
|||
|
|
|
|||
|
|
这些优化方向的核心目标是提高策略的适应性和稳健性,减少对特定参数和市场条件的依赖,从而创建一个在不同市场环境中都能保持稳定表现的交易系统。
|
|||
|
|
|
|||
|
|
#### 总结
|
|||
|
|
|
|||
|
|
多指标交叉动量趋势追踪策略是一个设计精良的量化交易系统,通过结合Hull移动平均线、移位EMA以及多层动量指标,实现了高效的趋势捕捉和严格的风险管理。策略的主要优势在于多重确认机制减少了虚假信号,而清晰的风险管理规则提供了一致的交易框架。
|
|||
|
|
|
|||
|
|
然而,所有交易策略都面临固有的挑战,如参数优化和市场适应性问题。通过引入自适应参数、市场环境过滤和动态风险管理等优化措施,可以进一步提高策略的稳健性和长期表现。
|
|||
|
|
|
|||
|
|
最终,该策略为趋势追踪交易者提供了一个技术指标充分、逻辑清晰的交易系统基础。通过理解其原理并针对特定交易需求进行适当调整,交易者可以将其发展成为一个个性化的、高效的交易工具。成功的量化交易不仅依赖于策略的技术设计,还需要严格的执行纪律和持续的优化改进。 ||
|
|||
|
|
|
|||
|
|
#### Overview
|
|||
|
|
|
|||
|
|
The Multi-Indicator Crossover Momentum Trend-Following Strategy is a high-precision quantitative trading system that combines the Hull Moving Average (HMA) with a shifted Exponential Moving Average (EMA), integrated with the Relative Strength Index (RSI) and dual Stochastic Oscillators as momentum filters. This strategy aims to capture high-probability trend breakouts, achieve precise entries and exits, while providing strict risk management mechanisms. The core logic is based on moving average crossover signals, confirmed by multiple momentum indicators to reduce false breakouts and improve trading win rates.
|
|||
|
|
|
|||
|
|
#### Strategy Principles
|
|||
|
|
|
|||
|
|
This strategy is built on several key technical components:
|
|||
|
|
|
|||
|
|
1. **Hull Moving Average (HMA) and Shifted EMA Crossover**: The strategy uses a 12-period Hull Moving Average and a 5-period EMA shifted forward by 2 bars as the primary signal generation mechanism. HMA is known to react faster than traditional moving averages, while the shifted EMA adds a predictive quality, allowing earlier detection of trend changes.
|
|||
|
|
|
|||
|
|
2. **Multi-layer Momentum Filtering**: The strategy incorporates RSI(14) and two Stochastic Oscillators with different parameter settings (12,3,3 and 5,3,3) as confirmation indicators. This multi-layer filtering mechanism ensures that trade signals are triggered only when the trend has sufficient momentum.
|
|||
|
|
|
|||
|
|
3. **Precise Entry Conditions**:
|
|||
|
|
- Long Entry: Price closes above both HMA and shifted EMA, RSI is above 50, both Stochastic Oscillators' %K values are above 50, and HMA crosses above the shifted EMA.
|
|||
|
|
- Short Entry: Price closes below both HMA and shifted EMA, RSI is below 50, both Stochastic Oscillators' %K values are below 50, and HMA crosses below the shifted EMA.
|
|||
|
|
|
|||
|
|
4. **Strict Risk Management**: Stop-loss is set at the lowest point (for longs) or highest point (for shorts) of the previous 2 candles, with take-profit set at 1.65 times the stop-loss distance, creating a favorable risk-reward ratio.
|
|||
|
|
|
|||
|
|
The logic behind the strategy is that high-probability trading signals form only when price, moving averages, and multiple momentum indicators all confirm the same direction, thus reducing the impact of market noise.
|
|||
|
|
|
|||
|
|
#### Strategy Advantages
|
|||
|
|
|
|||
|
|
1. **Comprehensive Multi-Confirmation**: By combining moving average crossovers with confirmation from multiple momentum indicators, the strategy significantly reduces the probability of false signals, improving trading precision.
|
|||
|
|
|
|||
|
|
2. **Quick Response to Market Changes**: The use of Hull Moving Average allows the strategy to adapt to price movements faster than traditional moving averages, while the shifted EMA adds a predictive element.
|
|||
|
|
|
|||
|
|
3. **Strong Adaptability**: The combination of multiple indicators enables the strategy to adapt to different market environments, including trending and range-bound conditions.
|
|||
|
|
|
|||
|
|
4. **Clear Risk Management**: Predefined stop-loss and take-profit levels provide clear risk control for each trade, with the 1.65 risk-reward ratio supporting long-term profitability.
|
|||
|
|
|
|||
|
|
5. **Visual Intuitiveness**: The strategy provides clear buy and sell signal arrows and displays RSI and Stochastic Oscillator values in the strategy panel, allowing traders to visually understand and verify trading signals.
|
|||
|
|
|
|||
|
|
6. **Commission Consideration**: The strategy code includes commission calculations, making backtesting results closer to actual trading conditions.
|
|||
|
|
|
|||
|
|
#### Strategy Risks
|
|||
|
|
|
|||
|
|
1. **Over-Optimization Risk**: The combination of multiple indicators may lead to overfitting on specific historical data, potentially performing poorly in future markets. It is recommended to validate with longer backtesting periods and different market environments.
|
|||
|
|
|
|||
|
|
2. **Lag Risk**: Despite the reduced lag from Hull Moving Average and shifted EMA, all technical indicators inherently have some delay, which may cause missed crucial turning points in rapidly reversing markets.
|
|||
|
|
|
|||
|
|
3. **Parameter Sensitivity**: The strategy uses multiple fixed parameters (such as HMA's 12-period, EMA's 5-period), which may significantly impact performance across different markets and timeframes. Parameter sensitivity analysis is recommended.
|
|||
|
|
|
|||
|
|
4. **Market Condition Dependency**: This strategy may perform better in clear trending markets but might generate more false signals in sideways, consolidating markets. Traders need to adjust their use of the strategy based on current market conditions.
|
|||
|
|
|
|||
|
|
5. **Stop-Loss Trigger Risk**: Using the extremes of the previous 2 candles as stop-loss points might lead to overly wide stops in highly volatile markets, increasing risk exposure per trade.
|
|||
|
|
|
|||
|
|
Solutions include: using adaptive parameters based on market volatility, adding market environment filters to avoid trading in unsuitable market conditions, and considering dynamic stop-loss mechanisms.
|
|||
|
|
|
|||
|
|
#### Strategy Optimization Directions
|
|||
|
|
|
|||
|
|
1. **Adaptive Parameter Adjustment**: Introduce adaptive mechanisms to automatically adjust HMA and EMA periods based on market volatility. For example, use shorter periods in low-volatility markets and longer periods in high-volatility markets to adapt to different market conditions.
|
|||
|
|
|
|||
|
|
2. **Market Environment Filtering**: Add market environment assessment logic, such as using ATR (Average True Range) or volatility indicators to identify market states and only trade in environments suitable for the strategy.
|
|||
|
|
|
|||
|
|
3. **Dynamic Risk Management**: Replace the fixed 1.65 risk-reward ratio with a mechanism that dynamically adjusts based on market volatility, such as using higher risk-reward ratios in low-volatility markets and more conservative settings in high-volatility markets.
|
|||
|
|
|
|||
|
|
4. **Add Trend Strength Filtering**: Introduce trend strength indicators like ADX (Average Directional Index) and only trade when the trend is strong enough, avoiding frequent trading in weak trend or range-bound markets.
|
|||
|
|
|
|||
|
|
5. **Time Filters**: Add time filtering functionality to avoid important economic data release periods or low-liquidity sessions, reducing false signals caused by irregular market movements.
|
|||
|
|
|
|||
|
|
6. **Partial Position Management**: Implement a mechanism for scaling in and out of positions rather than entering and exiting all at once, which can reduce timing risk and optimize overall risk-reward performance.
|
|||
|
|
|
|||
|
|
7. **Machine Learning Enhancement**: Consider using simple machine learning algorithms to optimize parameter selection or enhance predictive capabilities, such as using regression models to predict optimal parameter combinations.
|
|||
|
|
|
|||
|
|
The core objective of these optimization directions is to improve the strategy's adaptability and robustness, reducing dependence on specific parameters and market conditions, thereby creating a trading system that maintains stable performance across different market environments.
|
|||
|
|
|
|||
|
|
#### Summary
|
|||
|
|
|
|||
|
|
The Multi-Indicator Crossover Momentum Trend-Following Strategy is a well-designed quantitative trading system that achieves efficient trend capture and strict risk management through the combination of Hull Moving Average, shifted EMA, and multi-layer momentum indicators. The strategy's main advantages lie in its multiple confirmation mechanisms that reduce false signals, while clear risk management rules provide a consistent trading framework.
|
|||
|
|
|
|||
|
|
However, like all trading strategies, it faces inherent challenges such as parameter optimization and market adaptability issues. By introducing adaptive parameters, market environment filtering, and dynamic risk management optimizations, the strategy's robustness and long-term performance can be further enhanced.
|
|||
|
|
|
|||
|
|
Ultimately, this strategy provides trend-following traders with a trading system foundation that is technically comprehensive and logically clear. By understanding its principles and making appropriate adjustments for specific trading needs, traders can develop it into a personalized, efficient trading tool. Successful quantitative trading depends not only on the technical design of the strategy but also on strict execution discipline and continuous optimization improvements.[/trans]
|
|||
|
|
|
|||
|
|
|
|||
|
|
|
|||
|
|
> Source (PineScript)
|
|||
|
|
|
|||
|
|
``` pinescript
|
|||
|
|
/*backtest
|
|||
|
|
start: 2025-01-01 00:00:00
|
|||
|
|
end: 2025-04-10 00:00:00
|
|||
|
|
period: 1d
|
|||
|
|
basePeriod: 1d
|
|||
|
|
exchanges: [{"eid":"Futures_Binance","currency":"ETH_USDT"}]
|
|||
|
|
*/
|
|||
|
|
|
|||
|
|
//@version=5
|
|||
|
|
strategy("TrendTwisterV1.5 (Forex Ready + Indicators)", overlay=true, default_qty_type=strategy.percent_of_equity, default_qty_value=10, commission_type=strategy.commission.percent, commission_value=0.01)
|
|||
|
|
|
|||
|
|
// === Parameters ===
|
|||
|
|
hmaLength = 12
|
|||
|
|
emaLength = 5
|
|||
|
|
rsiLength = 14
|
|||
|
|
profitFactor = 1.65
|
|||
|
|
|
|||
|
|
// === Indicators ===
|
|||
|
|
hma = ta.hma(close, hmaLength)
|
|||
|
|
ema = ta.ema(close, emaLength)
|
|||
|
|
emaShifted = ema[2]
|
|||
|
|
rsi = ta.rsi(close, rsiLength)
|
|||
|
|
|
|||
|
|
// === Stochastic Oscillators ===
|
|||
|
|
k1 = ta.stoch(close, high, low, 12)
|
|||
|
|
k1Smooth = ta.sma(k1, 3)
|
|||
|
|
|
|||
|
|
k2 = ta.stoch(close, high, low, 5)
|
|||
|
|
k2Smooth = ta.sma(k2, 3)
|
|||
|
|
|
|||
|
|
// === Plots: Main Strategy Indicators ===
|
|||
|
|
plot(hma, color=color.orange, title="HMA 12")
|
|||
|
|
plot(emaShifted, color=color.blue, title="Shifted EMA 5 (+2)")
|
|||
|
|
|
|||
|
|
// === Stop Loss & Take Profit ===
|
|||
|
|
longStop = ta.lowest(low[1], 2)
|
|||
|
|
shortStop = ta.highest(high[1], 2)
|
|||
|
|
|
|||
|
|
longSL_pips = close - longStop
|
|||
|
|
shortSL_pips = shortStop - close
|
|||
|
|
|
|||
|
|
pip = syminfo.mintick
|
|||
|
|
longTP = close + (longSL_pips * profitFactor)
|
|||
|
|
shortTP = close - (shortSL_pips * profitFactor)
|
|||
|
|
|
|||
|
|
// === Crossover Conditions ===
|
|||
|
|
hmaCrossesAbove = ta.crossover(hma, emaShifted)
|
|||
|
|
hmaCrossesBelow = ta.crossunder(hma, emaShifted)
|
|||
|
|
|
|||
|
|
// === Entry Conditions ===
|
|||
|
|
longCondition = close > hma and close > emaShifted and rsi > 50 and k1Smooth > 50 and k2Smooth > 50 and hmaCrossesAbove
|
|||
|
|
shortCondition = close < hma and close < emaShifted and rsi < 50 and k1Smooth < 50 and k2Smooth < 50 and hmaCrossesBelow
|
|||
|
|
|
|||
|
|
// === Entries & Exits ===
|
|||
|
|
if (longCondition)
|
|||
|
|
strategy.entry("Long", strategy.long)
|
|||
|
|
strategy.exit("Long Exit", from_entry="Long", stop=longStop, limit=longTP)
|
|||
|
|
|
|||
|
|
if (shortCondition)
|
|||
|
|
strategy.entry("Short", strategy.short)
|
|||
|
|
strategy.exit("Short Exit", from_entry="Short", stop=shortStop, limit=shortTP)
|
|||
|
|
|
|||
|
|
// === Signal Arrows ===
|
|||
|
|
plotshape(longCondition, title="Buy Signal", location=location.belowbar, color=color.green, style=shape.arrowup, size=size.small)
|
|||
|
|
plotshape(shortCondition, title="Sell Signal", location=location.abovebar, color=color.red, style=shape.arrowdown, size=size.small)
|
|||
|
|
|
|||
|
|
// === Overlay RSI + Stochs in strategy panel ===
|
|||
|
|
rsiPlot = plot(rsi, title="RSI", color=color.purple, linewidth=1, offset=-10)
|
|||
|
|
k1Plot = plot(k1Smooth, title="Stoch %K (12,3,3)", color=color.green, linewidth=1, offset=-10)
|
|||
|
|
k2Plot = plot(k2Smooth, title="Stoch %K (5,3,3)", color=color.fuchsia, linewidth=1, offset=-10)
|
|||
|
|
hline(50, "Midline", color=color.gray, linestyle=hline.style_dashed)
|
|||
|
|
|
|||
|
|
```
|
|||
|
|
|
|||
|
|
> Detail
|
|||
|
|
|
|||
|
|
https://www.fmz.com/strategy/490060
|
|||
|
|
|
|||
|
|
> Last Modified
|
|||
|
|
|
|||
|
|
2025-04-11 11:13:55
|