198 lines
15 KiB
Markdown
198 lines
15 KiB
Markdown

|
|
||
|
|
> Name
|
||
|
|
|
||
|
|
多指标交叉动量交易策略EMA趋势与RSI超买超卖结合突破交易系统-Multi-Indicator-Cross-Momentum-Trading-Strategy-EMA-Trend-with-RSI-Overbought-Oversold-Breakout-System
|
||
|
|
|
||
|
|
> Author
|
||
|
|
|
||
|
|
ianzeng123
|
||
|
|
|
||
|
|
> Strategy Description
|
||
|
|
|
||
|
|
|
||
|
|
|
||
|
|
|
||
|
|
|
||
|
|
[trans]
|
||
|
|
#### 概述
|
||
|
|
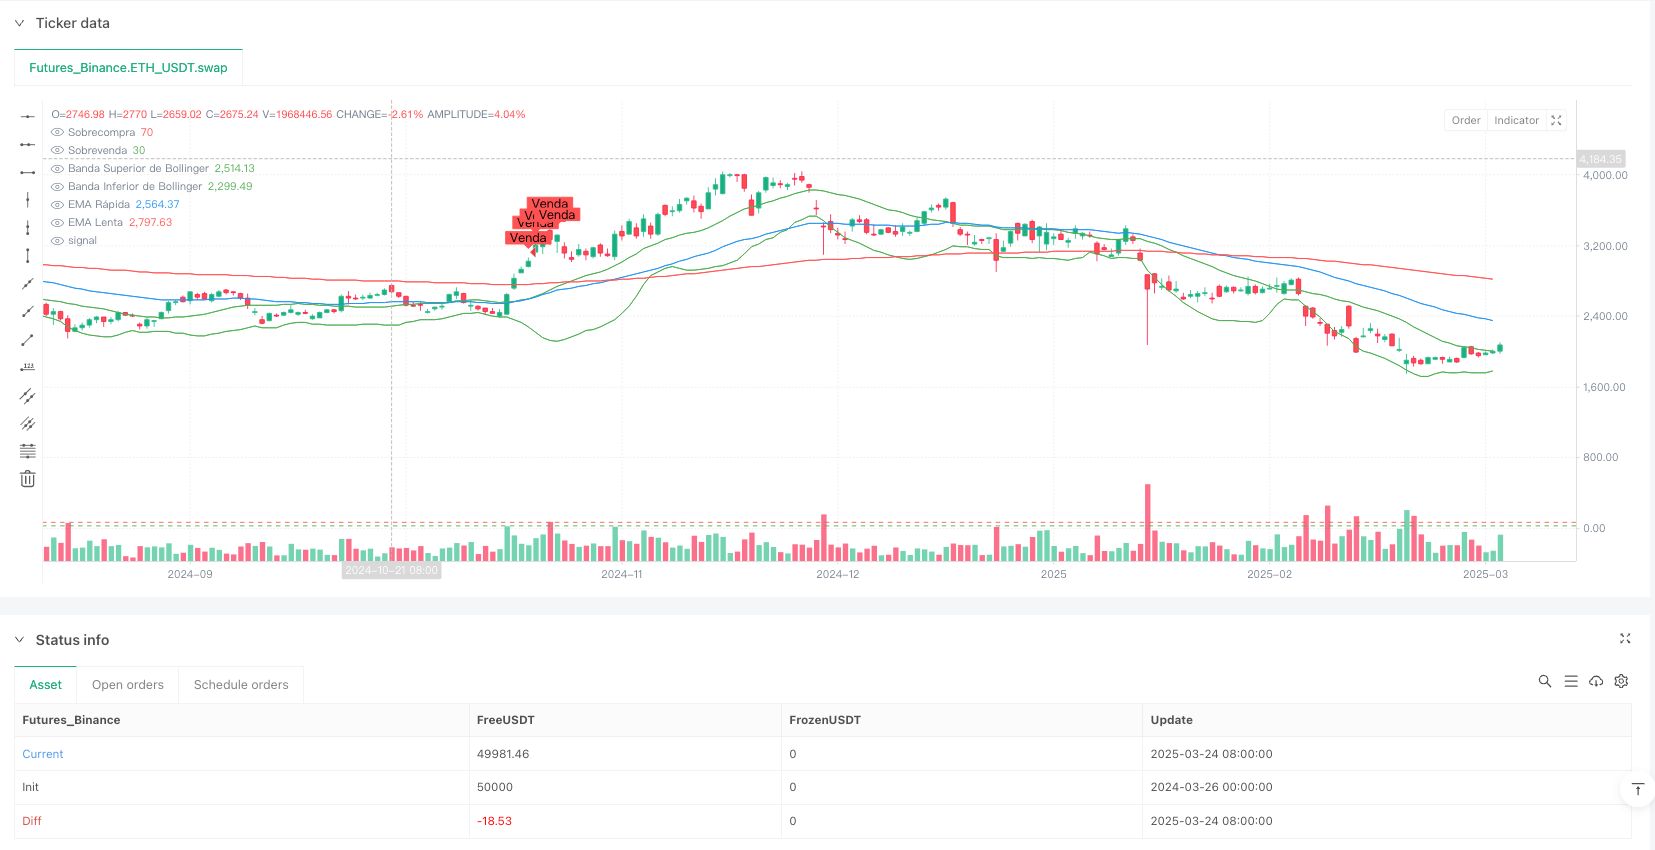
这是一个结合了多重技术指标的量化交易策略,主要利用指数移动平均线(EMA)、相对强弱指数(RSI)和布林带(Bollinger Bands)三大指标来捕捉市场趋势和突破机会。该策略核心思想是在EMA趋势确认的基础上,结合RSI的超买超卖信号和布林带的价格波动区间,在价格触及布林带边界且RSI达到极值时进行交易。同时,策略内置了止盈止损机制以控制风险和锁定利润。
|
||
|
|
|
||
|
|
#### 策略原理
|
||
|
|
1. **趋势确认**:通过比较快速EMA(50周期)和慢速EMA(200周期)的相对位置来确认市场趋势方向。当快速EMA在慢速EMA上方时,确认为上升趋势;反之为下降趋势。
|
||
|
|
|
||
|
|
2. **入场信号**:
|
||
|
|
- **买入条件**:当且仅当(1)快速EMA位于慢速EMA之上(上升趋势),(2)价格触及或低于布林带下轨,(3)RSI低于超卖水平(默认30)时,策略发出买入信号。
|
||
|
|
- **卖出条件**:当且仅当(1)快速EMA位于慢速EMA之下(下降趋势),(2)价格触及或高于布林带上轨,(3)RSI高于超买水平(默认70)时,策略发出卖出信号。
|
||
|
|
|
||
|
|
3. **风险管理**:策略在每笔交易中设置固定的止盈点(默认50个点)和止损点(默认20个点),使用syminfo.mintick进行价格精度调整。
|
||
|
|
|
||
|
|
4. **仓位管理**:通过可调整的lotSize参数(默认0.1)来控制每笔交易的资金量。
|
||
|
|
|
||
|
|
#### 策略优势
|
||
|
|
1. **多指标协同确认**:该策略结合了趋势指标(EMA)、动量指标(RSI)和波动率指标(布林带),多层面确认信号,降低了假突破的风险。
|
||
|
|
|
||
|
|
2. **逆势交易与趋势确认的结合**:策略在大趋势确认的基础上,寻找短期逆势修正的机会,既尊重长期趋势,又能在价格回调时入场,提高了入场点的质量。
|
||
|
|
|
||
|
|
3. **风险收益比合理**:默认设置下,策略的风险收益比为1:2.5(止损20点:止盈50点),符合良好的风险管理原则。
|
||
|
|
|
||
|
|
4. **参数可调性强**:策略提供了多个可调参数,包括EMA周期、RSI阈值、止盈止损点数等,使用者可以根据不同市场环境和个人风险偏好进行调整。
|
||
|
|
|
||
|
|
5. **视觉化交易信号**:策略通过图表上的形状标记直观地展示买卖信号,方便交易者进行分析和复盘。
|
||
|
|
|
||
|
|
#### 策略风险
|
||
|
|
1. **趋势反转风险**:依赖EMA判断趋势可能在市场剧烈波动时出现滞后,导致错失趋势反转初期的机会或产生错误信号。解决方法是引入更敏感的趋势指标如MACD或增加突破确认机制。
|
||
|
|
|
||
|
|
2. **参数敏感性**:策略的表现高度依赖于参数设置,不同的市场环境可能需要不同的参数组合。建议通过回测在不同市场条件下寻找最优参数组合。
|
||
|
|
|
||
|
|
3. **假突破风险**:虽然策略使用了多指标确认,但在高波动市场中仍可能出现假突破。可以通过增加成交量确认或等待反弹再入场等方式降低风险。
|
||
|
|
|
||
|
|
4. **固定止盈止损的局限性**:固定点数的止盈止损可能不适应不同市场波动率,在高波动期可能过小,低波动期可能过大。考虑使用ATR动态调整止盈止损点位。
|
||
|
|
|
||
|
|
5. **缺乏成交量分析**:当前策略未考虑成交量因素,可能导致在低流动性环境中产生错误信号。建议引入成交量指标增强策略可靠性。
|
||
|
|
|
||
|
|
#### 策略优化方向
|
||
|
|
1. **动态止盈止损**:将固定点数的止盈止损替换为基于ATR(真实波动幅度)的动态止盈止损,更好地适应市场波动性变化。例如:stopLoss = atrValue * 1.5,takeProfit = atrValue * 3。
|
||
|
|
|
||
|
|
2. **增加过滤条件**:引入成交量指标或其他市场结构指标(如价格形态、支撑阻力)作为额外过滤条件,提高信号质量。
|
||
|
|
|
||
|
|
3. **优化参数自适应**:实现参数的动态调整机制,根据市场波动性自动调整EMA周期、RSI阈值等参数,提高策略在不同市场环境下的适应性。
|
||
|
|
|
||
|
|
4. **增加时间过滤**:加入时间过滤功能,避免在重大经济数据发布或低流动性时段交易,减少滑点和异常波动带来的风险。
|
||
|
|
|
||
|
|
5. **部分仓位管理**:引入分批入场和分批止盈机制,而不是一次性全部入场或出场,提高资金利用效率和风险分散度。
|
||
|
|
|
||
|
|
6. **引入趋势强度指标**:增加ADX(平均方向指数)等趋势强度指标,仅在趋势强度达到一定程度时才执行交易,避免在震荡市场中频繁交易。
|
||
|
|
|
||
|
|
#### 总结
|
||
|
|
该多指标交叉动量交易策略通过结合EMA趋势判断、RSI超买超卖信号和布林带价格通道,构建了一个相对完整的交易系统。策略的核心优势在于多指标协同确认信号,在尊重长期趋势的同时捕捉短期逆势修正机会,并通过内置的止盈止损机制控制风险。
|
||
|
|
|
||
|
|
然而,策略也存在参数敏感度高、可能受到假突破影响等风险。通过引入动态止盈止损、增加过滤条件、优化参数自适应性等方向的改进,可以进一步提高策略的稳健性和适应性。
|
||
|
|
|
||
|
|
对于偏好技术分析和量化交易的投资者来说,该策略提供了一个良好的基础框架,可以根据个人交易风格和市场环境进行定制和优化,以达到更好的交易结果。
|
||
|
|
||
|
||
|
|
#### Overview
|
||
|
|
This is a quantitative trading strategy that combines multiple technical indicators, primarily utilizing Exponential Moving Average (EMA), Relative Strength Index (RSI), and Bollinger Bands (BB) to capture market trends and breakout opportunities. The core idea of this strategy is to confirm trends using EMA crossovers, combined with RSI overbought/oversold signals and Bollinger Bands price ranges, to execute trades when prices touch the Bollinger Band boundaries and RSI reaches extreme values. Additionally, the strategy incorporates built-in take-profit and stop-loss mechanisms to control risk and lock in profits.
|
||
|
|
|
||
|
|
#### Strategy Principles
|
||
|
|
1. **Trend Confirmation**: The market trend direction is confirmed by comparing the relative positions of the fast EMA (50-period) and slow EMA (200-period). When the fast EMA is above the slow EMA, an uptrend is confirmed; otherwise, a downtrend is confirmed.
|
||
|
|
|
||
|
|
2. **Entry Signals**:
|
||
|
|
- **Buy Condition**: A buy signal is generated only when (1) the fast EMA is above the slow EMA (uptrend), (2) the price touches or falls below the lower Bollinger Band, and (3) the RSI is below the oversold level (default 30).
|
||
|
|
- **Sell Condition**: A sell signal is generated only when (1) the fast EMA is below the slow EMA (downtrend), (2) the price touches or rises above the upper Bollinger Band, and (3) the RSI is above the overbought level (default 70).
|
||
|
|
|
||
|
|
3. **Risk Management**: The strategy sets fixed take-profit points (default 50 points) and stop-loss points (default 20 points) for each trade, using syminfo.mintick for price precision adjustments.
|
||
|
|
|
||
|
|
4. **Position Sizing**: The amount of capital allocated to each trade is controlled through the adjustable lotSize parameter (default 0.1).
|
||
|
|
|
||
|
|
#### Strategy Advantages
|
||
|
|
1. **Multi-Indicator Confirmation**: This strategy combines trend indicators (EMA), momentum indicators (RSI), and volatility indicators (Bollinger Bands) to confirm signals from multiple perspectives, reducing the risk of false breakouts.
|
||
|
|
|
||
|
|
2. **Combination of Counter-Trend and Trend Confirmation**: The strategy seeks short-term corrective opportunities against the background of a confirmed long-term trend, respecting the long-term trend while entering at price retracements, improving entry point quality.
|
||
|
|
|
||
|
|
3. **Reasonable Risk-Reward Ratio**: Under default settings, the strategy has a risk-reward ratio of 1:2.5 (20-point stop-loss : 50-point take-profit), aligning with sound risk management principles.
|
||
|
|
|
||
|
|
4. **Strong Parameter Adjustability**: The strategy offers multiple adjustable parameters, including EMA periods, RSI thresholds, and take-profit/stop-loss points, allowing users to customize based on different market environments and personal risk preferences.
|
||
|
|
|
||
|
|
5. **Visual Trading Signals**: The strategy intuitively displays buy and sell signals through shape markers on the chart, facilitating analysis and review by traders.
|
||
|
|
|
||
|
|
#### Strategy Risks
|
||
|
|
1. **Trend Reversal Risk**: Relying on EMA for trend determination may lead to lag during extreme market volatility, causing missed opportunities at the beginning of trend reversals or generating false signals. This can be addressed by introducing more sensitive trend indicators like MACD or adding breakout confirmation mechanisms.
|
||
|
|
|
||
|
|
2. **Parameter Sensitivity**: The strategy's performance is highly dependent on parameter settings, with different market environments potentially requiring different parameter combinations. It's recommended to conduct backtesting to find optimal parameter combinations under various market conditions.
|
||
|
|
|
||
|
|
3. **False Breakout Risk**: Despite using multiple indicators for confirmation, false breakouts may still occur in highly volatile markets. This risk can be reduced by adding volume confirmation or waiting for a rebound before entering.
|
||
|
|
|
||
|
|
4. **Limitations of Fixed Take-Profit and Stop-Loss**: Fixed-point take-profit and stop-loss may not adapt to different market volatilities, potentially being too small during high volatility periods and too large during low volatility periods. Consider using ATR to dynamically adjust take-profit and stop-loss levels.
|
||
|
|
|
||
|
|
5. **Lack of Volume Analysis**: The current strategy does not consider volume factors, which may lead to false signals in low-liquidity environments. It's advisable to introduce volume indicators to enhance strategy reliability.
|
||
|
|
|
||
|
|
#### Strategy Optimization Directions
|
||
|
|
1. **Dynamic Take-Profit and Stop-Loss**: Replace fixed-point take-profit and stop-loss with ATR-based (Average True Range) dynamic levels to better adapt to changing market volatility. For example: stopLoss = atrValue * 1.5, takeProfit = atrValue * 3.
|
||
|
|
|
||
|
|
2. **Add Filtering Conditions**: Introduce volume indicators or other market structure indicators (such as price patterns, support/resistance) as additional filtering conditions to improve signal quality.
|
||
|
|
|
||
|
|
3. **Optimize Parameter Adaptability**: Implement a dynamic parameter adjustment mechanism that automatically adjusts EMA periods, RSI thresholds, and other parameters based on market volatility, improving the strategy's adaptability across different market environments.
|
||
|
|
|
||
|
|
4. **Add Time Filters**: Incorporate time filtering functionality to avoid trading during major economic data releases or low-liquidity sessions, reducing risks from slippage and abnormal price movements.
|
||
|
|
|
||
|
|
5. **Partial Position Management**: Introduce phased entry and partial profit-taking mechanisms, rather than entering or exiting all at once, improving capital utilization efficiency and risk diversification.
|
||
|
|
|
||
|
|
6. **Introduce Trend Strength Indicators**: Add trend strength indicators such as ADX (Average Directional Index), executing trades only when trend strength reaches a certain level, avoiding frequent trading in ranging markets.
|
||
|
|
|
||
|
|
#### Conclusion
|
||
|
|
This Multi-Indicator Cross Momentum Trading Strategy constructs a relatively complete trading system by combining EMA trend determination, RSI overbought/oversold signals, and Bollinger Bands price channels. The core advantage of the strategy lies in its multi-indicator collaborative signal confirmation, capturing short-term counter-trend opportunities while respecting long-term trends, and controlling risk through built-in take-profit and stop-loss mechanisms.
|
||
|
|
|
||
|
|
However, the strategy also faces risks such as high parameter sensitivity and potential false breakouts. By introducing dynamic take-profit and stop-loss, adding filtering conditions, optimizing parameter adaptability, and other improvements, the strategy's robustness and adaptability can be further enhanced.
|
||
|
|
|
||
|
|
For investors who prefer technical analysis and quantitative trading, this strategy provides a solid foundation framework that can be customized and optimized according to individual trading styles and market conditions to achieve better trading results.
|
||
|
|
[/trans]
|
||
|
|
|
||
|
|
|
||
|
|
|
||
|
|
> Source (PineScript)
|
||
|
|
|
||
|
|
``` pinescript
|
||
|
|
/*backtest
|
||
|
|
start: 2024-03-26 00:00:00
|
||
|
|
end: 2025-03-25 00:00:00
|
||
|
|
period: 1d
|
||
|
|
basePeriod: 1d
|
||
|
|
exchanges: [{"eid":"Futures_Binance","currency":"ETH_USDT"}]
|
||
|
|
*/
|
||
|
|
|
||
|
|
//@version=5
|
||
|
|
strategy("XAUUSD Strategy with TP and SL", overlay=true)
|
||
|
|
|
||
|
|
// Parâmetros ajustáveis
|
||
|
|
lotSize = input.float(0.1, title="Tamanho do Lote", minval=0.01)
|
||
|
|
takeProfitPips = input.int(50, title="Take Profit (pips)", minval=1)
|
||
|
|
stopLossPips = input.int(20, title="Stop Loss (pips)", minval=1)
|
||
|
|
emaFastPeriod = input.int(50, title="Período da EMA Rápida", minval=1)
|
||
|
|
emaSlowPeriod = input.int(200, title="Período da EMA Lenta", minval=1)
|
||
|
|
rsiPeriod = input.int(14, title="Período do RSI", minval=1)
|
||
|
|
overboughtLevel = input.float(70, title="Nível de Sobrecompra (RSI)", minval=0, maxval=100)
|
||
|
|
oversoldLevel = input.float(30, title="Nível de Sobrevenda (RSI)", minval=0, maxval=100)
|
||
|
|
|
||
|
|
// Cálculo dos indicadores
|
||
|
|
emaFast = ta.ema(close, emaFastPeriod)
|
||
|
|
emaSlow = ta.ema(close, emaSlowPeriod)
|
||
|
|
rsi = ta.rsi(close, rsiPeriod)
|
||
|
|
[upperBollinger, middleBollinger, lowerBollinger] = ta.bb(close, 20, 2)
|
||
|
|
|
||
|
|
// Preço atual
|
||
|
|
bidPrice = close
|
||
|
|
askPrice = close
|
||
|
|
|
||
|
|
// Calcula Take Profit e Stop Loss em pontos
|
||
|
|
takeProfitPoints = takeProfitPips * 10 // 1 pip = 10 pontos no TradingView
|
||
|
|
stopLossPoints = stopLossPips * 10
|
||
|
|
|
||
|
|
// Regras de entrada para COMPRA
|
||
|
|
if (emaFast > emaSlow and bidPrice <= lowerBollinger and rsi < oversoldLevel)
|
||
|
|
strategy.entry("Compra", strategy.long, qty=lotSize, stop=bidPrice - stopLossPoints * syminfo.mintick, limit=bidPrice + takeProfitPoints * syminfo.mintick)
|
||
|
|
|
||
|
|
// Regras de entrada para VENDA
|
||
|
|
if (emaFast < emaSlow and askPrice >= upperBollinger and rsi > overboughtLevel)
|
||
|
|
strategy.entry("Venda", strategy.short, qty=lotSize, stop=askPrice + stopLossPoints * syminfo.mintick, limit=askPrice - takeProfitPoints * syminfo.mintick)
|
||
|
|
|
||
|
|
// Plotagem dos indicadores
|
||
|
|
plot(emaFast, color=color.blue, title="EMA Rápida")
|
||
|
|
plot(emaSlow, color=color.red, title="EMA Lenta")
|
||
|
|
plot(upperBollinger, color=color.green, title="Banda Superior de Bollinger")
|
||
|
|
plot(lowerBollinger, color=color.green, title="Banda Inferior de Bollinger")
|
||
|
|
hline(overboughtLevel, "Sobrecompra", color=color.red)
|
||
|
|
hline(oversoldLevel, "Sobrevenda", color=color.green)
|
||
|
|
|
||
|
|
// Plotagem dos sinais de compra e venda
|
||
|
|
plotshape(series=emaFast > emaSlow and bidPrice <= lowerBollinger and rsi < oversoldLevel, title="Sinal de Compra", location=location.belowbar, color=color.green, style=shape.labelup, text="Compra")
|
||
|
|
plotshape(series=emaFast < emaSlow and askPrice >= upperBollinger and rsi > overboughtLevel, title="Sinal de Venda", location=location.abovebar, color=color.red, style=shape.labeldown, text="Venda")
|
||
|
|
```
|
||
|
|
|
||
|
|
> Detail
|
||
|
|
|
||
|
|
https://www.fmz.com/strategy/488278
|
||
|
|
|
||
|
|
> Last Modified
|
||
|
|
|
||
|
|
2025-03-26 15:09:31
|