246 lines
18 KiB
Markdown
246 lines
18 KiB
Markdown

|
|
||
|
|
> Name
|
||
|
|
|
||
|
|
多均线交叉量化策略系统基于自适应移动平均线的趋势跟踪与交易信号优化-Adaptive-Moving-Average-Crossover-Quantitative-Strategy-Trend-Following-and-Trading-Signal-Optimization
|
||
|
|
|
||
|
|
> Author
|
||
|
|
|
||
|
|
ianzeng123
|
||
|
|
|
||
|
|
> Strategy Description
|
||
|
|
|
||
|
|
|
||
|
|
|
||
|
|
|
||
|
|
|
||
|
|
|
||
|
|
[trans]
|
||
|
|
#### 概述
|
||
|
|
|
||
|
|
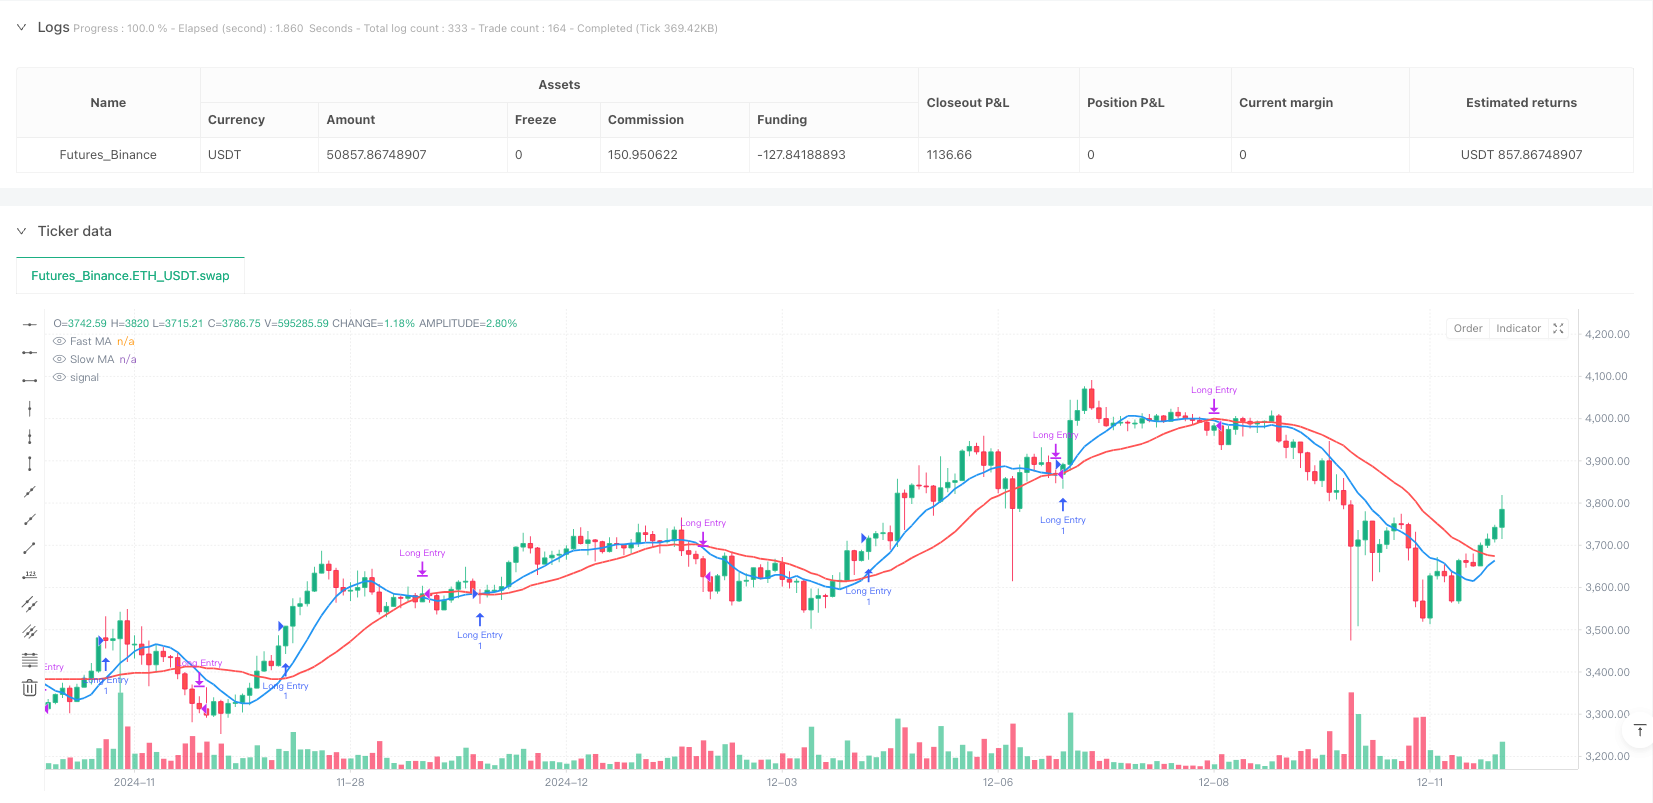
多均线交叉量化策略系统是一种基于技术分析的交易策略,核心思想是通过监测不同周期移动平均线之间的交叉关系来识别市场趋势变化,并据此生成买入和卖出信号。该策略通过对比快速移动平均线(默认9周期)和慢速移动平均线(默认21周期)的相对位置,在快线上穿慢线时产生买入信号,在快线下穿慢线时产生卖出信号。策略的灵活性体现在支持多种均线类型的选择,包括简单移动平均线(SMA)、指数移动平均线(EMA)、加权移动平均线(WMA)和成交量加权移动平均线(VWMA),使交易者能够根据不同市场环境和个人偏好进行调整。
|
||
|
|
|
||
|
|
#### 策略原理
|
||
|
|
|
||
|
|
该策略的核心原理基于移动平均线的趋势指示功能。移动平均线能够平滑价格数据,过滤短期价格波动的噪音,反映市场的整体趋势方向。策略实现的关键部分包括:
|
||
|
|
|
||
|
|
1. 均线计算:策略通过自定义函数`f_ma`计算不同类型的移动平均线,支持SMA、EMA、WMA和VWMA四种类型,使用户可以选择最适合当前市场环境的均线类型。
|
||
|
|
|
||
|
|
2. 交易信号生成:
|
||
|
|
- 买入信号:当快速移动平均线(默认9周期)上穿慢速移动平均线(默认21周期)时,通过`ta.crossover`函数检测,表明短期价格动量超过长期趋势,市场可能进入上升趋势。
|
||
|
|
- 卖出信号:当快速移动平均线下穿慢速移动平均线时,通过`ta.crossunder`函数检测,表明短期价格动量低于长期趋势,市场可能进入下降趋势。
|
||
|
|
|
||
|
|
3. 交易执行:策略使用`strategy.entry`和`strategy.close`函数来执行买入和卖出操作,实现全自动化交易。
|
||
|
|
|
||
|
|
4. 可视化:策略通过`plot`函数绘制移动平均线,并使用`label.new`在图表上标记买入和卖出信号点,使交易者能够直观地理解策略逻辑和交易时机。
|
||
|
|
|
||
|
|
#### 策略优势
|
||
|
|
|
||
|
|
1. 趋势跟踪能力:该策略基于移动平均线交叉,能够有效捕捉市场趋势变化,适合中长期趋势交易。均线交叉信号通常滞后于价格转折点,但能够过滤掉大量噪音交易,提高交易质量。
|
||
|
|
|
||
|
|
2. 灵活的参数调整:策略允许用户自定义快速和慢速移动平均线的周期长度,以及选择不同类型的均线计算方法,可以根据不同市场周期和波动特性进行优化。
|
||
|
|
|
||
|
|
3. 多均线类型支持:策略支持四种不同类型的移动平均线,每种均线都有其特点:
|
||
|
|
- SMA:对所有价格赋予相同权重,平滑效果强但反应较慢
|
||
|
|
- EMA:对近期价格赋予更高权重,对价格变化反应更敏感
|
||
|
|
- WMA:通过线性加权增强近期价格影响,平衡了敏感度和稳定性
|
||
|
|
- VWMA:结合成交量信息,在高成交量区域提供更准确的支撑和阻力位
|
||
|
|
|
||
|
|
4. 清晰的视觉反馈:策略在图表上直观标记买卖信号,帮助交易者快速理解和验证交易决策。
|
||
|
|
|
||
|
|
5. 代码简洁高效:策略编码简洁明了,采用函数式编程思想,通过自定义函数实现均线计算的灵活切换,提高了代码的可维护性和扩展性。
|
||
|
|
|
||
|
|
#### 策略风险
|
||
|
|
|
||
|
|
1. 震荡市场的假信号:在横盘整理或震荡市场中,移动平均线可能频繁交叉,产生大量假信号,导致过度交易和不必要的手续费支出。解决方法可以考虑增加额外的过滤条件,如趋势强度指标或设置最小交叉幅度阈值。
|
||
|
|
|
||
|
|
2. 滞后性问题:移动平均线本质上是滞后指标,在急剧变化的市场中可能无法及时捕捉转折点,导致入场或出场时机延迟。解决方法可以考虑结合更敏感的技术指标,如RSI或MACD,或者优化均线参数以减少滞后。
|
||
|
|
|
||
|
|
3. 单一指标依赖:该策略仅依赖移动平均线交叉进行决策,缺乏多维度分析,容易受到市场噪音影响。解决方法可以考虑整合其他技术指标,如成交量、波动率指标或支撑阻力位等,构建更全面的交易系统。
|
||
|
|
|
||
|
|
4. 缺乏风险管理机制:当前策略没有内置止损和止盈机制,在趋势反转但尚未触发交叉信号时可能导致较大回撤。解决方法可以考虑加入动态止损,如跟踪止损或基于ATR的止损设置。
|
||
|
|
|
||
|
|
5. 参数敏感性:策略性能对均线参数选择较为敏感,不同市场环境可能需要不同的参数组合。解决方法可以考虑进行参数优化测试,或实现自适应参数调整机制。
|
||
|
|
|
||
|
|
#### 策略优化方向
|
||
|
|
|
||
|
|
1. 多指标融合:整合其他技术指标来确认交易信号,如:
|
||
|
|
- 加入成交量指标,确保交易信号在显著成交量支持下更为可靠
|
||
|
|
- 结合RSI或随机指标,识别超买超卖区域,避免在极端情况下逆势交易
|
||
|
|
- 引入趋势强度指标(如ADX),仅在明确趋势中执行交易
|
||
|
|
|
||
|
|
2. 增强风险管理:
|
||
|
|
- 实现动态止损机制,如基于ATR的波动率止损或跟踪止损
|
||
|
|
- 加入资金管理功能,根据账户规模和市场波动性动态调整仓位大小
|
||
|
|
- 设计分批入场和分批出场机制,降低单点风险
|
||
|
|
|
||
|
|
3. 信号过滤优化:
|
||
|
|
- 引入最小交叉确认期,要求均线交叉后保持一定时间才确认信号
|
||
|
|
- 增加交叉幅度阈值,过滤小幅度交叉产生的弱信号
|
||
|
|
- 结合市场结构分析,如支撑阻力位或价格通道,提高信号质量
|
||
|
|
|
||
|
|
4. 参数自适应:
|
||
|
|
- 实现基于市场波动性的动态参数调整,在高波动市场使用更长周期均线
|
||
|
|
- 开发基于市场周期识别的自适应参数机制,适应不同市场阶段
|
||
|
|
- 引入机器学习方法,根据历史数据自动优化参数组合
|
||
|
|
|
||
|
|
5. 交易逻辑拓展:
|
||
|
|
- 增加做空交易逻辑,实现双向交易策略
|
||
|
|
- 开发基于均线带宽的仓位管理,在均线距离较大时减小仓位,降低回撤风险
|
||
|
|
- 结合价格突破确认,提高交易信号的准确性
|
||
|
|
|
||
|
|
#### 总结
|
||
|
|
|
||
|
|
多均线交叉量化策略系统通过监测不同周期移动平均线之间的交叉关系,构建了一套简洁有效的趋势跟踪交易系统。该策略的核心优势在于其简单易懂的逻辑,灵活的参数调整能力,以及对不同市场环境的适应性。然而,作为一种基于滞后指标的策略,它也面临着震荡市场假信号多、信号滞后和单一指标依赖等风险。
|
||
|
|
|
||
|
|
为了提升策略的稳健性和盈利能力,可以从多指标融合、增强风险管理、优化信号过滤机制、实现参数自适应和拓展交易逻辑等方向进行优化。特别是,将技术指标与成交量、市场结构和风险管理原则相结合,可以构建更全面和稳健的交易系统。
|
||
|
|
|
||
|
|
总的来说,这种基于均线交叉的策略为量化交易提供了一个良好的起点,适合初学者理解和实践量化交易的基本原理。通过不断优化和完善,它可以发展成为一套更加成熟和可靠的交易系统,为投资者提供稳定的交易信号和风险控制机制。
|
||
|
|
||
|
||
|
|
#### Overview
|
||
|
|
|
||
|
|
The Adaptive Moving Average Crossover Quantitative Strategy is a technical analysis-based trading system that identifies market trend changes by monitoring crossovers between moving averages of different periods. The core concept involves comparing the relative positions of a fast moving average (default 9-period) and a slow moving average (default 21-period), generating buy signals when the fast line crosses above the slow line and sell signals when the fast line crosses below the slow line. The strategy's flexibility is demonstrated through support for multiple moving average types, including Simple Moving Average (SMA), Exponential Moving Average (EMA), Weighted Moving Average (WMA), and Volume-Weighted Moving Average (VWMA), allowing traders to adjust according to different market environments and personal preferences.
|
||
|
|
|
||
|
|
#### Strategy Principles
|
||
|
|
|
||
|
|
The core principle of this strategy is based on the trend-indicating functionality of moving averages. Moving averages smooth price data, filter out short-term price fluctuation noise, and reflect the overall trend direction of the market. Key components of the strategy implementation include:
|
||
|
|
|
||
|
|
1. Moving Average Calculation: The strategy uses a custom function `f_ma` to calculate different types of moving averages, supporting SMA, EMA, WMA, and VWMA, allowing users to select the most suitable moving average type for the current market environment.
|
||
|
|
|
||
|
|
2. Trading Signal Generation:
|
||
|
|
- Buy Signal: When the fast moving average (default 9-period) crosses above the slow moving average (default 21-period), detected by the `ta.crossover` function, indicating that short-term price momentum exceeds the long-term trend and the market might be entering an uptrend.
|
||
|
|
- Sell Signal: When the fast moving average crosses below the slow moving average, detected by the `ta.crossunder` function, indicating that short-term price momentum falls below the long-term trend and the market might be entering a downtrend.
|
||
|
|
|
||
|
|
3. Trade Execution: The strategy uses `strategy.entry` and `strategy.close` functions to execute buy and sell operations, implementing fully automated trading.
|
||
|
|
|
||
|
|
4. Visualization: The strategy uses the `plot` function to draw moving averages and `label.new` to mark buy and sell signal points on the chart, allowing traders to intuitively understand the strategy logic and trading timing.
|
||
|
|
|
||
|
|
#### Strategy Advantages
|
||
|
|
|
||
|
|
1. Trend Following Capability: Based on moving average crossovers, this strategy effectively captures market trend changes and is suitable for medium to long-term trend trading. While moving average crossover signals typically lag behind price turning points, they filter out numerous noise trades, improving trade quality.
|
||
|
|
|
||
|
|
2. Flexible Parameter Adjustment: The strategy allows users to customize the period lengths of fast and slow moving averages and choose different types of moving average calculation methods, which can be optimized based on different market cycles and volatility characteristics.
|
||
|
|
|
||
|
|
3. Multiple Moving Average Type Support: The strategy supports four different types of moving averages, each with its own characteristics:
|
||
|
|
- SMA: Assigns equal weight to all prices, strong smoothing effect but slower response
|
||
|
|
- EMA: Assigns higher weight to recent prices, more sensitive to price changes
|
||
|
|
- WMA: Enhances recent price influence through linear weighting, balancing sensitivity and stability
|
||
|
|
- VWMA: Incorporates volume information, providing more accurate support and resistance levels in high-volume areas
|
||
|
|
|
||
|
|
4. Clear Visual Feedback: The strategy intuitively marks buy and sell signals on the chart, helping traders quickly understand and validate trading decisions.
|
||
|
|
|
||
|
|
5. Concise and Efficient Code: The strategy code is concise and clear, adopting a functional programming approach with custom functions for flexible moving average calculation switching, improving code maintainability and extensibility.
|
||
|
|
|
||
|
|
#### Strategy Risks
|
||
|
|
|
||
|
|
1. False Signals in Ranging Markets: In sideways or oscillating markets, moving averages may frequently cross, generating numerous false signals, leading to overtrading and unnecessary transaction fees. Solutions may include adding additional filtering conditions, such as trend strength indicators or setting minimum crossover amplitude thresholds.
|
||
|
|
|
||
|
|
2. Lag Issues: Moving averages are inherently lagging indicators and may not capture turning points in time during rapidly changing markets, resulting in delayed entry or exit timing. Solutions may include combining more sensitive technical indicators, such as RSI or MACD, or optimizing moving average parameters to reduce lag.
|
||
|
|
|
||
|
|
3. Single Indicator Dependency: The strategy relies solely on moving average crossovers for decision making, lacking multi-dimensional analysis and susceptible to market noise. Solutions may include integrating other technical indicators such as volume, volatility indicators, or support and resistance levels to build a more comprehensive trading system.
|
||
|
|
|
||
|
|
4. Lack of Risk Management Mechanisms: The current strategy has no built-in stop-loss or take-profit mechanisms, potentially leading to significant drawdowns when trends reverse but no crossover signal has been triggered. Solutions may include adding dynamic stop-loss mechanisms, such as trailing stops or ATR-based stop-loss settings.
|
||
|
|
|
||
|
|
5. Parameter Sensitivity: Strategy performance is sensitive to moving average parameter selection, and different market environments may require different parameter combinations. Solutions may include conducting parameter optimization tests or implementing adaptive parameter adjustment mechanisms.
|
||
|
|
|
||
|
|
#### Strategy Optimization Directions
|
||
|
|
|
||
|
|
1. Multi-Indicator Integration:
|
||
|
|
- Add volume indicators to ensure trading signals are more reliable with significant volume support
|
||
|
|
- Combine RSI or stochastic indicators to identify overbought/oversold areas and avoid counter-trend trading in extreme situations
|
||
|
|
- Introduce trend strength indicators (like ADX) to execute trades only in clear trends
|
||
|
|
|
||
|
|
2. Enhanced Risk Management:
|
||
|
|
- Implement dynamic stop-loss mechanisms, such as ATR-based volatility stops or trailing stops
|
||
|
|
- Add money management functionality to dynamically adjust position size based on account size and market volatility
|
||
|
|
- Design scaled entry and exit mechanisms to reduce single-point risk
|
||
|
|
|
||
|
|
3. Signal Filtering Optimization:
|
||
|
|
- Introduce minimum crossover confirmation periods, requiring moving averages to maintain their position for a certain time before confirming signals
|
||
|
|
- Add crossover amplitude thresholds to filter weak signals from small-amplitude crossovers
|
||
|
|
- Incorporate market structure analysis, such as support/resistance levels or price channels, to improve signal quality
|
||
|
|
|
||
|
|
4. Parameter Adaptivity:
|
||
|
|
- Implement dynamic parameter adjustment based on market volatility, using longer period moving averages in high-volatility markets
|
||
|
|
- Develop adaptive parameter mechanisms based on market cycle identification, adapting to different market phases
|
||
|
|
- Introduce machine learning methods to automatically optimize parameter combinations based on historical data
|
||
|
|
|
||
|
|
5. Trading Logic Expansion:
|
||
|
|
- Add short trading logic to implement a bidirectional trading strategy
|
||
|
|
- Develop position management based on moving average bandwidth, reducing position size when moving averages are far apart to lower drawdown risk
|
||
|
|
- Combine price breakout confirmation to improve the accuracy of trading signals
|
||
|
|
|
||
|
|
#### Summary
|
||
|
|
|
||
|
|
The Adaptive Moving Average Crossover Quantitative Strategy builds an effective trend-following trading system by monitoring crossover relationships between moving averages of different periods. The core advantages of this strategy lie in its simple and understandable logic, flexible parameter adjustment capability, and adaptability to different market environments. However, as a strategy based on lagging indicators, it also faces risks such as numerous false signals in ranging markets, signal lag, and single indicator dependency.
|
||
|
|
|
||
|
|
To enhance the strategy's robustness and profitability, optimizations can be made in the directions of multi-indicator integration, enhanced risk management, signal filtering mechanism optimization, parameter adaptivity implementation, and trading logic expansion. In particular, combining technical indicators with volume, market structure, and risk management principles can build a more comprehensive and robust trading system.
|
||
|
|
|
||
|
|
In summary, this moving average crossover-based strategy provides a good starting point for quantitative trading, suitable for beginners to understand and practice the basic principles of quantitative trading. Through continuous optimization and refinement, it can develop into a more mature and reliable trading system, providing stable trading signals and risk control mechanisms for investors.
|
||
|
|
[/trans]
|
||
|
|
|
||
|
|
|
||
|
|
|
||
|
|
> Source (PineScript)
|
||
|
|
|
||
|
|
``` pinescript
|
||
|
|
/*backtest
|
||
|
|
start: 2024-03-26 00:00:00
|
||
|
|
end: 2024-12-12 00:00:00
|
||
|
|
period: 2h
|
||
|
|
basePeriod: 2h
|
||
|
|
exchanges: [{"eid":"Futures_Binance","currency":"ETH_USDT"}]
|
||
|
|
*/
|
||
|
|
|
||
|
|
|
||
|
|
// @version=5
|
||
|
|
strategy("Moving Average Crossover Strategy", shorttitle="MA Crossover", overlay=true)
|
||
|
|
|
||
|
|
// ——— INPUTS ———
|
||
|
|
fastLength = input.int(9, title="Fast MA Length", minval=1)
|
||
|
|
slowLength = input.int(21, title="Slow MA Length", minval=1)
|
||
|
|
maType = input.string(title="MA Type", defval="SMA", options=["SMA", "EMA", "WMA", "VWMA"])
|
||
|
|
|
||
|
|
// ——— FUNCTION TO RETURN SELECTED MA ———
|
||
|
|
f_ma(_source, _length, _type) => switch _type
|
||
|
|
"SMA" => ta.sma(_source, _length)
|
||
|
|
"EMA" => ta.ema(_source, _length)
|
||
|
|
"WMA" => ta.wma(_source, _length)
|
||
|
|
"VWMA" => ta.vwma(_source, _length)
|
||
|
|
|
||
|
|
// ——— CALCULATE FAST AND SLOW MAs ———
|
||
|
|
fastMA = f_ma(close, fastLength, maType)
|
||
|
|
slowMA = f_ma(close, slowLength, maType)
|
||
|
|
|
||
|
|
// ——— PLOT THE MOVING AVERAGES ———
|
||
|
|
plot(fastMA, color=color.blue, linewidth=2, title="Fast MA")
|
||
|
|
plot(slowMA, color=color.red, linewidth=2, title="Slow MA")
|
||
|
|
|
||
|
|
// ——— TRADING CONDITIONS ———
|
||
|
|
longCondition = ta.crossover(fastMA, slowMA)
|
||
|
|
exitCondition = ta.crossunder(fastMA, slowMA)
|
||
|
|
|
||
|
|
// ——— EXECUTE TRADES ———
|
||
|
|
if longCondition
|
||
|
|
strategy.entry("Long Entry", strategy.long)
|
||
|
|
|
||
|
|
if exitCondition
|
||
|
|
strategy.close("Long Entry")
|
||
|
|
|
||
|
|
// ——— PLOT BUY/SELL LABELS ———
|
||
|
|
if longCondition
|
||
|
|
label.new(bar_index, low, style=label.style_label_up, color=color.new(color.green, 0), textcolor=color.white, text="Buy")
|
||
|
|
|
||
|
|
if exitCondition
|
||
|
|
label.new(bar_index, high, style=label.style_label_down, color=color.new(color.red, 0), textcolor=color.white, text="Sell")
|
||
|
|
|
||
|
|
|
||
|
|
```
|
||
|
|
|
||
|
|
> Detail
|
||
|
|
|
||
|
|
https://www.fmz.com/strategy/488241
|
||
|
|
|
||
|
|
> Last Modified
|
||
|
|
|
||
|
|
2025-03-26 11:09:45
|