157 lines
8.8 KiB
Markdown
157 lines
8.8 KiB
Markdown

|
|
||
|
|
> Name
|
||
|
|
|
||
|
|
多周期相位交叉与指数移动平均趋势跟踪策略-Multi-Period-Phase-Crossover-with-EMA-Trend-Following-Strategy
|
||
|
|
|
||
|
|
> Author
|
||
|
|
|
||
|
|
ChaoZhang
|
||
|
|
|
||
|
|
> Strategy Description
|
||
|
|
|
||
|
|
|
||
|
|
|
||
|
|
[trans]
|
||
|
|
#### 概述
|
||
|
|
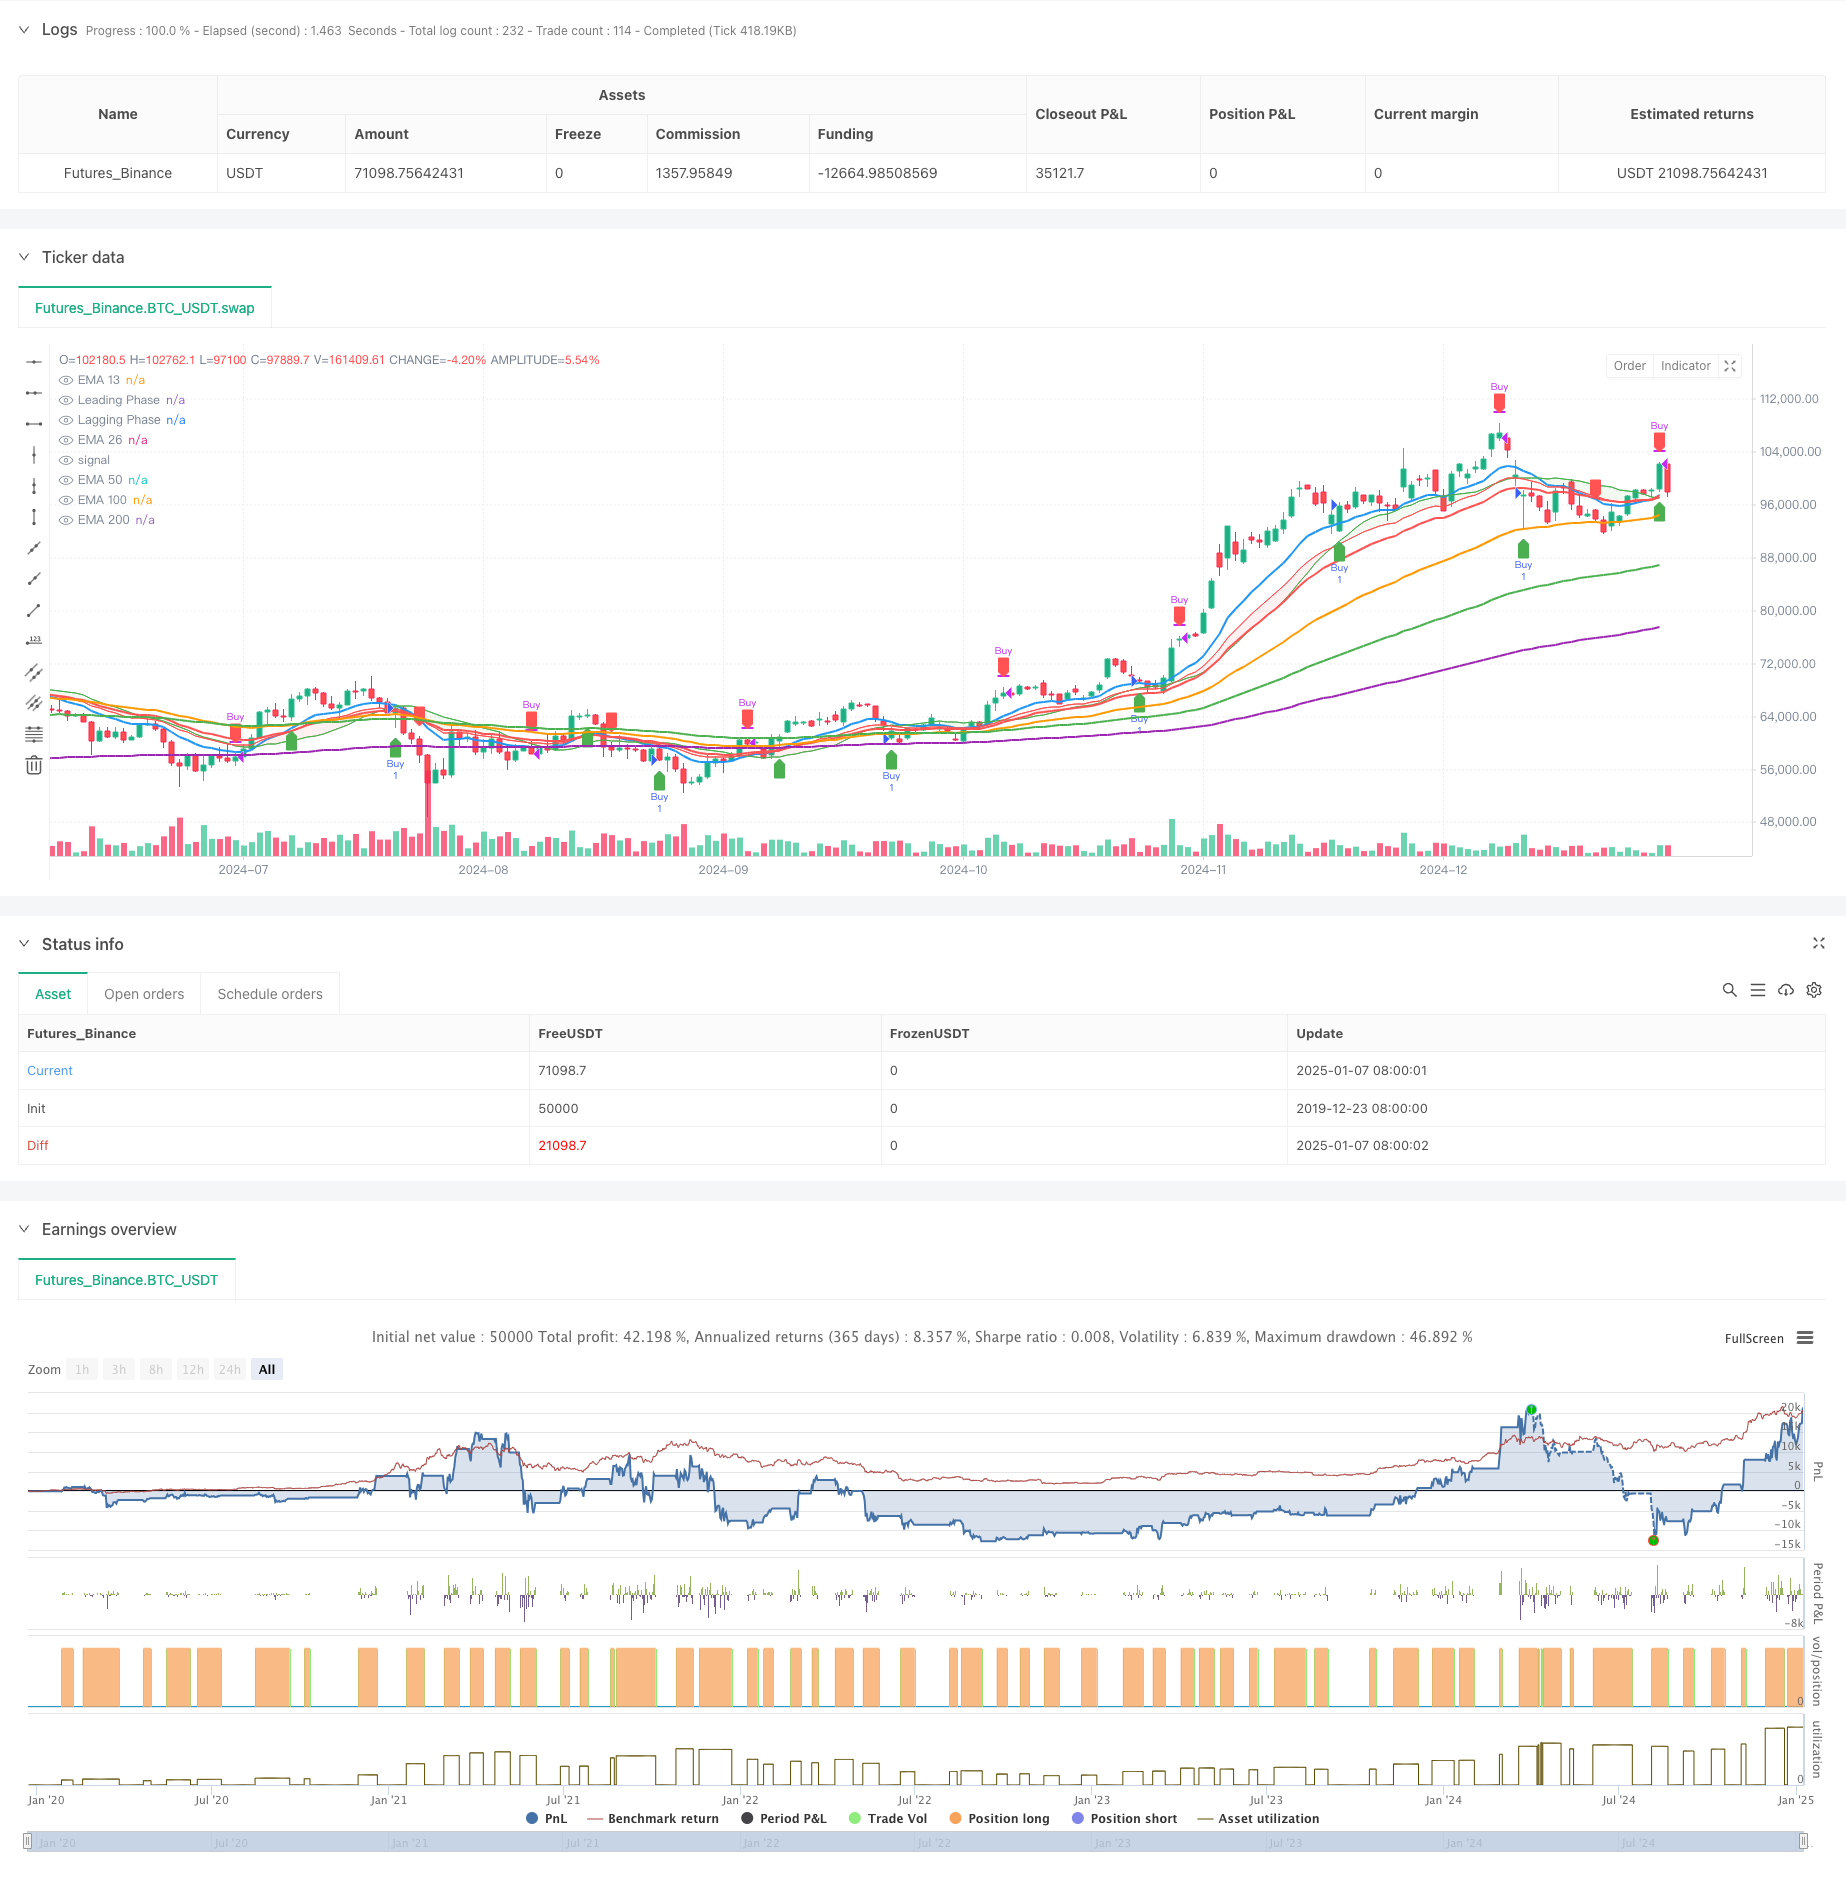
本策略结合了相位交叉信号和多周期指数移动平均线,通过平滑振荡器的交叉和EMA趋势来捕捉市场的买卖机会。该策略使用了领先相位(Leading Phase)和滞后相位(Lagging Phase)的交叉来产生交易信号,同时结合了13、26、50、100和200周期的指数移动平均线来确认市场趋势,提供了一个全面的趋势跟踪和短期交易的解决方案。
|
||
|
|
|
||
|
|
#### 策略原理
|
||
|
|
策略的核心逻辑包含两个主要部分:相位交叉系统和EMA趋势确认系统。相位交叉系统使用了带有上移偏移的简单移动平均线(SMA)作为领先相位,以及带有下移偏移的指数移动平均线(EMA)作为滞后相位。当领先相位上穿滞后相位时产生买入信号,下穿时产生卖出信号。EMA趋势确认系统则使用了多周期(13/26/50/100/200)的指数移动平均线来确认整体市场趋势,其中13期和26期EMA的交叉作为次级交易信号。
|
||
|
|
|
||
|
|
#### 策略优势
|
||
|
|
1. 信号系统完整:结合了短期相位交叉信号和长期趋势确认,能够有效过滤假信号
|
||
|
|
2. 趋势跟踪能力强:通过多周期EMA系统,能够准确把握主要趋势方向
|
||
|
|
3. 可视化效果好:使用颜色区域标识多空状态,交易信号清晰直观
|
||
|
|
4. 参数可调性强:可以根据不同市场特征和交易周期调整相位平滑长度和偏移量
|
||
|
|
5. 风险控制合理:结合多重指标确认,能够有效控制交易风险
|
||
|
|
|
||
|
|
#### 策略风险
|
||
|
|
1. 震荡市场风险:在横盘整理阶段可能产生过多交易信号,增加交易成本
|
||
|
|
2. 滞后性风险:移动平均线本身具有滞后性,可能错过最佳入场时机
|
||
|
|
3. 假突破风险:在市场波动较大时可能出现假突破信号
|
||
|
|
4. 参数敏感性:不同参数设置可能导致策略表现差异较大
|
||
|
|
5. 市场环境依赖:策略在趋势明显的市场表现更好,而在震荡市场效果欠佳
|
||
|
|
|
||
|
|
#### 策略优化方向
|
||
|
|
1. 增加波动率过滤器,在低波动率期间降低交易频率
|
||
|
|
2. 添加成交量确认指标,提高信号可靠性
|
||
|
|
3. 优化止损止盈机制,建立动态止损系统
|
||
|
|
4. 引入市场环境分类,针对不同市场状态调整策略参数
|
||
|
|
5. 开发自适应参数系统,实现策略的动态优化
|
||
|
|
|
||
|
|
#### 总结
|
||
|
|
该策略通过结合相位交叉和多周期EMA系统,构建了一个全面的趋势跟踪交易系统。策略具有信号明确、趋势把握准确、风险控制合理等优势,但同时也存在一定的滞后性和假信号风险。通过添加波动率过滤、成交量确认等优化措施,可以进一步提升策略的稳定性和可靠性。该策略适合在趋势明显的市场中应用,交易者需要根据具体市场特征和个人风险偏好进行参数调整。 ||
|
||
|
|
|
||
|
|
#### Overview
|
||
|
|
This strategy combines phase crossover signals with multi-period exponential moving averages to capture market buying and selling opportunities. It utilizes the crossover of Leading Phase and Lagging Phase to generate trading signals, while incorporating 13, 26, 50, 100, and 200-period EMAs for trend confirmation, providing a comprehensive solution for trend following and short-term trading.
|
||
|
|
|
||
|
|
#### Strategy Principles
|
||
|
|
The core logic consists of two main components: the Phase Crossover System and the EMA Trend Confirmation System. The Phase Crossover System uses a Simple Moving Average (SMA) with upward offset as the Leading Phase and an Exponential Moving Average (EMA) with downward offset as the Lagging Phase. Buy signals are generated when the Leading Phase crosses above the Lagging Phase, and sell signals when it crosses below. The EMA Trend Confirmation System uses multiple period (13/26/50/100/200) exponential moving averages to confirm overall market trends, with the 13 and 26-period EMA crossovers serving as secondary trading signals.
|
||
|
|
|
||
|
|
#### Strategy Advantages
|
||
|
|
1. Complete Signal System: Combines short-term phase crossover signals with long-term trend confirmation to effectively filter false signals
|
||
|
|
2. Strong Trend Following Capability: Accurately captures main trend directions through multi-period EMA system
|
||
|
|
3. Good Visualization: Uses colored zones to identify bullish and bearish conditions with clear trading signals
|
||
|
|
4. Strong Parameter Adaptability: Can be adjusted for different market characteristics and trading periods
|
||
|
|
5. Reasonable Risk Control: Combines multiple indicators for confirmation to effectively control trading risks
|
||
|
|
|
||
|
|
#### Strategy Risks
|
||
|
|
1. Oscillation Market Risk: May generate excessive trading signals during consolidation phases, increasing trading costs
|
||
|
|
2. Lag Risk: Moving averages inherently have lag, potentially missing optimal entry points
|
||
|
|
3. False Breakout Risk: May generate false breakout signals during high market volatility
|
||
|
|
4. Parameter Sensitivity: Different parameter settings may lead to significant strategy performance variations
|
||
|
|
5. Market Environment Dependency: Strategy performs better in trending markets but underperforms in oscillating markets
|
||
|
|
|
||
|
|
#### Strategy Optimization Directions
|
||
|
|
1. Add volatility filters to reduce trading frequency during low volatility periods
|
||
|
|
2. Include volume confirmation indicators to improve signal reliability
|
||
|
|
3. Optimize stop-loss and take-profit mechanisms, establish dynamic stop-loss system
|
||
|
|
4. Introduce market environment classification to adjust strategy parameters for different market states
|
||
|
|
5. Develop adaptive parameter system for dynamic strategy optimization
|
||
|
|
|
||
|
|
#### Summary
|
||
|
|
This strategy builds a comprehensive trend following trading system by combining phase crossover and multi-period EMA systems. It features clear signals, accurate trend capture, and reasonable risk control, while also having certain lag and false signal risks. The strategy's stability and reliability can be further enhanced through optimizations such as adding volatility filters and volume confirmation. It is suitable for application in clearly trending markets, and traders need to adjust parameters based on specific market characteristics and individual risk preferences.[/trans]
|
||
|
|
|
||
|
|
|
||
|
|
|
||
|
|
> Source (PineScript)
|
||
|
|
|
||
|
|
``` pinescript
|
||
|
|
/*backtest
|
||
|
|
start: 2019-12-23 08:00:00
|
||
|
|
end: 2025-01-08 08:00:00
|
||
|
|
period: 1d
|
||
|
|
basePeriod: 1d
|
||
|
|
exchanges: [{"eid":"Futures_Binance","currency":"BTC_USDT"}]
|
||
|
|
*/
|
||
|
|
|
||
|
|
//@version=5
|
||
|
|
strategy("Phase Cross Strategy with Zone", overlay=true)
|
||
|
|
|
||
|
|
// Inputs
|
||
|
|
length = input.int(20, title="Smoothing Length")
|
||
|
|
source = input(close, title="Source")
|
||
|
|
offset = input.float(0.5, title="Offset Amount", minval=0.0) // Offset for spacing
|
||
|
|
|
||
|
|
// Simulating "Phases" with Smoothed Oscillators
|
||
|
|
lead_phase = ta.sma(source, length) + offset // Leading phase with offset
|
||
|
|
lag_phase = ta.ema(source, length) - offset // Lagging phase with offset
|
||
|
|
|
||
|
|
// Signal Logic
|
||
|
|
buySignal = ta.crossover(lead_phase, lag_phase)
|
||
|
|
sellSignal = ta.crossunder(lead_phase, lag_phase)
|
||
|
|
|
||
|
|
// Plot Phases (as `plot` objects for `fill`)
|
||
|
|
lead_plot = plot(lead_phase, color=color.green, title="Leading Phase", linewidth=1)
|
||
|
|
lag_plot = plot(lag_phase, color=color.red, title="Lagging Phase", linewidth=1)
|
||
|
|
|
||
|
|
// Fill Zone Between Phases
|
||
|
|
fill_color = lead_phase > lag_phase ? color.new(color.green, 90) : color.new(color.red, 90)
|
||
|
|
fill(plot1=lead_plot, plot2=lag_plot, color=fill_color, title="Phase Zone")
|
||
|
|
|
||
|
|
// Plot Buy and Sell Signals
|
||
|
|
plotshape(buySignal, style=shape.labelup, location=location.belowbar, color=color.new(color.green, 0), title="Buy Signal", size=size.small)
|
||
|
|
plotshape(sellSignal, style=shape.labeldown, location=location.abovebar, color=color.new(color.red, 0), title="Sell Signal", size=size.small)
|
||
|
|
|
||
|
|
// Strategy Entry and Exit
|
||
|
|
if buySignal
|
||
|
|
strategy.entry("Buy", strategy.long)
|
||
|
|
|
||
|
|
if sellSignal
|
||
|
|
strategy.close("Buy")
|
||
|
|
|
||
|
|
|
||
|
|
//indicator("EMA 13, 26, 50, 100, and 200 with Crossover, Value Zone, and Special Candles", overlay=true)
|
||
|
|
|
||
|
|
// Define the EMAs
|
||
|
|
ema13 = ta.ema(close, 13)
|
||
|
|
ema26 = ta.ema(close, 26)
|
||
|
|
ema50 = ta.ema(close, 50)
|
||
|
|
ema100 = ta.ema(close, 100)
|
||
|
|
ema200 = ta.ema(close, 200)
|
||
|
|
|
||
|
|
// Plot the EMAs
|
||
|
|
plot(ema13, color=color.blue, linewidth=2, title="EMA 13")
|
||
|
|
plot(ema26, color=color.red, linewidth=2, title="EMA 26")
|
||
|
|
plot(ema50, color=color.orange, linewidth=2, title="EMA 50")
|
||
|
|
plot(ema100, color=color.green, linewidth=2, title="EMA 100")
|
||
|
|
plot(ema200, color=color.purple, linewidth=2, title="EMA 200")
|
||
|
|
|
||
|
|
// Crossover conditions
|
||
|
|
uptrend = ta.crossover(ema13, ema26) // EMA 13 crosses above EMA 26 (buy)
|
||
|
|
downtrend = ta.crossunder(ema13, ema26) // EMA 13 crosses below EMA 26 (sell)
|
||
|
|
|
||
|
|
// Plot buy/sell arrows
|
||
|
|
plotshape(series=uptrend, location=location.belowbar, color=color.green, style=shape.labelup, size=size.small, title="Buy Signal")
|
||
|
|
plotshape(series=downtrend, location=location.abovebar, color=color.red, style=shape.labeldown, size=size.small, title="Sell Signal")
|
||
|
|
|
||
|
|
```
|
||
|
|
|
||
|
|
> Detail
|
||
|
|
|
||
|
|
https://www.fmz.com/strategy/477949
|
||
|
|
|
||
|
|
> Last Modified
|
||
|
|
|
||
|
|
2025-01-10 15:17:33
|