172 lines
9.1 KiB
Markdown
172 lines
9.1 KiB
Markdown

|
|
||
|
|
> Name
|
||
|
|
|
||
|
|
复合趋势均线反转交易策略-Composite-Trend-Moving-Average-Reversal-Trading-Strategy
|
||
|
|
|
||
|
|
> Author
|
||
|
|
|
||
|
|
ianzeng123
|
||
|
|
|
||
|
|
> Strategy Description
|
||
|
|
|
||
|
|
|
||
|
|
|
||
|
|
|
||
|
|
|
||
|
|
|
||
|
|
|
||
|
|
|
||
|
|
[trans]
|
||
|
|
#### 概述
|
||
|
|
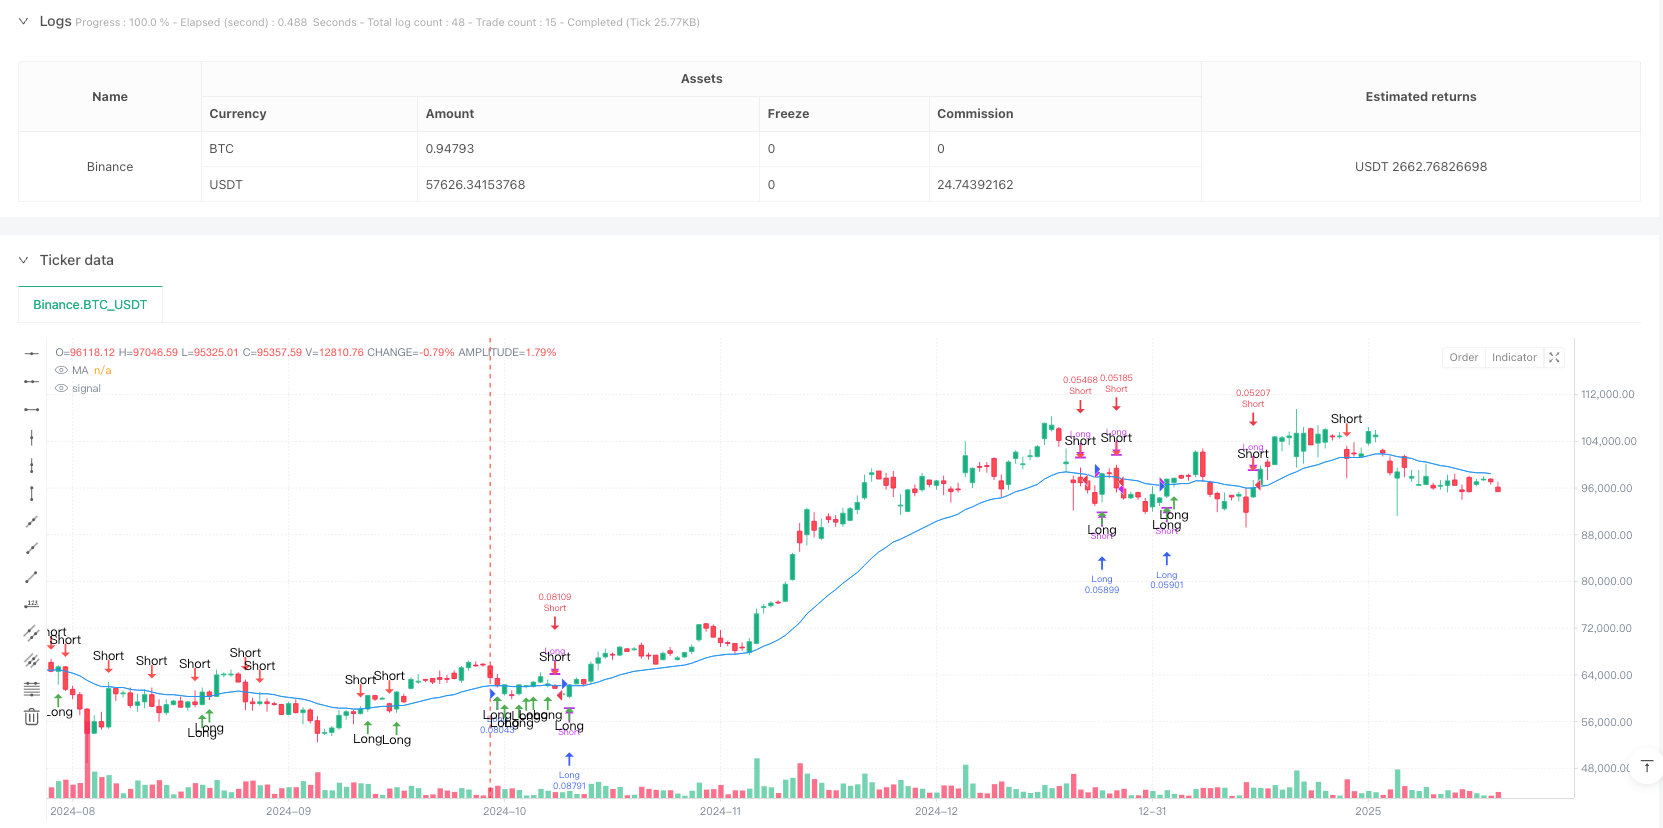
该策略是一个基于复合均线的趋势跟踪和反转交易系统。它通过组合不同周期的移动平均线,结合价格对均线的反应来识别交易机会。策略的核心是通过观察价格与均线之间的关系以及价格回调到特定阈值时的反应来判断交易时机。
|
||
|
|
|
||
|
|
#### 策略原理
|
||
|
|
策略使用了多种移动平均线类型(EMA、TEMA、DEMA、WMA、SMA)的组合,通过两个不同周期(默认20和30)的加权或算术平均来构建复合均线。当价格在均线上方时认为是上升趋势,在均线下方时认为是下降趋势。策略会在趋势确立后等待价格回调到均线附近(通过反应百分比参数控制)时,如果出现反转信号则进行交易。具体来说,在上升趋势中,当价格回调到均线以下特定百分比并重新收于均线上方时开多;在下降趋势中,当价格反弹到均线以上特定百分比并重新收于均线下方时开空。
|
||
|
|
|
||
|
|
#### 策略优势
|
||
|
|
1. 系统具有良好的适应性,支持多种均线类型,可以根据不同市场特征选择最适合的均线。
|
||
|
|
2. 通过复合均线的方式,有效减少了单一周期均线可能带来的虚假信号。
|
||
|
|
3. 策略加入了反应百分比的概念,避免了简单的均线穿越交易,提高了交易的可靠性。
|
||
|
|
4. 在趋势方向明确的情况下,通过等待回调入场可以获得更好的交易价格。
|
||
|
|
|
||
|
|
#### 策略风险
|
||
|
|
1. 在震荡市场中可能会产生频繁的假信号,导致交易成本增加。
|
||
|
|
2. 复合均线的滞后性可能导致入场和出场时机的延迟。
|
||
|
|
3. 固定的反应百分比在不同市场环境下可能需要调整。
|
||
|
|
4. 在快速趋势转换的市场中,可能会出现较大的回撤。
|
||
|
|
|
||
|
|
#### 策略优化方向
|
||
|
|
1. 可以引入波动率指标来动态调整反应百分比,使策略更好地适应不同市场环境。
|
||
|
|
2. 加入成交量因素来确认价格反转的有效性。
|
||
|
|
3. 考虑添加止损和止盈机制,更好地控制风险。
|
||
|
|
4. 可以增加趋势强度的判断,在强趋势中采用更激进的参数设置。
|
||
|
|
5. 考虑加入市场环境的判断,在不同的市场特征下使用不同的参数组合。
|
||
|
|
|
||
|
|
#### 总结
|
||
|
|
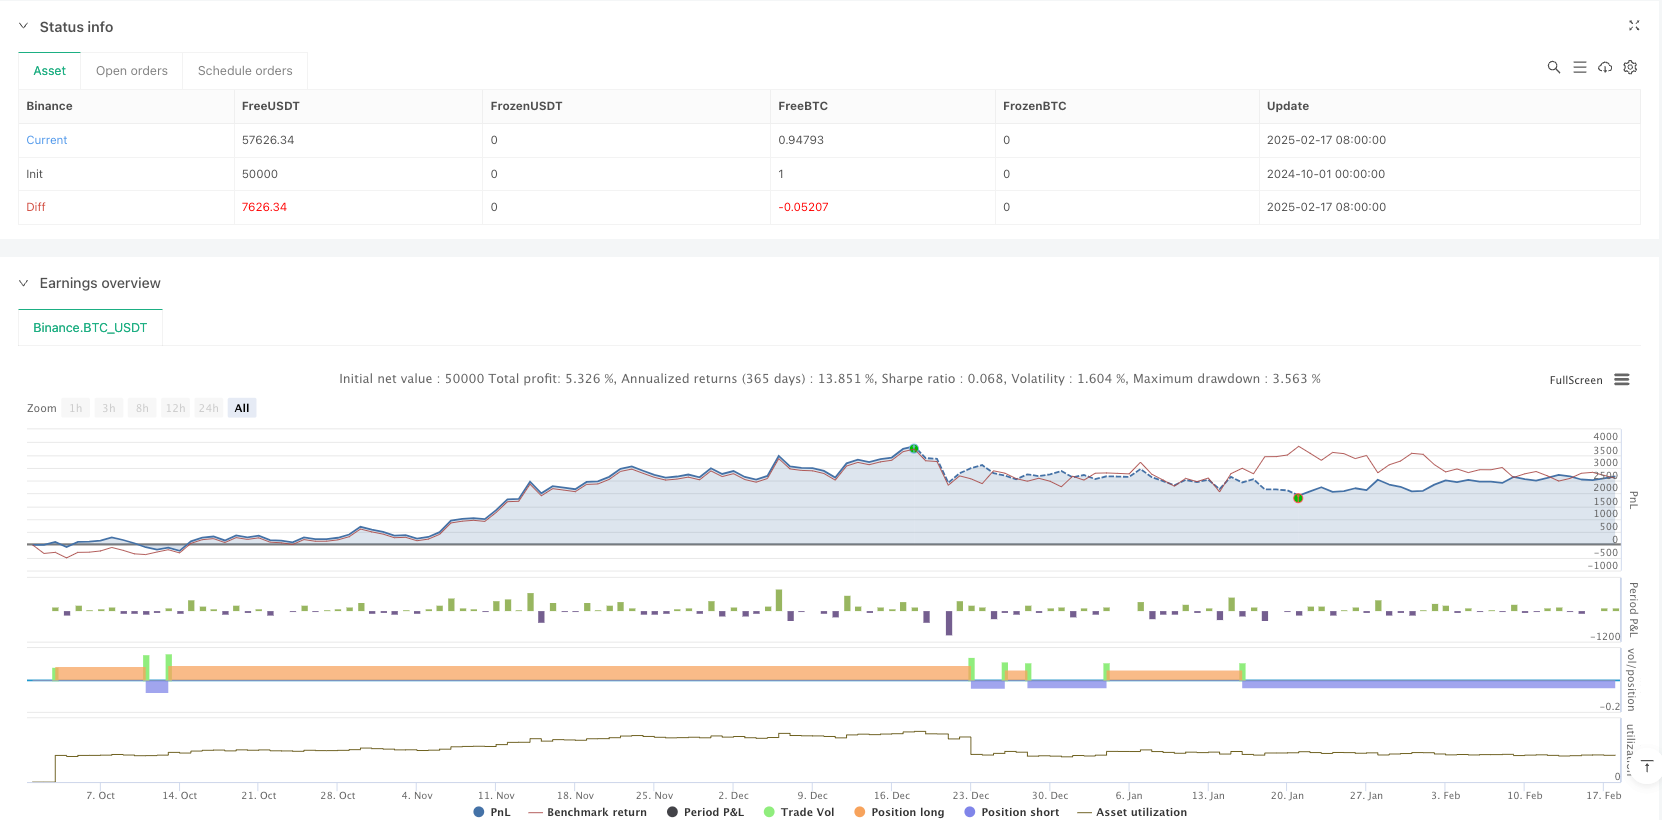
这是一个结合了趋势跟踪和反转交易理念的策略,通过复合均线和价格反应机制来捕捉交易机会。策略的核心优势在于其灵活性和对虚假信号的过滤能力,但同时也需要注意在不同市场环境下的参数优化问题。通过合理的风险控制和持续的优化改进,该策略有望在实际交易中取得稳定的收益。||
|
||
|
|
|
||
|
|
#### Overview
|
||
|
|
This strategy is a trend following and reversal trading system based on composite moving averages. It identifies trading opportunities by combining moving averages of different periods and monitoring price reactions to these averages. The core concept involves observing the relationship between price and moving averages, and trading based on price reactions at specific threshold levels.
|
||
|
|
|
||
|
|
#### Strategy Principle
|
||
|
|
The strategy employs various types of moving averages (EMA, TEMA, DEMA, WMA, SMA) and combines two different periods (default 20 and 30) through weighted or arithmetic averaging to construct a composite moving average. An uptrend is identified when price is above the average, and a downtrend when below. The strategy waits for price pullbacks near the moving average (controlled by a reaction percentage parameter) after a trend is established. Specifically, in an uptrend, it opens long positions when price pulls back below a specific percentage of the average and closes above it; in a downtrend, it opens short positions when price rebounds above a specific percentage and closes below the average.
|
||
|
|
|
||
|
|
#### Strategy Advantages
|
||
|
|
1. The system demonstrates good adaptability, supporting multiple types of moving averages to suit different market characteristics.
|
||
|
|
2. The composite moving average approach effectively reduces false signals that might occur with single-period averages.
|
||
|
|
3. The inclusion of a reaction percentage concept avoids simple moving average crossover trades, improving trading reliability.
|
||
|
|
4. Waiting for pullbacks in established trends allows for better entry prices.
|
||
|
|
|
||
|
|
#### Strategy Risks
|
||
|
|
1. May generate frequent false signals in choppy markets, increasing trading costs.
|
||
|
|
2. The lag inherent in composite moving averages can delay entry and exit timing.
|
||
|
|
3. Fixed reaction percentages may need adjustment in different market environments.
|
||
|
|
4. Significant drawdowns may occur during rapid trend transitions.
|
||
|
|
|
||
|
|
#### Strategy Optimization Directions
|
||
|
|
1. Incorporate volatility indicators to dynamically adjust reaction percentages for better market adaptation.
|
||
|
|
2. Add volume factors to confirm price reversal validity.
|
||
|
|
3. Implement stop-loss and take-profit mechanisms for better risk control.
|
||
|
|
4. Add trend strength evaluation for more aggressive parameter settings in strong trends.
|
||
|
|
5. Consider market environment analysis for different parameter combinations in various market conditions.
|
||
|
|
|
||
|
|
#### Summary
|
||
|
|
This strategy combines trend following and reversal trading concepts, capturing opportunities through composite moving averages and price reaction mechanisms. Its core strengths lie in flexibility and false signal filtering capability, though parameter optimization across different market environments requires attention. With proper risk control and continuous improvement, the strategy shows potential for stable returns in practical trading.[/trans]
|
||
|
|
|
||
|
|
|
||
|
|
|
||
|
|
> Source (PineScript)
|
||
|
|
|
||
|
|
``` pinescript
|
||
|
|
/*backtest
|
||
|
|
start: 2024-10-01 00:00:00
|
||
|
|
end: 2025-02-18 08:00:00
|
||
|
|
period: 1d
|
||
|
|
basePeriod: 1d
|
||
|
|
exchanges: [{"eid":"Binance","currency":"BTC_USDT"}]
|
||
|
|
*/
|
||
|
|
|
||
|
|
//@version=5
|
||
|
|
strategy("Ultrajante MA Reaction Strategy", overlay=true, initial_capital=10000,
|
||
|
|
default_qty_type=strategy.percent_of_equity, default_qty_value=10)
|
||
|
|
|
||
|
|
// ===== Custom Functions for DEMA and TEMA =====
|
||
|
|
dema(src, length) =>
|
||
|
|
ema1 = ta.ema(src, length)
|
||
|
|
ema2 = ta.ema(ema1, length)
|
||
|
|
2 * ema1 - ema2
|
||
|
|
|
||
|
|
tema(src, length) =>
|
||
|
|
ema1 = ta.ema(src, length)
|
||
|
|
ema2 = ta.ema(ema1, length)
|
||
|
|
ema3 = ta.ema(ema2, length)
|
||
|
|
3 * ema1 - 3 * ema2 + ema3
|
||
|
|
|
||
|
|
// ===== Configuration Parameters =====
|
||
|
|
|
||
|
|
// MA Type Selection
|
||
|
|
maType = input.string(title="MA Type", defval="EMA", options=["SMA", "EMA", "WMA", "DEMA", "TEMA"])
|
||
|
|
|
||
|
|
// Parameters for composite periods
|
||
|
|
periodA = input.int(title="Period A", defval=20, minval=1)
|
||
|
|
periodB = input.int(title="Period B", defval=30, minval=1)
|
||
|
|
compMethod = input.string(title="Composite Method", defval="Average", options=["Average", "Weighted"])
|
||
|
|
|
||
|
|
// Reaction percentage (e.g., 0.5 means 0.5%)
|
||
|
|
reactionPerc = input.float(title="Reaction %", defval=0.5, step=0.1)
|
||
|
|
|
||
|
|
// ===== Composite Period Calculation =====
|
||
|
|
compPeriod = compMethod == "Average" ? math.round((periodA + periodB) / 2) : math.round((periodA * 0.6 + periodB * 0.4))
|
||
|
|
|
||
|
|
// ===== Moving Average Calculation based on selected type =====
|
||
|
|
ma = switch maType
|
||
|
|
"SMA" => ta.sma(close, compPeriod)
|
||
|
|
"EMA" => ta.ema(close, compPeriod)
|
||
|
|
"WMA" => ta.wma(close, compPeriod)
|
||
|
|
"DEMA" => dema(close, compPeriod)
|
||
|
|
"TEMA" => tema(close, compPeriod)
|
||
|
|
=> ta.ema(close, compPeriod) // Default value
|
||
|
|
|
||
|
|
plot(ma, color=color.blue, title="MA")
|
||
|
|
|
||
|
|
// ===== Trend Definition =====
|
||
|
|
trendUp = close > ma
|
||
|
|
trendDown = close < ma
|
||
|
|
|
||
|
|
// ===== Reaction Threshold Calculation =====
|
||
|
|
// In uptrend: expect the price to retrace to or below a value close to the MA
|
||
|
|
upThreshold = ma * (1 - reactionPerc / 100)
|
||
|
|
// In downtrend: expect the price to retrace to or above a value close to the MA
|
||
|
|
downThreshold = ma * (1 + reactionPerc / 100)
|
||
|
|
|
||
|
|
// ===== Quick Reaction Detection =====
|
||
|
|
// For uptrend: reaction is detected if the low is less than or equal to the threshold and the close recovers and stays above the MA
|
||
|
|
upReaction = trendUp and (low <= upThreshold) and (close > ma)
|
||
|
|
// For downtrend: reaction is detected if the high is greater than or equal to the threshold and the close stays below the MA
|
||
|
|
downReaction = trendDown and (high >= downThreshold) and (close < ma)
|
||
|
|
|
||
|
|
// ===== Trade Execution =====
|
||
|
|
if upReaction
|
||
|
|
// Close short position if exists and open long position
|
||
|
|
strategy.close("Short", comment="Close Short due to Bullish Reaction")
|
||
|
|
strategy.entry("Long", strategy.long, comment="Long Entry due to Bullish Reaction in Uptrend")
|
||
|
|
|
||
|
|
if downReaction
|
||
|
|
// Close long position if exists and open short position
|
||
|
|
strategy.close("Long", comment="Close Long due to Bearish Reaction")
|
||
|
|
strategy.entry("Short", strategy.short, comment="Short Entry due to Bearish Reaction in Downtrend")
|
||
|
|
|
||
|
|
// ===== Visualization of Reactions on the Chart =====
|
||
|
|
plotshape(upReaction, title="Bullish Reaction", style=shape.arrowup, location=location.belowbar, color=color.green, size=size.small, text="Long")
|
||
|
|
plotshape(downReaction, title="Bearish Reaction", style=shape.arrowdown, location=location.abovebar, color=color.red, size=size.small, text="Short")
|
||
|
|
|
||
|
|
```
|
||
|
|
|
||
|
|
> Detail
|
||
|
|
|
||
|
|
https://www.fmz.com/strategy/482906
|
||
|
|
|
||
|
|
> Last Modified
|
||
|
|
|
||
|
|
2025-02-27 17:23:21
|