207 lines
12 KiB
Markdown
207 lines
12 KiB
Markdown

|
|
||
|
|
> Name
|
||
|
|
|
||
|
|
基于多重移动平均线RSI-和标准差出场的蜡烛线高度突破交易策略Multi-EMA-RSI-and-Standard-Deviation-Based-Exit-Candlestick-Height-Breakout-Trading-Strategy
|
||
|
|
|
||
|
|
> Author
|
||
|
|
|
||
|
|
ChaoZhang
|
||
|
|
|
||
|
|
> Strategy Description
|
||
|
|
|
||
|
|
|
||
|
|
[trans]
|
||
|
|
|
||
|
|
## 策略概述
|
||
|
|
|
||
|
|
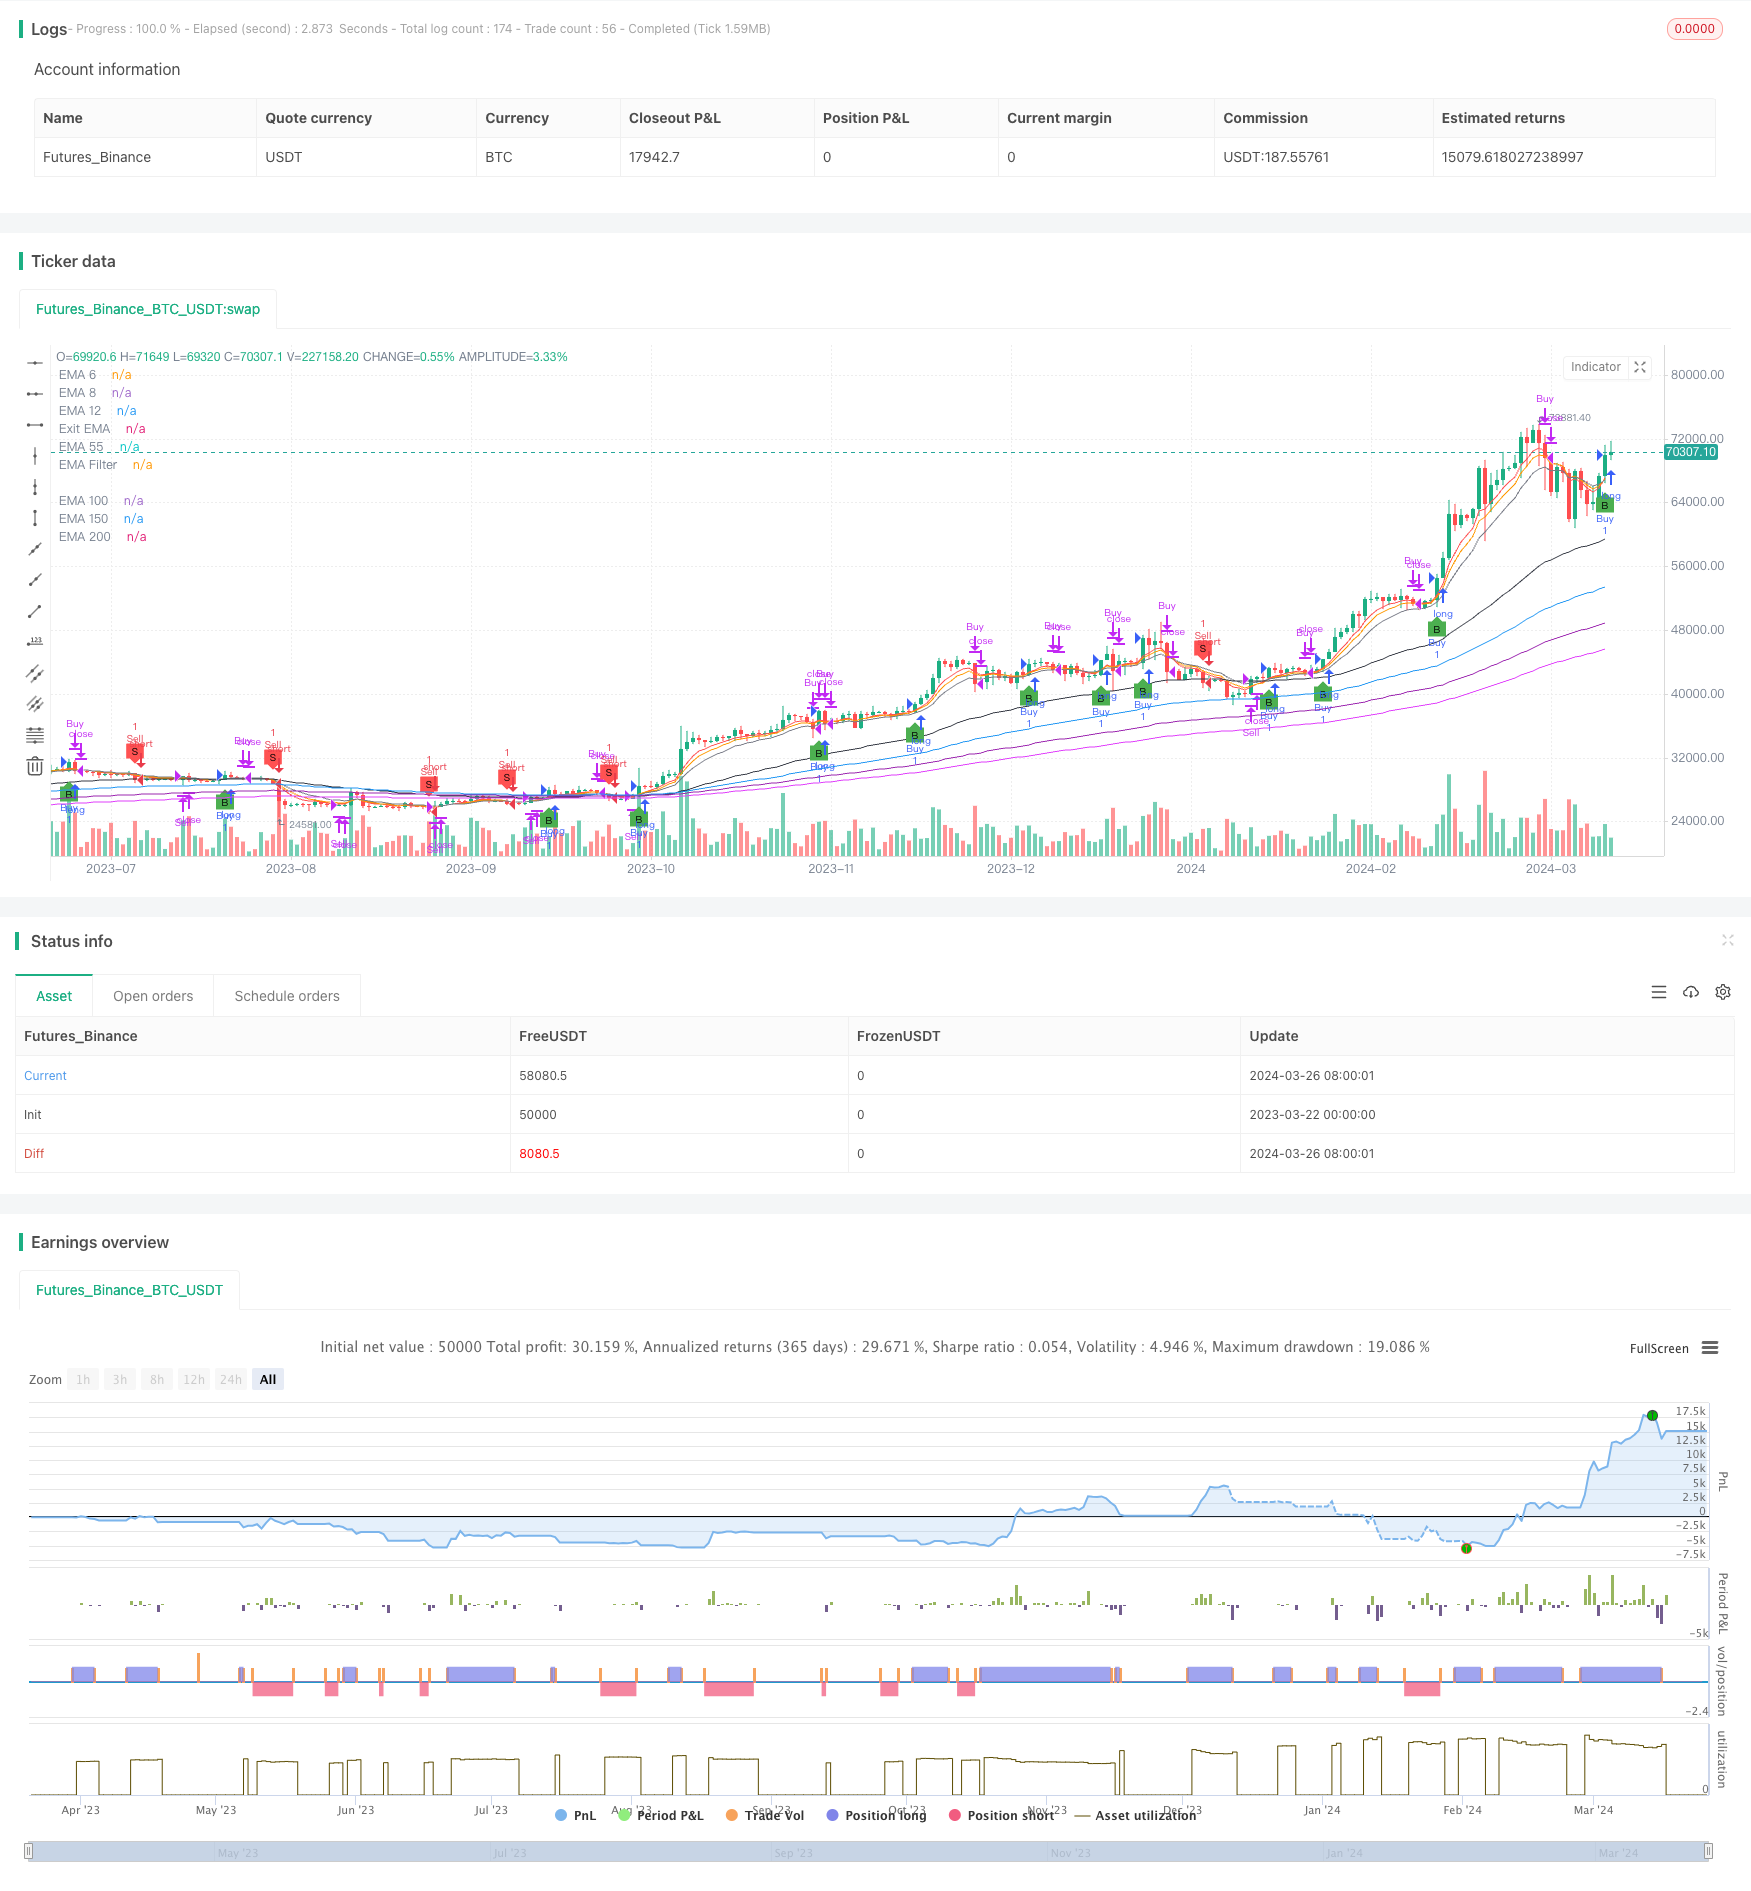
该策略结合了多个指数移动平均线(EMA)、相对强弱指数(RSI)以及基于标准差的出场条件来识别潜在的买卖机会。使用了短期(6、8、12天)、中期(55天)和长期(150、200、250天)的 EMA 来分析市场趋势的方向和强度。RSI 采用可配置的买入(30)和卖出(70)阈值来评估动量并识别超买或超卖状况。该策略还采用了一个独特的出场机制,当收盘价触及 12 日 EMA 的可配置标准差范围(默认为0.5)时触发出场,从而提供了一种潜在的保护利润或降低损失的方法。
|
||
|
|
|
||
|
|
## 策略原理
|
||
|
|
|
||
|
|
1. 计算多个周期的 EMA(6、8、12、55、100、150、200)作为视觉参考,以评估市场趋势。
|
||
|
|
2. 根据用户输入的蜡烛线数量(3-4根),计算最近 N 根蜡烛线的最高价和最低价。
|
||
|
|
3. 买入条件:当前收盘价高于最近 N 根蜡烛线的最高价,且高于 EMA 过滤器(如果启用)。
|
||
|
|
4. 卖出条件:当前收盘价低于最近 N 根蜡烛线的最低价,且低于 EMA 过滤器(如果启用)。
|
||
|
|
5. 长仓出场条件:当前收盘价低于 12 日 EMA + 0.5 倍标准差,或低于 12 日 EMA。
|
||
|
|
6. 短仓出场条件:当前收盘价高于 12 日 EMA - 0.5 倍标准差,或高于 12 日 EMA。
|
||
|
|
7. 使用 RSI 作为辅助指标,默认周期为14,超卖阈值为30,超买阈值为70。
|
||
|
|
|
||
|
|
## 策略优势
|
||
|
|
|
||
|
|
1. 结合了趋势跟踪(多重 EMA)和动量(RSI)两个维度,提供了更全面的市场分析视角。
|
||
|
|
2. 独特的基于标准差的出场机制,可在保护利润和控制风险之间取得平衡。
|
||
|
|
3. 代码模块化程度高,关键参数可由用户配置,灵活性强。
|
||
|
|
4. 适用于多个品种和时间周期,特别是日线的股票和比特币交易。
|
||
|
|
|
||
|
|
## 风险分析
|
||
|
|
|
||
|
|
1. 在震荡市或趋势反转初期,频繁出现虚假信号,导致连续亏损。
|
||
|
|
2. 默认参数并非对所有市场环境都有效,需结合回测对参数进行优化。
|
||
|
|
3. 单纯依赖本策略进行交易风险较大,建议结合其他指标、支撑阻力位等辅助决策。
|
||
|
|
4. 对突发重大事件引发的趋势反转响应较慢。
|
||
|
|
|
||
|
|
## 优化方向
|
||
|
|
|
||
|
|
1. 对 EMA 和 RSI 参数进行优化:根据品种、周期和市场特点,对各项参数组合进行穷举,寻找最佳参数区间。
|
||
|
|
2. 加入止损止盈机制:参考 ATR 等波动率指标,设置合理的止损和止盈位,控制单笔交易风险。
|
||
|
|
3. 引入仓位管理:可根据趋势强度(如 ADX)或距离关键支撑阻力位远近,调节仓位大小。
|
||
|
|
4. 与其他技术指标组合使用:如布林带、MACD、均线交叉等,提高开平仓信号可靠性。
|
||
|
|
5. 分市场状态优化:对趋势、震荡、转折等不同市场状态分别优化参数组合。
|
||
|
|
|
||
|
|
## 总结
|
||
|
|
|
||
|
|
本文提出了一个基于多重移动平均线、RSI 和标准差出场的蜡烛线高度突破交易策略。该策略从趋势和动量两个维度对市场进行分析,同时采用了独特的标准差出场机制,在捕捉趋势机会的同时兼顾风险控制。策略思路清晰,逻辑严谨,代码实现简洁高效。经过合理优化,该策略有望成为一个稳健的日内中高频交易策略。但需注意,任何策略都有其局限性,盲目使用可能带来风险。量化交易不应是机械的"信号-下单"过程,而应建立在对整体市场态势的把握和审慎的风险管理之上。交易者还需不断评估策略表现,适时调整,并与自己的交易风格和承受能力相结合,才能长期立于不败之地。
|
||
|
|
|
||
|
|
||
|
||
|
|
|
||
|
|
## Strategy Overview
|
||
|
|
|
||
|
|
This strategy combines multiple Exponential Moving Averages (EMAs), the Relative Strength Index (RSI), and a standard deviation-based exit condition to identify potential buy and sell opportunities. It uses short-term (6, 8, 12 days), medium-term (55 days), and long-term (150, 200, 250 days) EMAs to analyze the direction and strength of market trends. The RSI, with configurable buy (30) and sell (70) thresholds, is employed to assess momentum and identify overbought or oversold conditions. The strategy also features a unique exit mechanism that triggers when the closing price reaches a configurable standard deviation range (default 0.5) from the 12-day EMA, providing a method for potentially protecting profits or minimizing losses.
|
||
|
|
|
||
|
|
## Strategy Principles
|
||
|
|
|
||
|
|
1. Calculate multiple EMAs (6, 8, 12, 55, 100, 150, 200) as visual references to assess market trends.
|
||
|
|
2. Determine the highest high and lowest low of the most recent N candles based on user input (3-4 candles).
|
||
|
|
3. Entry Long: The current close is higher than the highest high of the recent N candles and above the EMA filter (if enabled).
|
||
|
|
4. Entry Short: The current close is lower than the lowest low of the recent N candles and below the EMA filter (if enabled).
|
||
|
|
5. Exit Long: The current close is below the 12-day EMA + 0.5 standard deviations, or below the 12-day EMA.
|
||
|
|
6. Exit Short: The current close is above the 12-day EMA - 0.5 standard deviations, or above the 12-day EMA.
|
||
|
|
7. Use RSI as a supplementary indicator with a default period of 14, an oversold threshold of 30, and an overbought threshold of 70.
|
||
|
|
|
||
|
|
## Strategy Advantages
|
||
|
|
|
||
|
|
1. Combines both trend-following (multiple EMAs) and momentum (RSI) dimensions for a more comprehensive market analysis perspective.
|
||
|
|
2. Unique standard deviation-based exit mechanism can balance protecting profits and controlling risks.
|
||
|
|
3. Highly modularized code with key parameters configurable by users for strong flexibility.
|
||
|
|
4. Applicable to multiple instruments and timeframes, especially daily stocks and Bitcoin trading.
|
||
|
|
|
||
|
|
## Risk Analysis
|
||
|
|
|
||
|
|
1. Frequent false signals during market consolidation or early trend reversals, leading to consecutive losses.
|
||
|
|
2. Default parameters may not be effective for all market conditions; optimization based on backtesting is necessary.
|
||
|
|
3. Relying solely on this strategy for trading is risky; it is recommended to combine with other indicators, support/resistance levels for decision-making.
|
||
|
|
4. Slow to respond to trend reversals triggered by sudden major events.
|
||
|
|
|
||
|
|
## Optimization Directions
|
||
|
|
|
||
|
|
1. Optimize EMA and RSI parameters: Perform exhaustive searches for optimal parameter ranges based on instruments, timeframes, and market characteristics.
|
||
|
|
2. Introduce stop-loss and take-profit mechanisms: Set reasonable stop-loss and take-profit levels with reference to volatility indicators like ATR to control single-trade risks.
|
||
|
|
3. Implement position sizing: Adjust position sizes based on trend strength (e.g., ADX) or proximity to key support/resistance levels.
|
||
|
|
4. Combine with other technical indicators: Such as Bollinger Bands, MACD, moving average crossovers to improve the reliability of entry/exit signals.
|
||
|
|
5. Optimize for different market states: Fine-tune parameter combinations for trending, ranging, and transitioning markets separately.
|
||
|
|
|
||
|
|
## Summary
|
||
|
|
|
||
|
|
This article proposes a candlestick height breakout trading strategy based on multiple moving averages, RSI, and a standard deviation exit. The strategy analyzes the market from both trend and momentum dimensions while employing a unique standard deviation exit mechanism to capture trend opportunities and manage risks. The strategy logic is clear, rigorous, and the code implementation is concise and efficient. With proper optimization, this strategy has the potential to become a robust intraday medium-to-high frequency trading strategy. However, it is important to note that any strategy has its limitations, and blind usage may introduce risks. Quantitative trading should not be a mechanical "signal-order" process but rather be built upon a grasp of the overall market situation and prudent risk management. Traders also need to continuously evaluate strategy performance, make timely adjustments, and combine it with their own trading styles and risk tolerance to achieve long-term success.
|
||
|
|
[/trans]
|
||
|
|
|
||
|
|
> Strategy Arguments
|
||
|
|
|
||
|
|
|
||
|
|
|
||
|
|
|Argument|Default|Description|
|
||
|
|
|----|----|----|
|
||
|
|
|v_input_bool_1|true|(?Entry Conditions)Use EMA Filter|
|
||
|
|
|v_input_int_1|55|EMA Filter Length|
|
||
|
|
|v_input_int_2|4|SamG Configurable Candle Count for Entry|
|
||
|
|
|v_input_int_3|12|(?Exit Conditions)Exit EMA Length|
|
||
|
|
|v_input_float_1|0.5|Exit Std Dev Multiplier|
|
||
|
|
|
||
|
|
|
||
|
|
> Source (PineScript)
|
||
|
|
|
||
|
|
``` pinescript
|
||
|
|
/*backtest
|
||
|
|
start: 2023-03-22 00:00:00
|
||
|
|
end: 2024-03-27 00:00:00
|
||
|
|
period: 1d
|
||
|
|
basePeriod: 1h
|
||
|
|
exchanges: [{"eid":"Futures_Binance","currency":"BTC_USDT"}]
|
||
|
|
*/
|
||
|
|
|
||
|
|
//@version=5
|
||
|
|
strategy("Candle Height Breakout with Configurable Exit and Signal Control", shorttitle="CHB Single Signal", overlay=true)
|
||
|
|
|
||
|
|
// Input parameters for EMA filter and its length
|
||
|
|
useEmaFilter = input.bool(true, "Use EMA Filter", group="Entry Conditions")
|
||
|
|
emaFilterLength = input.int(55, "EMA Filter Length", minval=1, group="Entry Conditions")
|
||
|
|
candleCount = input.int(4, "SamG Configurable Candle Count for Entry", minval=3, maxval=4, step=1, group="Entry Conditions")
|
||
|
|
exitEmaLength = input.int(12, "Exit EMA Length", minval=1, group="Exit Conditions", defval=12)
|
||
|
|
exitStdDevMultiplier = input.float(0.5, "Exit Std Dev Multiplier", minval=0.1, maxval=2.0, step=0.1, group="Exit Conditions")
|
||
|
|
|
||
|
|
// State variables to track if we are in a long or short position
|
||
|
|
var bool inLong = false
|
||
|
|
var bool inShort = false
|
||
|
|
|
||
|
|
// Calculating EMAs with fixed periods for visual reference
|
||
|
|
ema6 = ta.ema(close, 6)
|
||
|
|
ema8 = ta.ema(close, 8)
|
||
|
|
ema12 = ta.ema(close, 12)
|
||
|
|
ema55 = ta.ema(close, 55)
|
||
|
|
ema100 = ta.ema(close, 100)
|
||
|
|
ema150 = ta.ema(close, 150)
|
||
|
|
ema200 = ta.ema(close, 200)
|
||
|
|
emaFilter = ta.ema(close, emaFilterLength)
|
||
|
|
exitEma = ta.ema(close, exitEmaLength)
|
||
|
|
|
||
|
|
// Plotting EMAs
|
||
|
|
plot(ema6, "EMA 6", color=color.red)
|
||
|
|
plot(ema8, "EMA 8", color=color.orange)
|
||
|
|
plot(ema12, "EMA 12", color=color.yellow)
|
||
|
|
plot(ema55, "EMA 55", color=color.green)
|
||
|
|
plot(ema100, "EMA 100", color=color.blue)
|
||
|
|
plot(ema150, "EMA 150", color=color.purple)
|
||
|
|
plot(ema200, "EMA 200", color=color.fuchsia)
|
||
|
|
plot(emaFilter, "EMA Filter", color=color.black)
|
||
|
|
plot(exitEma, "Exit EMA", color=color.gray)
|
||
|
|
|
||
|
|
// Calculating the highest and lowest of the last N candles based on user input
|
||
|
|
highestOfN = ta.highest(high[1], candleCount)
|
||
|
|
lowestOfN = ta.lowest(low[1], candleCount)
|
||
|
|
|
||
|
|
// Entry Conditions with EMA Filter
|
||
|
|
longEntryCondition = not inLong and not inShort and (close > highestOfN) and (not useEmaFilter or (useEmaFilter and close > emaFilter))
|
||
|
|
shortEntryCondition = not inLong and not inShort and (close < lowestOfN) and (not useEmaFilter or (useEmaFilter and close < emaFilter))
|
||
|
|
|
||
|
|
// Update position state on entry
|
||
|
|
if (longEntryCondition)
|
||
|
|
strategy.entry("Buy", strategy.long, comment="B")
|
||
|
|
inLong := true
|
||
|
|
inShort := false
|
||
|
|
|
||
|
|
if (shortEntryCondition)
|
||
|
|
strategy.entry("Sell", strategy.short, comment="S")
|
||
|
|
inLong := false
|
||
|
|
inShort := true
|
||
|
|
|
||
|
|
// Exit Conditions based on configurable EMA and Std Dev Multiplier
|
||
|
|
smaForExit = ta.sma(close, exitEmaLength)
|
||
|
|
upperExitBand = smaForExit + exitStdDevMultiplier * ta.stdev(close, exitEmaLength)
|
||
|
|
lowerExitBand = smaForExit - exitStdDevMultiplier * ta.stdev(close, exitEmaLength)
|
||
|
|
|
||
|
|
exitConditionLong = inLong and (close < upperExitBand or close < exitEma)
|
||
|
|
exitConditionShort = inShort and (close > lowerExitBand or close > exitEma)
|
||
|
|
|
||
|
|
// Strategy exits
|
||
|
|
if (exitConditionLong)
|
||
|
|
strategy.close("Buy", comment="Exit")
|
||
|
|
inLong := false
|
||
|
|
|
||
|
|
if (exitConditionShort)
|
||
|
|
strategy.close("Sell", comment="Exit")
|
||
|
|
inShort := false
|
||
|
|
|
||
|
|
// Visualizing entry and exit points
|
||
|
|
plotshape(series=longEntryCondition, style=shape.labelup, location=location.belowbar, color=color.green, size=size.tiny, title="Buy Signal", text="B")
|
||
|
|
plotshape(series=shortEntryCondition, style=shape.labeldown, location=location.abovebar, color=color.red, size=size.tiny, title="Sell Signal", text="S")
|
||
|
|
|
||
|
|
```
|
||
|
|
|
||
|
|
> Detail
|
||
|
|
|
||
|
|
https://www.fmz.com/strategy/446428
|
||
|
|
|
||
|
|
> Last Modified
|
||
|
|
|
||
|
|
2024-03-28 16:13:45
|