161 lines
10 KiB
Markdown
161 lines
10 KiB
Markdown

|
|
||
|
|
> Name
|
||
|
|
|
||
|
|
均值回归型布林带美元成本平均投资策略-Mean-Reversion-Bollinger-Band-Dollar-Cost-Averaging-Investment-Strategy
|
||
|
|
|
||
|
|
> Author
|
||
|
|
|
||
|
|
ChaoZhang
|
||
|
|
|
||
|
|
> Strategy Description
|
||
|
|
|
||
|
|
|
||
|
|
|
||
|
|
[trans]
|
||
|
|
#### 概述
|
||
|
|
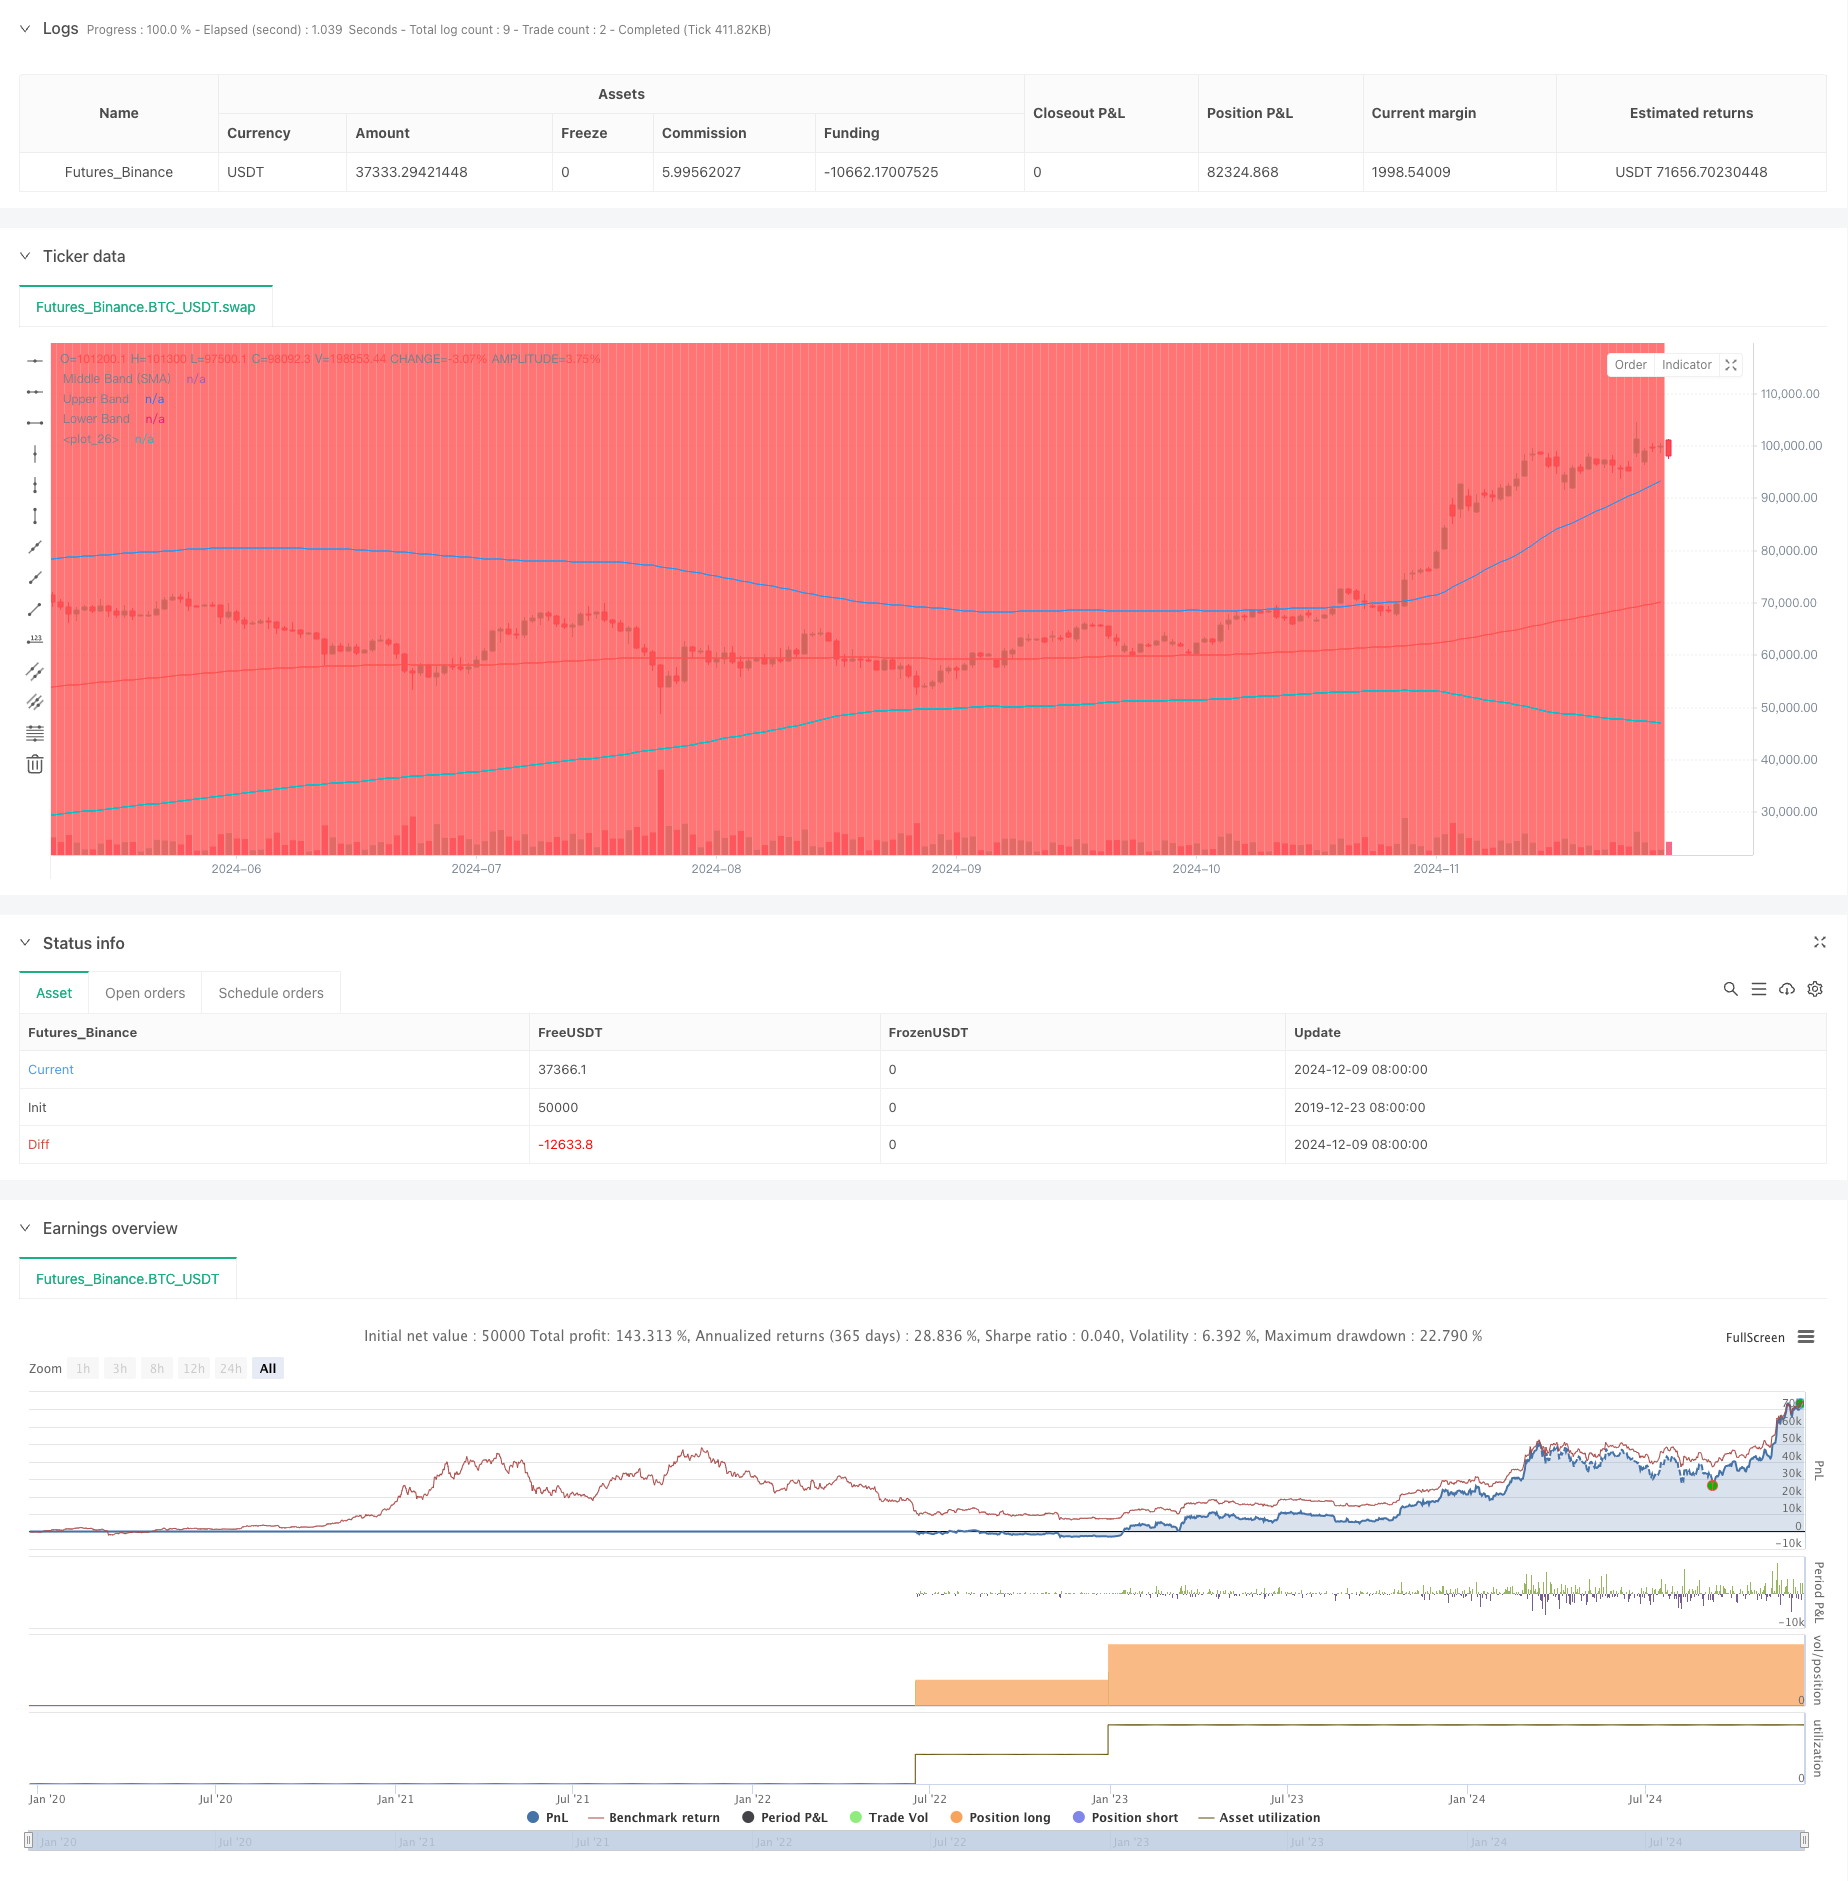
该策略是一个结合了美元成本平均法(DCA)和布林带技术指标的智能投资策略。它通过系统性地在价格回调期间建仓,利用均值回归原理进行投资。该策略的核心是在价格跌破布林带下轨时执行固定金额的买入操作,从而在市场调整时期获得更好的入场价格。
|
||
|
|
|
||
|
|
#### 策略原理
|
||
|
|
策略的核心原理建立在三个基础之上:1)美元成本平均法,通过定期投入固定金额来降低择时风险;2)均值回归理论,认为价格终将回归到其历史平均水平;3)布林带指标,用于识别超买超卖区域。当价格突破布林带下轨时触发买入信号,买入数量由设定的投资金额除以当前价格决定。策略使用200周期指数移动平均线作为布林带的中轨,标准差倍数为2,以此来界定上下轨。
|
||
|
|
|
||
|
|
#### 策略优势
|
||
|
|
1. 降低择时风险 - 通过系统性买入而非主观判断来降低人为误差
|
||
|
|
2. 把握回调机会 - 在价格超跌时自动执行买入操作
|
||
|
|
3. 灵活的参数设置 - 可根据不同市场环境调整布林带参数和投资金额
|
||
|
|
4. 明确的进出场规则 - 基于技术指标的客观信号
|
||
|
|
5. 自动化执行 - 无需人工干预,避免情绪化交易
|
||
|
|
|
||
|
|
#### 策略风险
|
||
|
|
1. 均值回归失效风险 - 在趋势市场中可能会产生较多虚假信号
|
||
|
|
2. 资金管理风险 - 需要预留足够资金应对连续买入信号
|
||
|
|
3. 参数优化风险 - 过度优化可能导致策略失效
|
||
|
|
4. 市场环境依赖 - 在剧烈波动市场中表现可能不佳
|
||
|
|
建议采用严格的资金管理制度,并定期评估策略表现来管理这些风险。
|
||
|
|
|
||
|
|
#### 策略优化方向
|
||
|
|
1. 引入趋势过滤器,避免在强势趋势中逆势操作
|
||
|
|
2. 增加多重时间周期确认机制
|
||
|
|
3. 优化资金管理系统,根据波动率动态调整投资金额
|
||
|
|
4. 加入获利了结机制,在价格回归均值时获利了结
|
||
|
|
5. 考虑结合其他技术指标,提高信号可靠性
|
||
|
|
|
||
|
|
#### 总结
|
||
|
|
这是一个将技术分析与系统化投资方法相结合的稳健策略。通过布林带来识别超跌机会,配合美元成本平均法来降低风险。策略的成功关键在于参数的合理设置和严格的执行纪律。虽然存在一定风险,但通过持续优化和风险管理可以提高策略的稳定性。 ||
|
||
|
|
|
||
|
|
#### Overview
|
||
|
|
This strategy is an intelligent investment approach that combines Dollar-Cost Averaging (DCA) with Bollinger Bands technical indicator. It systematically builds positions during price pullbacks by leveraging mean reversion principles. The core mechanism executes fixed-amount purchases when prices break below the lower Bollinger Band, aiming to achieve better entry prices during market corrections.
|
||
|
|
|
||
|
|
#### Strategy Principles
|
||
|
|
The strategy is built on three fundamental pillars: 1) Dollar-Cost Averaging, which reduces timing risk through regular fixed-amount investments; 2) Mean Reversion Theory, which assumes prices will eventually return to their historical average; 3) Bollinger Bands indicator for identifying overbought and oversold zones. Buy signals are triggered when price breaks below the lower band, with purchase quantity determined by dividing the set investment amount by current price. The strategy employs a 200-period EMA as the middle band with a standard deviation multiplier of 2 to define the upper and lower bands.
|
||
|
|
|
||
|
|
#### Strategy Advantages
|
||
|
|
1. Reduced Timing Risk - Systematic buying rather than subjective judgment reduces human error
|
||
|
|
2. Capturing Pullbacks - Automatic execution of purchases during oversold conditions
|
||
|
|
3. Flexible Parameters - Adjustable Bollinger Band parameters and investment amounts for different market conditions
|
||
|
|
4. Clear Entry/Exit Rules - Objective signals based on technical indicators
|
||
|
|
5. Automated Execution - No manual intervention needed, avoiding emotional trading
|
||
|
|
|
||
|
|
#### Strategy Risks
|
||
|
|
1. Mean Reversion Failure Risk - May generate false signals in trending markets
|
||
|
|
2. Capital Management Risk - Requires sufficient capital reserve for consecutive buy signals
|
||
|
|
3. Parameter Optimization Risk - Over-optimization may lead to strategy failure
|
||
|
|
4. Market Environment Dependency - May underperform in highly volatile markets
|
||
|
|
Recommended to implement strict capital management rules and regularly evaluate strategy performance to manage these risks.
|
||
|
|
|
||
|
|
#### Strategy Optimization Directions
|
||
|
|
1. Incorporate trend filters to avoid counter-trend operations in strong trends
|
||
|
|
2. Add multiple timeframe confirmation mechanisms
|
||
|
|
3. Optimize capital management system with volatility-based position sizing
|
||
|
|
4. Implement profit-taking mechanisms when price reverts to mean
|
||
|
|
5. Consider combining with other technical indicators to improve signal reliability
|
||
|
|
|
||
|
|
#### Summary
|
||
|
|
This is a robust strategy that combines technical analysis with systematic investment methods. It uses Bollinger Bands to identify oversold opportunities while implementing Dollar-Cost Averaging to reduce risk. The key to success lies in proper parameter settings and strict execution discipline. While risks exist, continuous optimization and risk management can improve strategy stability.[/trans]
|
||
|
|
|
||
|
|
|
||
|
|
|
||
|
|
> Source (PineScript)
|
||
|
|
|
||
|
|
``` pinescript
|
||
|
|
/*backtest
|
||
|
|
start: 2019-12-23 08:00:00
|
||
|
|
end: 2024-12-10 08:00:00
|
||
|
|
period: 1d
|
||
|
|
basePeriod: 1d
|
||
|
|
exchanges: [{"eid":"Futures_Binance","currency":"BTC_USDT"}]
|
||
|
|
*/
|
||
|
|
|
||
|
|
//@version=5
|
||
|
|
strategy("DCA Strategy with Mean Reversion and Bollinger Band", overlay=true) // Define the strategy name and set overlay=true to display on the main chart
|
||
|
|
|
||
|
|
// Inputs for investment amount and dates
|
||
|
|
investment_amount = input.float(10000, title="Investment Amount (USD)", tooltip="Amount to be invested in each buy order (in USD)") // Amount to invest in each buy order
|
||
|
|
open_date = input(timestamp("2024-01-01 00:00:00"), title="Open All Positions On", tooltip="Date when to start opening positions for DCA strategy") // Date to start opening positions
|
||
|
|
close_date = input(timestamp("2024-08-04 00:00:00"), title="Close All Positions On", tooltip="Date when to close all open positions for DCA strategy") // Date to close all positions
|
||
|
|
|
||
|
|
// Bollinger Band parameters
|
||
|
|
source = input.source(title="Source", defval=close, group="Bollinger Band Parameter", tooltip="The price source to calculate the Bollinger Bands (e.g., closing price)") // Source of price for calculating Bollinger Bands (e.g., closing price)
|
||
|
|
length = input.int(200, minval=1, title='Period', group="Bollinger Band Parameter", tooltip="Period for the Bollinger Band calculation (e.g., 200-period moving average)") // Period for calculating the Bollinger Bands (e.g., 200-period moving average)
|
||
|
|
mult = input.float(2, minval=0.1, maxval=50, step=0.1, title='Standard Deviation', group="Bollinger Band Parameter", tooltip="Multiplier for the standard deviation to define the upper and lower bands") // Multiplier for the standard deviation to calculate the upper and lower bands
|
||
|
|
|
||
|
|
// Timeframe selection for Bollinger Bands
|
||
|
|
tf = input.timeframe(title="Bollinger Band Timeframe", defval="240", group="Bollinger Band Parameter", tooltip="The timeframe used to calculate the Bollinger Bands (e.g., 4-hour chart)") // Timeframe for calculating the Bollinger Bands (e.g., 4-hour chart)
|
||
|
|
|
||
|
|
// Calculate BB for the chosen timeframe using security
|
||
|
|
[basis, bb_dev] = request.security(syminfo.tickerid, tf, [ta.ema(source, length), mult * ta.stdev(source, length)]) // Calculate Basis (EMA) and standard deviation for the chosen timeframe
|
||
|
|
upper = basis + bb_dev // Calculate the Upper Band by adding the standard deviation to the Basis
|
||
|
|
lower = basis - bb_dev // Calculate the Lower Band by subtracting the standard deviation from the Basis
|
||
|
|
|
||
|
|
// Plot Bollinger Bands
|
||
|
|
plot(basis, color=color.red, title="Middle Band (SMA)") // Plot the middle band (Basis, EMA) in red
|
||
|
|
plot(upper, color=color.blue, title="Upper Band") // Plot the Upper Band in blue
|
||
|
|
plot(lower, color=color.blue, title="Lower Band") // Plot the Lower Band in blue
|
||
|
|
fill(plot(upper), plot(lower), color=color.blue, transp=90) // Fill the area between Upper and Lower Bands with blue color at 90% transparency
|
||
|
|
|
||
|
|
// Define buy condition based on Bollinger Band
|
||
|
|
buy_condition = ta.crossunder(source, lower) // Define the buy condition when the price crosses under the Lower Band (Mean Reversion strategy)
|
||
|
|
|
||
|
|
// Execute buy orders on the Bollinger Band Mean Reversion condition
|
||
|
|
if (buy_condition ) // Check if the buy condition is true and time is within the open and close date range
|
||
|
|
strategy.order("DCA Buy", strategy.long, qty=investment_amount / close) // Execute the buy order with the specified investment amount
|
||
|
|
|
||
|
|
// Close all positions on the specified date
|
||
|
|
if (time >= close_date) // Check if the current time is after the close date
|
||
|
|
strategy.close_all() // Close all open positions
|
||
|
|
|
||
|
|
// Track the background color state
|
||
|
|
var color bgColor = na // Initialize a variable to store the background color (set to 'na' initially)
|
||
|
|
|
||
|
|
// Update background color based on conditions
|
||
|
|
if close > upper // If the close price is above the Upper Band
|
||
|
|
bgColor := color.red // Set the background color to red
|
||
|
|
else if close < lower // If the close price is below the Lower Band
|
||
|
|
bgColor := color.green // Set the background color to green
|
||
|
|
|
||
|
|
// Apply the background color
|
||
|
|
bgcolor(bgColor, transp=90, title="Background Color Based on Bollinger Bands") // Set the background color based on the determined condition with 90% transparency
|
||
|
|
|
||
|
|
// Postscript:
|
||
|
|
// 1. Once you have set the "Investment Amount (USD)" in the input box, proceed with additional configuration.
|
||
|
|
// Go to "Properties" and adjust the "Initial Capital" value by calculating it as "Total Closed Trades" multiplied by "Investment Amount (USD)"
|
||
|
|
// to ensure the backtest results are aligned correctly with the actual investment values.
|
||
|
|
//
|
||
|
|
// Example:
|
||
|
|
// Investment Amount (USD) = 100 USD
|
||
|
|
// Total Closed Trades = 10
|
||
|
|
// Initial Capital = 10 x 100 = 1,000 USD
|
||
|
|
|
||
|
|
// Investment Amount (USD) = 200 USD
|
||
|
|
// Total Closed Trades = 24
|
||
|
|
// Initial Capital = 24 x 200 = 4,800 USD
|
||
|
|
|
||
|
|
```
|
||
|
|
|
||
|
|
> Detail
|
||
|
|
|
||
|
|
https://www.fmz.com/strategy/474879
|
||
|
|
|
||
|
|
> Last Modified
|
||
|
|
|
||
|
|
2024-12-12 17:17:15
|