146 lines
6.5 KiB
Markdown
146 lines
6.5 KiB
Markdown

|
|
||
|
|
> Name
|
||
|
|
|
||
|
|
双重均线汇聚指标交叉策略-Dual-BBI-Bulls-and-Bears-Index-Crossover-Strategy
|
||
|
|
|
||
|
|
> Author
|
||
|
|
|
||
|
|
ChaoZhang
|
||
|
|
|
||
|
|
> Strategy Description
|
||
|
|
|
||
|
|
|
||
|
|
|
||
|
|
[trans]
|
||
|
|
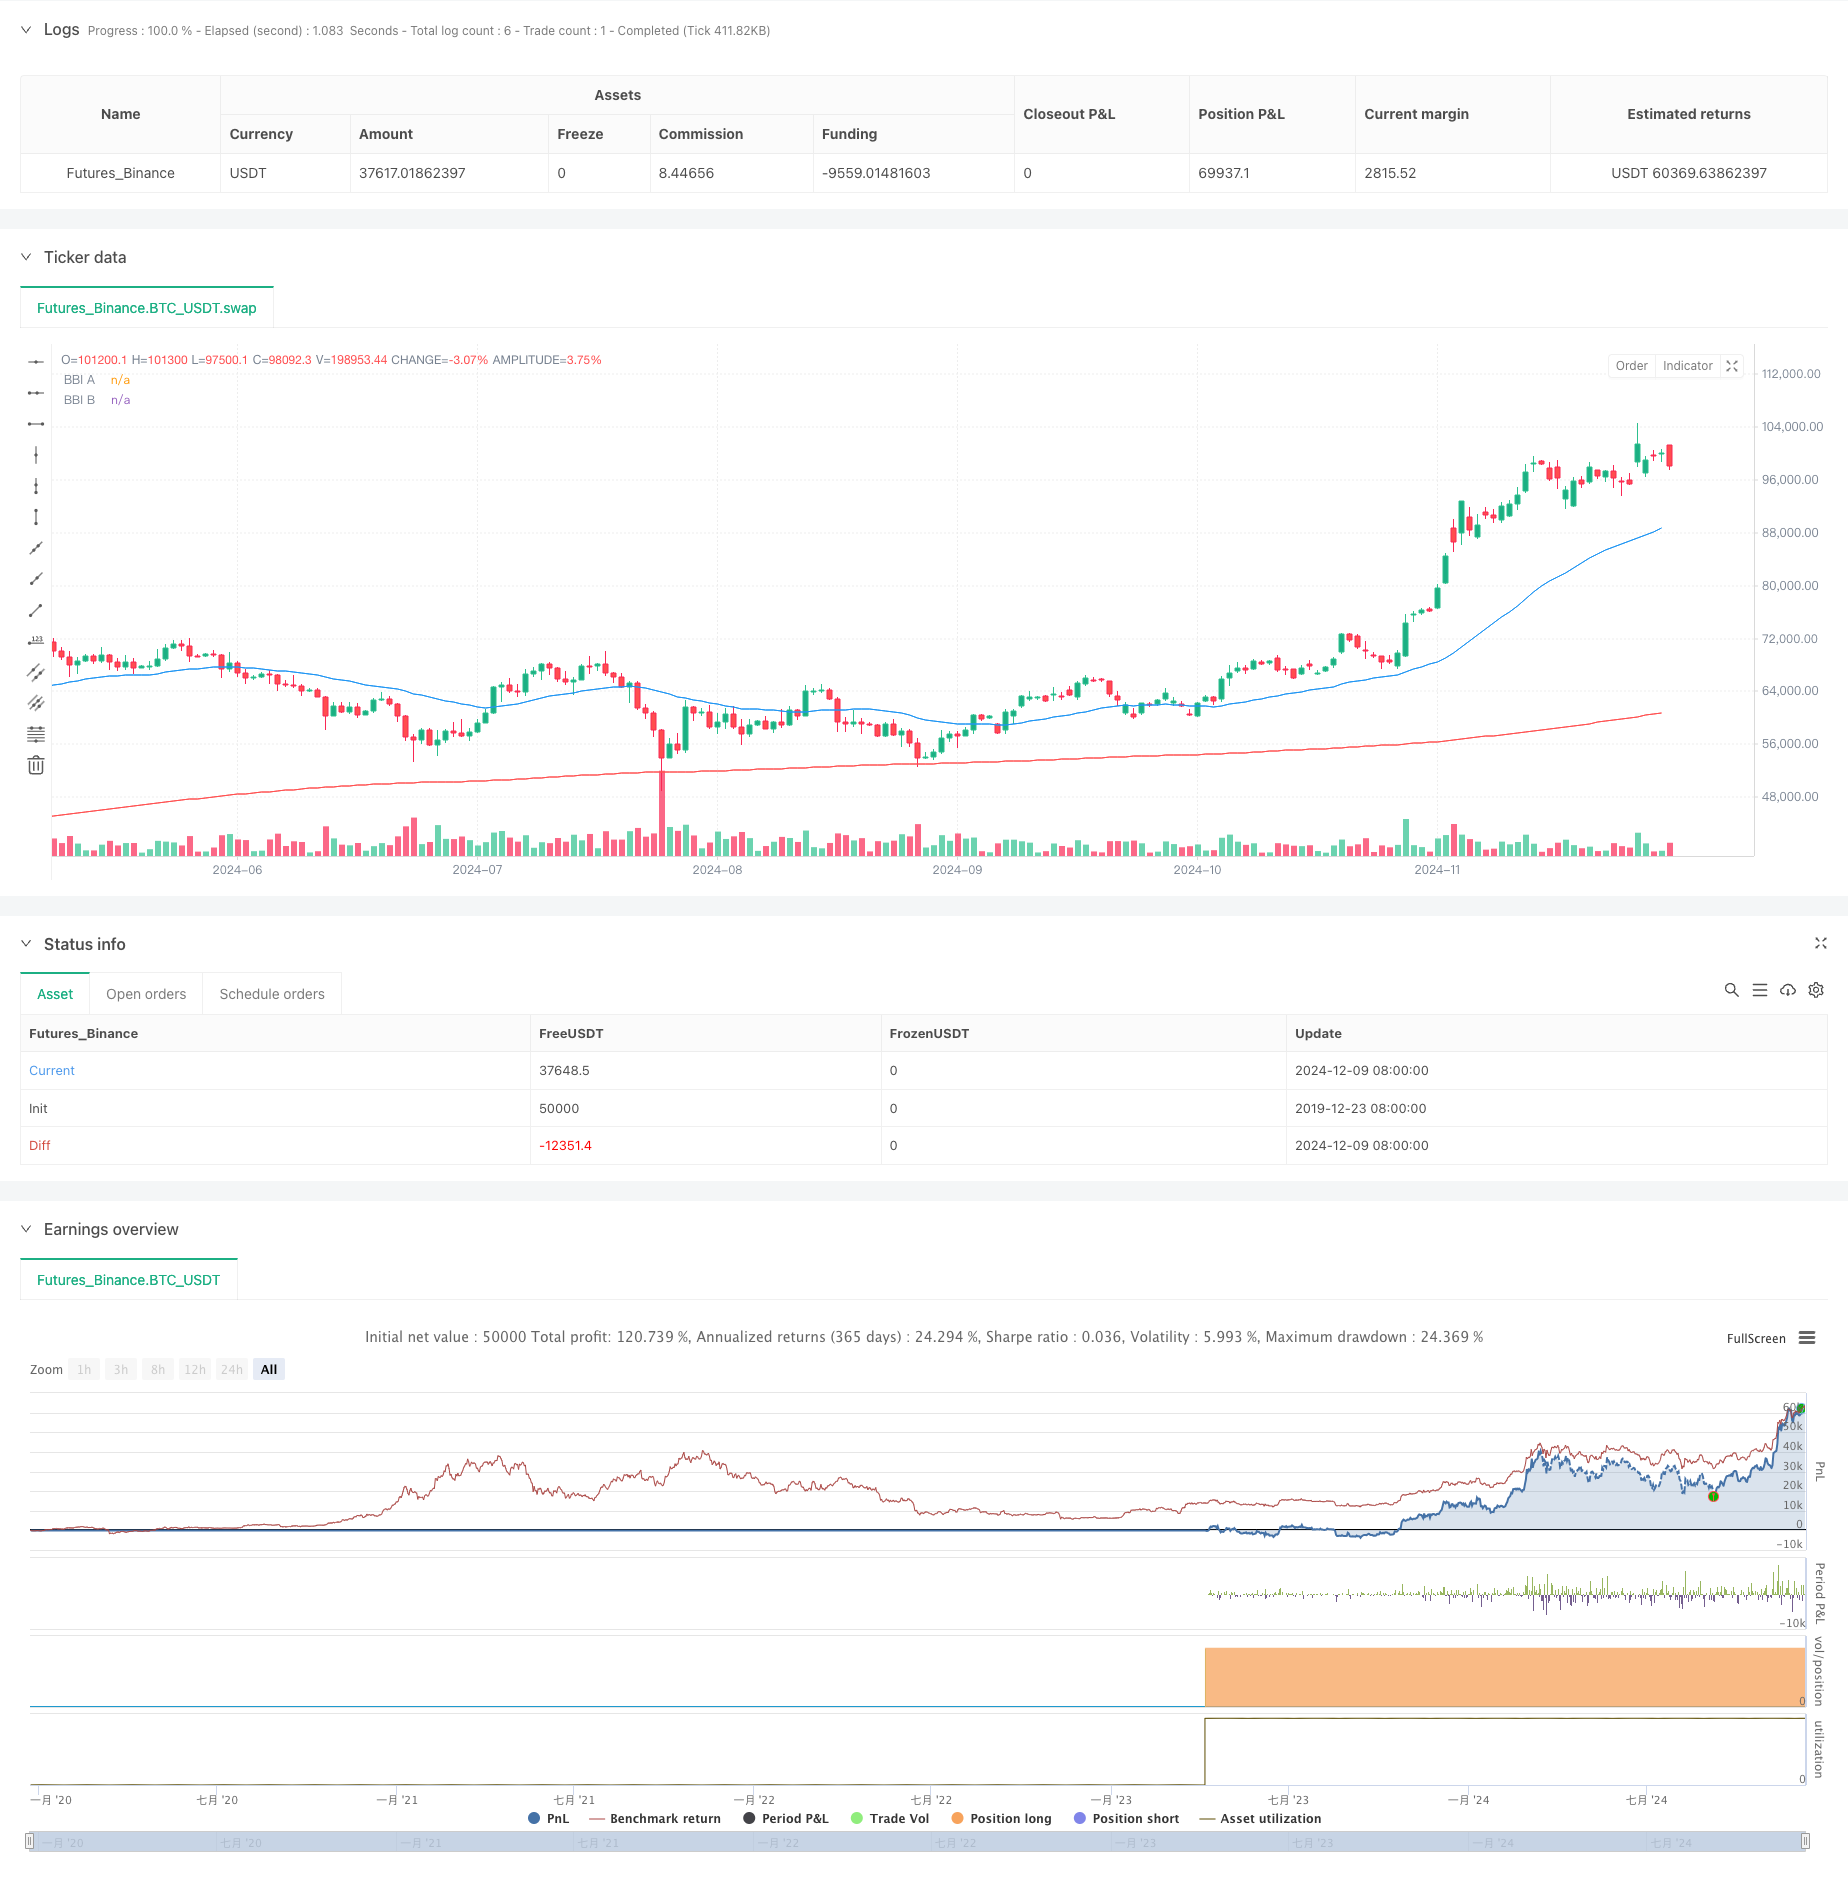
这是一个基于两组不同周期的均线汇聚指标(BBI)交叉信号进行交易的策略。策略通过比较短周期和长周期BBI的交叉来捕捉市场趋势变化,从而进行交易决策。
|
||
|
|
|
||
|
|
#### 策略概述
|
||
|
|
该策略使用了两组BBI指标,每组包含4个不同周期的简单移动平均线(SMA)。A组使用较短的周期(12/24/48/80),用于捕捉较短期的价格趋势;B组使用较长的周期(120/240/480/600),用于确认长期趋势。当短周期BBI上穿长周期BBI时开仓做多,下穿时平仓。
|
||
|
|
|
||
|
|
#### 策略原理
|
||
|
|
1. 计算两组BBI指标,每组由4个不同周期的简单移动平均线计算得出
|
||
|
|
2. A组BBI = (SMA12 + SMA24 + SMA48 + SMA80) / 4
|
||
|
|
3. B组BBI = (SMA120 + SMA240 + SMA480 + SMA600) / 4
|
||
|
|
4. 当A组BBI从下方突破B组BBI时,表明短期趋势开始强于长期趋势,此时进场做多
|
||
|
|
5. 当A组BBI从上方跌破B组BBI时,表明短期趋势转弱,此时平仓出场
|
||
|
|
|
||
|
|
#### 策略优势
|
||
|
|
1. 通过使用多重移动平均线组合,有效降低了单一指标的虚假信号
|
||
|
|
2. 结合短期和长期趋势判断,提高了交易信号的可靠性
|
||
|
|
3. 策略逻辑简单清晰,易于理解和执行
|
||
|
|
4. 具有良好的趋势跟踪特性,能够捕捉较大的趋势性行情
|
||
|
|
|
||
|
|
#### 策略风险
|
||
|
|
1. 在震荡市场中可能产生频繁的交叉信号,导致过度交易
|
||
|
|
2. 入场和出场均有一定滞后性,可能错过最佳价格
|
||
|
|
3. 没有考虑风险控制措施,如止损止盈设置
|
||
|
|
4. 在剧烈波动市场中可能出现较大回撤
|
||
|
|
|
||
|
|
#### 策略优化方向
|
||
|
|
1. 增加趋势确认指标,如RSI或MACD,以过滤虚假信号
|
||
|
|
2. 添加止损止盈机制,控制单次交易风险
|
||
|
|
3. 优化BBI周期参数,可根据不同市场特征调整
|
||
|
|
4. 考虑加入成交量指标,提高信号可靠性
|
||
|
|
5. 增加市场波动率过滤器,在高波动率期间降低交易频率
|
||
|
|
|
||
|
|
#### 总结
|
||
|
|
该策略通过比较不同周期BBI指标的交叉来捕捉市场趋势,具有逻辑清晰、易于执行的特点。但仍需要增加风险控制措施并针对不同市场情况进行参数优化,以提高策略的稳定性和可靠性。建议在实盘交易前进行充分的回测验证,并结合其他技术指标进行交易决策。 ||
|
||
|
|
|
||
|
|
This strategy is based on the crossover signals between two groups of Bulls and Bears Index (BBI) with different periods. It captures market trend changes by comparing the crossover of short-period and long-period BBIs for trading decisions.
|
||
|
|
|
||
|
|
#### Strategy Overview
|
||
|
|
The strategy employs two groups of BBI indicators, each consisting of 4 Simple Moving Averages (SMA) with different periods. Group A uses shorter periods (12/24/48/80) to capture short-term price trends, while Group B uses longer periods (120/240/480/600) to confirm long-term trends. Long positions are opened when the short-period BBI crosses above the long-period BBI and closed when it crosses below.
|
||
|
|
|
||
|
|
#### Strategy Principle
|
||
|
|
1. Calculate two groups of BBI indicators, each derived from 4 SMAs with different periods
|
||
|
|
2. Group A BBI = (SMA12 + SMA24 + SMA48 + SMA80) / 4
|
||
|
|
3. Group B BBI = (SMA120 + SMA240 + SMA480 + SMA600) / 4
|
||
|
|
4. Enter long positions when Group A BBI crosses above Group B BBI, indicating short-term trend becoming stronger than long-term trend
|
||
|
|
5. Exit positions when Group A BBI crosses below Group B BBI, indicating short-term trend weakening
|
||
|
|
|
||
|
|
#### Strategy Advantages
|
||
|
|
1. Reduces false signals through the use of multiple moving average combinations
|
||
|
|
2. Improves signal reliability by combining short-term and long-term trend analysis
|
||
|
|
3. Simple and clear strategy logic, easy to understand and execute
|
||
|
|
4. Good trend-following characteristics, capable of capturing significant trending movements
|
||
|
|
|
||
|
|
#### Strategy Risks
|
||
|
|
1. May generate frequent crossover signals in ranging markets, leading to overtrading
|
||
|
|
2. Entry and exit signals have inherent lag, potentially missing optimal prices
|
||
|
|
3. Lacks risk control measures such as stop-loss and take-profit settings
|
||
|
|
4. May experience significant drawdowns in highly volatile markets
|
||
|
|
|
||
|
|
#### Strategy Optimization Directions
|
||
|
|
1. Add trend confirmation indicators like RSI or MACD to filter false signals
|
||
|
|
2. Implement stop-loss and take-profit mechanisms to control single-trade risk
|
||
|
|
3. Optimize BBI period parameters based on different market characteristics
|
||
|
|
4. Consider incorporating volume indicators to improve signal reliability
|
||
|
|
5. Add volatility filters to reduce trading frequency during high volatility periods
|
||
|
|
|
||
|
|
#### Summary
|
||
|
|
This strategy captures market trends by comparing BBI indicators with different periods, featuring clear logic and easy execution. However, it needs additional risk control measures and parameter optimization for different market conditions to improve stability and reliability. It is recommended to conduct thorough backtesting and combine with other technical indicators before live trading.[/trans]
|
||
|
|
|
||
|
|
|
||
|
|
|
||
|
|
> Source (PineScript)
|
||
|
|
|
||
|
|
``` pinescript
|
||
|
|
/*backtest
|
||
|
|
start: 2019-12-23 08:00:00
|
||
|
|
end: 2024-12-10 08:00:00
|
||
|
|
period: 1d
|
||
|
|
basePeriod: 1d
|
||
|
|
exchanges: [{"eid":"Futures_Binance","currency":"BTC_USDT"}]
|
||
|
|
*/
|
||
|
|
|
||
|
|
// @version=6
|
||
|
|
strategy("BBI 多頭策略", overlay=true)
|
||
|
|
|
||
|
|
// 自訂參數設置
|
||
|
|
input_ma1_a = input(12, title="A組 MA1 週期")
|
||
|
|
input_ma2_a = input(24, title="A組 MA2 週期")
|
||
|
|
input_ma3_a = input(48, title="A組 MA3 週期")
|
||
|
|
input_ma4_a = input(80, title="A組 MA4 週期")
|
||
|
|
input_ma1_b = input(120, title="B組 MA1 週期")
|
||
|
|
input_ma2_b = input(240, title="B組 MA2 週期")
|
||
|
|
input_ma3_b = input(480, title="B組 MA3 週期")
|
||
|
|
input_ma4_b = input(600, title="B組 MA4 週期")
|
||
|
|
|
||
|
|
// 設定 A 組 BBI
|
||
|
|
ma1_a = ta.sma(close, input_ma1_a)
|
||
|
|
ma2_a = ta.sma(close, input_ma2_a)
|
||
|
|
ma3_a = ta.sma(close, input_ma3_a)
|
||
|
|
ma4_a = ta.sma(close, input_ma4_a)
|
||
|
|
bbi_a = (ma1_a + ma2_a + ma3_a + ma4_a) / 4
|
||
|
|
|
||
|
|
// 設定 B 組 BBI
|
||
|
|
ma1_b = ta.sma(close, input_ma1_b)
|
||
|
|
ma2_b = ta.sma(close, input_ma2_b)
|
||
|
|
ma3_b = ta.sma(close, input_ma3_b)
|
||
|
|
ma4_b = ta.sma(close, input_ma4_b)
|
||
|
|
bbi_b = (ma1_b + ma2_b + ma3_b + ma4_b) / 4
|
||
|
|
|
||
|
|
// 當 A 組 BBI 上穿 B 組 BBI 時,執行做多策略
|
||
|
|
long_condition = ta.crossover(bbi_a, bbi_b)
|
||
|
|
if (long_condition)
|
||
|
|
strategy.entry("Long", strategy.long)
|
||
|
|
|
||
|
|
// 當 A 組 BBI 下穿 B 組 BBI 時,平倉
|
||
|
|
close_condition = ta.crossunder(bbi_a, bbi_b)
|
||
|
|
if (close_condition)
|
||
|
|
strategy.close("Long")
|
||
|
|
|
||
|
|
// 繪製 BBI 指標
|
||
|
|
plot(bbi_a, color=color.blue, title="BBI A")
|
||
|
|
plot(bbi_b, color=color.red, title="BBI B")
|
||
|
|
|
||
|
|
```
|
||
|
|
|
||
|
|
> Detail
|
||
|
|
|
||
|
|
https://www.fmz.com/strategy/474806
|
||
|
|
|
||
|
|
> Last Modified
|
||
|
|
|
||
|
|
2024-12-12 11:16:45
|