148 lines
6.9 KiB
Markdown
148 lines
6.9 KiB
Markdown

|
|
||
|
|
> Name
|
||
|
|
|
||
|
|
双移动均线趋势跟踪交易系统结合风险收益比优化策略-Dual-Moving-Average-Trend-Following-Trading-System-with-Risk-Reward-Ratio-Optimization-Strategy
|
||
|
|
|
||
|
|
> Author
|
||
|
|
|
||
|
|
ChaoZhang
|
||
|
|
|
||
|
|
> Strategy Description
|
||
|
|
|
||
|
|
|
||
|
|
|
||
|
|
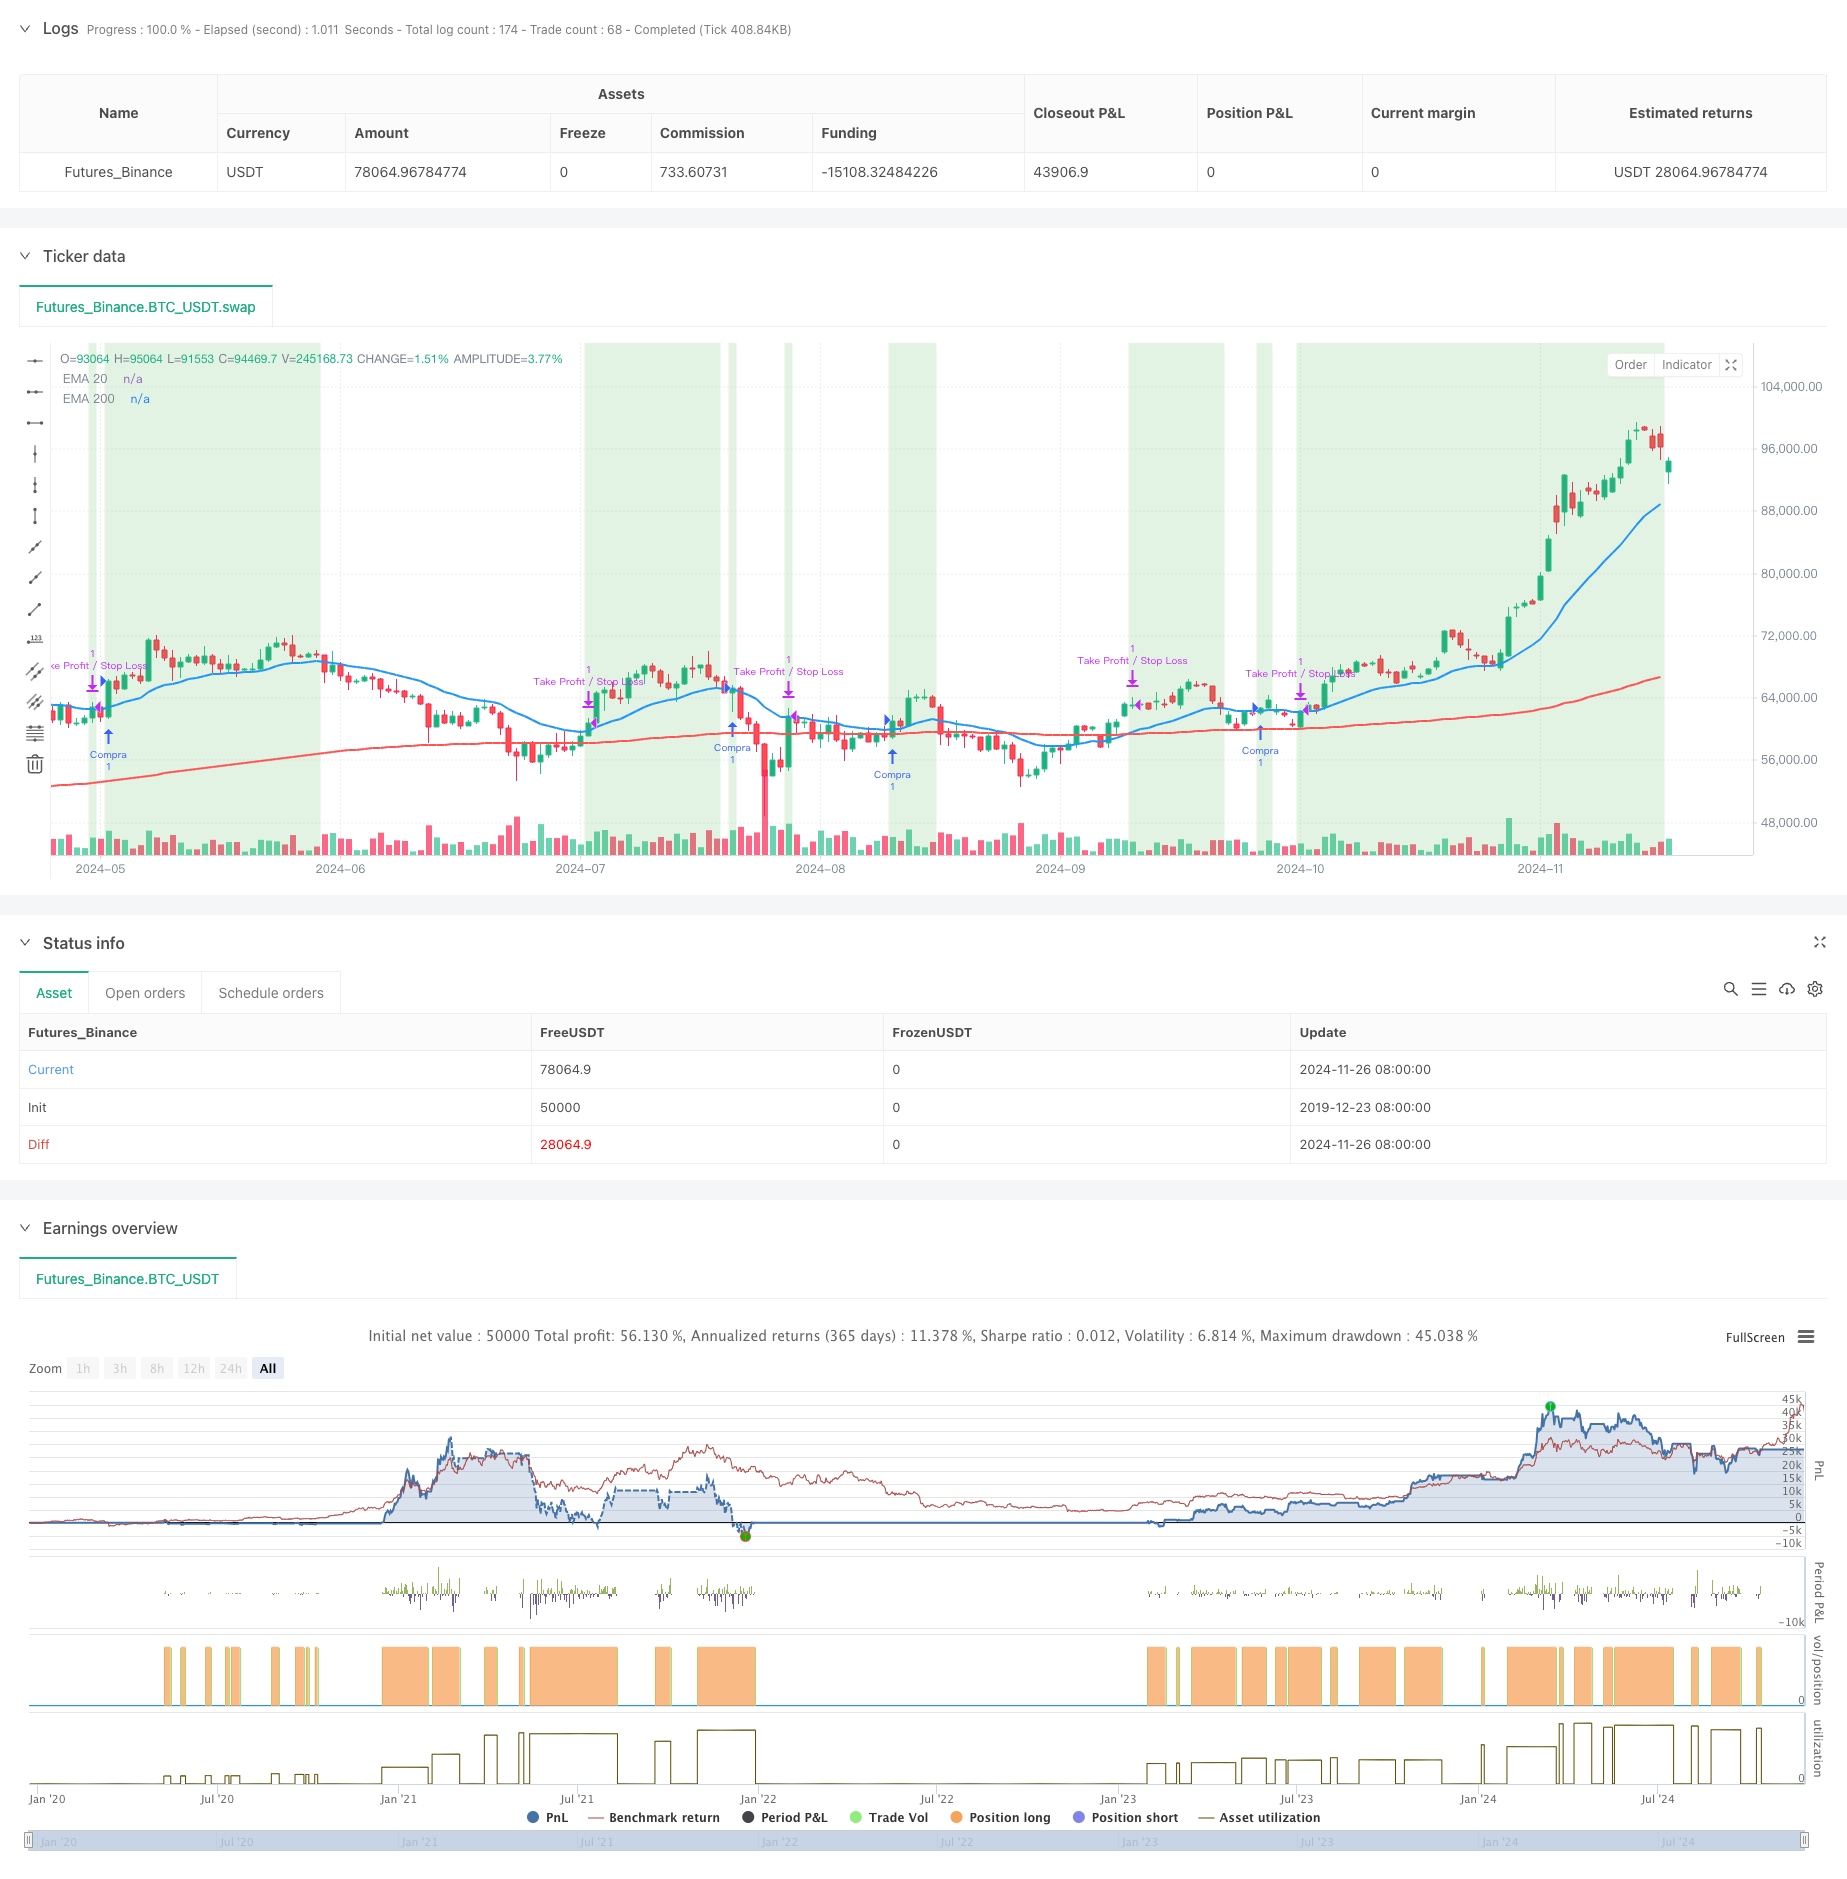
[trans]在量化交易领域中,趋势跟踪策略一直是最受欢迎的交易方法之一。本文将介绍一个基于双均线系统的趋势跟踪策略,该策略通过优化的风险收益比来提高交易效率。
|
||
|
|
|
||
|
|
#### 策略概述
|
||
|
|
该策略采用20日和200日指数移动平均线(EMA)作为主要指标,结合3:1的风险收益比进行交易决策。当价格突破20日均线且20日均线位于200日均线之上时,系统会发出买入信号。每笔交易都设定了固定的止损(-0.5%)和获利(1.5%)水平,以确保风险可控。
|
||
|
|
|
||
|
|
#### 策略原理
|
||
|
|
策略的核心逻辑包含以下几个关键要素:
|
||
|
|
1. 使用20日和200日EMA判断市场趋势,200日均线代表长期趋势,20日均线反映短期走势
|
||
|
|
2. 当价格突破20日均线且20日均线位于200日均线上方时,表明市场处于上升趋势
|
||
|
|
3. 采用3:1的风险收益比,即止盈点(1.5%)是止损点(0.5%)的3倍
|
||
|
|
4. 设置变量跟踪交易状态,避免重复进场
|
||
|
|
5. 当价格跌破20日均线时重置交易状态,为下一次交易做准备
|
||
|
|
|
||
|
|
#### 策略优势
|
||
|
|
1. 双均线系统能够有效过滤市场噪音,提高交易信号的可靠性
|
||
|
|
2. 固定的风险收益比有助于长期稳定盈利
|
||
|
|
3. 清晰的入场和出场规则,减少主观判断
|
||
|
|
4. 自动化程度高,易于实现和回测
|
||
|
|
5. 风险控制机制完善,每笔交易都有明确的止损位
|
||
|
|
|
||
|
|
#### 策略风险
|
||
|
|
1. 在横盘市场可能产生频繁的假信号
|
||
|
|
2. 固定的止损止盈位置可能不适应所有市场环境
|
||
|
|
3. 未考虑交易成本可能影响实际收益
|
||
|
|
4. 在高波动性市场中,止损位置可能过于接近入场点
|
||
|
|
5. 没有考虑市场流动性因素
|
||
|
|
|
||
|
|
#### 优化方向
|
||
|
|
1. 引入量能指标,提高趋势判断的准确性
|
||
|
|
2. 根据市场波动率动态调整止损止盈位置
|
||
|
|
3. 增加趋势强度过滤器,减少假信号
|
||
|
|
4. 考虑加入市场情绪指标
|
||
|
|
5. 优化仓位管理系统,实现更好的资金管理
|
||
|
|
|
||
|
|
#### 总结
|
||
|
|
这是一个结构完整、逻辑清晰的趋势跟踪策略。通过结合双均线系统和固定的风险收益比,策略在保证收益的同时也很好地控制了风险。虽然还存在一些需要优化的地方,但整体而言这是一个值得进一步研究和改进的交易系统。 ||
|
||
|
|
|
||
|
|
In the field of quantitative trading, trend following strategies have always been one of the most popular trading methods. This article introduces a trend following strategy based on a dual moving average system, which improves trading efficiency through optimized risk-reward ratios.
|
||
|
|
|
||
|
|
#### Strategy Overview
|
||
|
|
This strategy uses 20-day and 200-day exponential moving averages (EMA) as primary indicators, combined with a 3:1 risk-reward ratio for trading decisions. Buy signals are generated when the price breaks above the 20-day EMA and the 20-day EMA is above the 200-day EMA. Each trade has fixed stop-loss (-0.5%) and take-profit (1.5%) levels to ensure controlled risk.
|
||
|
|
|
||
|
|
#### Strategy Principles
|
||
|
|
The core logic includes several key elements:
|
||
|
|
1. Uses 20-day and 200-day EMAs to judge market trends, with the 200-day EMA representing long-term trend and 20-day EMA reflecting short-term movements
|
||
|
|
2. A buy signal is generated when price breaks above the 20-day EMA and the 20-day EMA is above the 200-day EMA, indicating an upward trend
|
||
|
|
3. Employs a 3:1 risk-reward ratio, with take-profit level (1.5%) being three times the stop-loss level (0.5%)
|
||
|
|
4. Uses variables to track trade status and avoid duplicate entries
|
||
|
|
5. Resets trade status when price falls below 20-day EMA, preparing for the next trade
|
||
|
|
|
||
|
|
#### Strategy Advantages
|
||
|
|
1. Dual moving average system effectively filters market noise and improves signal reliability
|
||
|
|
2. Fixed risk-reward ratio supports long-term profitable trading
|
||
|
|
3. Clear entry and exit rules reduce subjective judgment
|
||
|
|
4. High degree of automation, easy to implement and backtest
|
||
|
|
5. Comprehensive risk control mechanism with clear stop-loss levels for each trade
|
||
|
|
|
||
|
|
#### Strategy Risks
|
||
|
|
1. May generate frequent false signals in ranging markets
|
||
|
|
2. Fixed stop-loss and take-profit levels may not suit all market conditions
|
||
|
|
3. Trading costs not considered may affect actual returns
|
||
|
|
4. Stop-loss placement may be too close to entry in high-volatility markets
|
||
|
|
5. Market liquidity factors not considered
|
||
|
|
|
||
|
|
#### Optimization Directions
|
||
|
|
1. Introduce volume indicators to improve trend judgment accuracy
|
||
|
|
2. Dynamically adjust stop-loss and take-profit levels based on market volatility
|
||
|
|
3. Add trend strength filters to reduce false signals
|
||
|
|
4. Consider incorporating market sentiment indicators
|
||
|
|
5. Optimize position management system for better money management
|
||
|
|
|
||
|
|
#### Summary
|
||
|
|
This is a well-structured trend following strategy with clear logic. By combining a dual moving average system with fixed risk-reward ratios, the strategy achieves good returns while maintaining risk control. Though there are areas for optimization, it's overall a trading system worthy of further research and improvement.[/trans]
|
||
|
|
|
||
|
|
|
||
|
|
|
||
|
|
> Source (PineScript)
|
||
|
|
|
||
|
|
``` pinescript
|
||
|
|
/*backtest
|
||
|
|
start: 2019-12-23 08:00:00
|
||
|
|
end: 2024-11-27 00:00:00
|
||
|
|
period: 1d
|
||
|
|
basePeriod: 1d
|
||
|
|
exchanges: [{"eid":"Futures_Binance","currency":"BTC_USDT"}]
|
||
|
|
*/
|
||
|
|
|
||
|
|
//@version=5
|
||
|
|
strategy("Estrategia de Compra con Ratio 3:1", overlay=true)
|
||
|
|
|
||
|
|
// Parámetros de la temporalidad diaria y las EMAs
|
||
|
|
ema20 = ta.ema(close, 20)
|
||
|
|
ema200 = ta.ema(close, 200)
|
||
|
|
|
||
|
|
// Condiciones para la entrada en largo
|
||
|
|
cierre_por_encima_ema20 = close > ema20
|
||
|
|
ema20_mayor_ema200 = ema20 > ema200
|
||
|
|
|
||
|
|
// Variable para registrar si ya se realizó una compra
|
||
|
|
var bool compra_realizada = false
|
||
|
|
|
||
|
|
// Condición para registrar una compra: primera vez que cierra por encima de EMA 20 con EMA 20 > EMA 200
|
||
|
|
if (cierre_por_encima_ema20 and ema20_mayor_ema200 and not compra_realizada)
|
||
|
|
// Abrir una operación de compra
|
||
|
|
strategy.entry("Compra", strategy.long)
|
||
|
|
compra_realizada := true // Registrar que se realizó una compra
|
||
|
|
|
||
|
|
// Definir los niveles de stop loss y take profit basados en el ratio 3:1
|
||
|
|
stop_loss = strategy.position_avg_price * 0.995 // -0.50% (rendimiento)
|
||
|
|
take_profit = strategy.position_avg_price * 1.015 // +1.50% (3:1 ratio)
|
||
|
|
|
||
|
|
// Establecer el stop loss y take profit
|
||
|
|
strategy.exit("Take Profit / Stop Loss", from_entry="Compra", stop=stop_loss, limit=take_profit)
|
||
|
|
|
||
|
|
// Condición para resetear la compra: cuando el precio cierra por debajo de la EMA de 20
|
||
|
|
if (close < ema20)
|
||
|
|
compra_realizada := false // Permitir una nueva operación
|
||
|
|
|
||
|
|
// Ploteo de las EMAs
|
||
|
|
plot(ema20, title="EMA 20", color=color.blue, linewidth=2)
|
||
|
|
plot(ema200, title="EMA 200", color=color.red, linewidth=2)
|
||
|
|
|
||
|
|
// Colorear el fondo cuando el precio está por encima de ambas EMAs
|
||
|
|
bgcolor(cierre_por_encima_ema20 and ema20_mayor_ema200 ? color.new(color.green, 80) : na)
|
||
|
|
|
||
|
|
```
|
||
|
|
|
||
|
|
> Detail
|
||
|
|
|
||
|
|
https://www.fmz.com/strategy/473270
|
||
|
|
|
||
|
|
> Last Modified
|
||
|
|
|
||
|
|
2024-11-28 17:20:13
|